Online Links:
Online Links:
| Access_Constraints | No access constraints. Please see 'Distribution Information' for details. |
|---|---|
| Use_Constraints | These data are marked with a Creative Commons CC0 1.0 Universal License. These data are in the public domain and do not have any use constraints. Users are advised to read the dataset's metadata thoroughly to understand appropriate use and data limitations. Please recognize the U.S. Geological Survey (USGS) as the source of this information. |
| Data format: | Excel format spreadsheet. One for the sediment texture analysis and one for the bottom photograph locations. in format XLS Size: 1 |
|---|---|
| Network links: |
https://pubs.usgs.gov/of/2005/1293/tables/tableA3_1.xls https://pubs.usgs.gov/of/2005/1293/tables/SEDBA1_RAFA04002.xls https://pubs.usgs.gov/of/2005/1293/html/appendix3.html https://pubs.usgs.gov/of/2005/1293/html/appendix1.html https://doi.org/10.3133/ofr20051293 |
| Media you can order: | DVD-ROM (Density 4.75 Gbytes) (format UDF) |
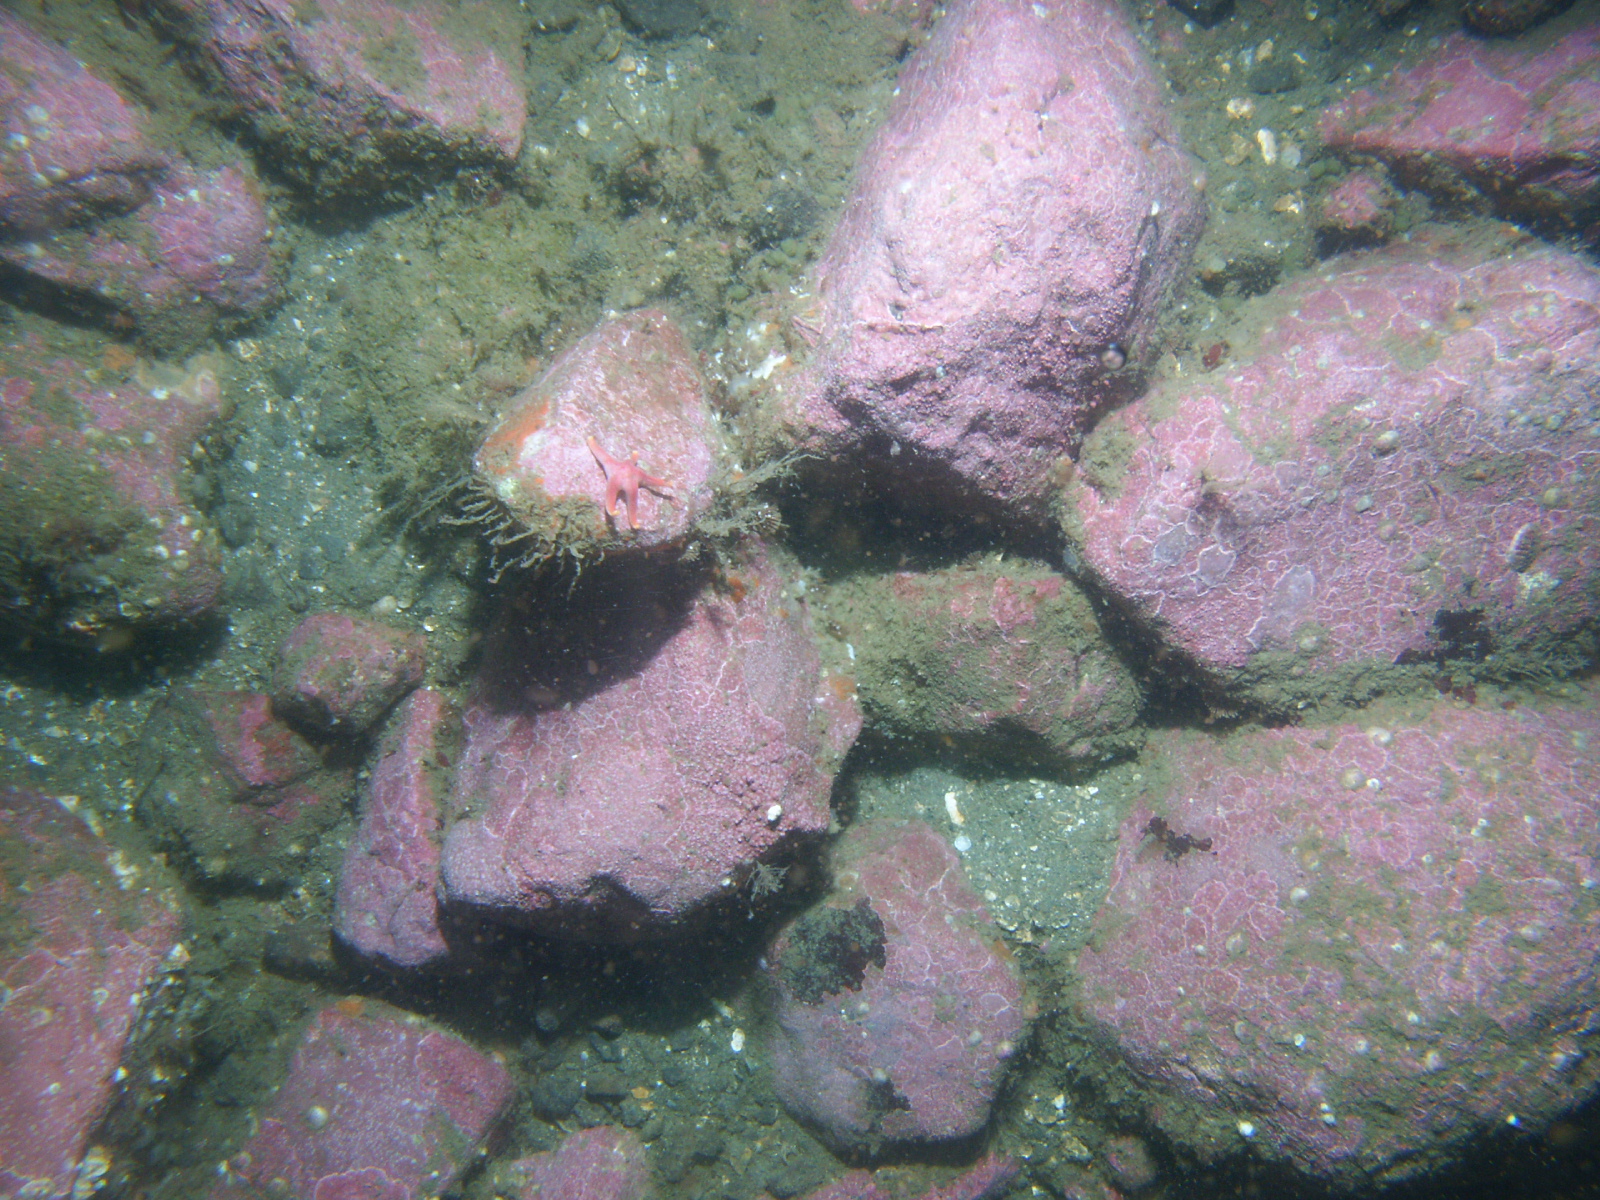
| Data format: | A ZIP file containing 585 bottom photographs. in format JPEG Size: 630 |
|---|---|
| Network links: |
https://pubs.usgs.gov/of/2005/1293/zip/BottomPhotos.ZIP https://pubs.usgs.gov/of/2005/1293/html/appendix1.html https://doi.org/10.3133/ofr20051293 |