5 meter ArcRaster grid (gaps filled) of bathymetry acquired using a SEA Ltd. SWATHplus interferometric sonar offshore of Massachusetts within northern Cape Cod Bay (CCB_BATH_F Esri BINARY GRID, UTM Zone 19N).

Metadata also available as - [Outline] - [Parseable text] - [XML]

Frequently anticipated questions:


What does this data set describe?

Title:
5 meter ArcRaster grid (gaps filled) of bathymetry acquired using a SEA Ltd. SWATHplus interferometric sonar offshore of Massachusetts within northern Cape Cod Bay (CCB_BATH_F Esri BINARY GRID, UTM Zone 19N).
Abstract:
These data were collected under a cooperative agreement with the Massachusetts Office of Coastal Zone Management (CZM) and the U.S. Geological Survey (USGS), Coastal and Marine Geology Program, Woods Hole Coastal and Marine Science Center (WHCMSC). Initiated in 2003, the primary objective of this program is to develop regional geologic framework information for the management of coastal and marine resources. Accurate data and maps of sea-floor geology are important first steps toward protecting fish habitat, delineating marine resources, and assessing environmental changes due to natural or human impacts. The project is focused on the inshore waters of coastal Massachusetts, primarily in water depths of 3-30 meters deep. Data collected for the mapping cooperative have been released in a series of USGS Open-File Reports (http://woodshole.er.usgs.gov/project-pages/coastal_mass/html/current_map.html). The data collected in the study area located in Northern Cape Cod Bay Massachusetts includes high-resolution geophysics (bathymetry, backscatter intensity, and seismic reflection), and ground validation (sediment samples, video tracklines, and bottom photographs). The data were collected during five separate surveys conducted between 2006 and 2008 and cover 480 square kilometers of the inner continental shelf. More information about the individual USGS surveys conducted as part of the northern Cape Cod Bay project can be found on the Woods Hole Coastal and Marine Science Center Field Activity webpage: 06012: http://quashnet.er.usgs.gov/data/2006/06012/ 07001: http://quashnet.er.usgs.gov/data/2007/07001/ 07002: http://quashnet.er.usgs.gov/data/2007/07002/ 07003: http://quashnet.er.usgs.gov/data/2007/07003/ 08002: http://quashnet.er.usgs.gov/data/2008/08002/
  1. How might this data set be cited?
    U.S. Geological Survey, 2010, 5 meter ArcRaster grid (gaps filled) of bathymetry acquired using a SEA Ltd. SWATHplus interferometric sonar offshore of Massachusetts within northern Cape Cod Bay (CCB_BATH_F Esri BINARY GRID, UTM Zone 19N).: Open-File Report 2010-1006, U.S. Geological Survey, Coastal and Marine Geology Program, Woods Hole Coastal and Marine Science Center, Woods Hole, Massachusetts.

    Online Links:

    This is part of the following larger work.

    Andrews, Brian D., Ackerman, Seth D., Baldwin, Wayne E., and Barnhardt, Walter A., 2010, Geophysical and Sampling Data from the Inner Continental Shelf: Northern Cape Cod Bay, Massachusetts.: Open-File Report 2010-1006, U.S. Geological Survey, Reston, VA.

    Online Links:

  2. What geographic area does the data set cover?
    West_Bounding_Coordinate: -70.644046
    East_Bounding_Coordinate: -70.154440
    North_Bounding_Coordinate: 42.094617
    South_Bounding_Coordinate: 41.930583
  3. What does it look like?
    http://pubs.usgs.gov/of/2010/1006/GIS/browse_jpg/CCB_bath_f.jpg (JPEG)
    black and white thumbnail image of bathymetry collected in the Cape Cod Bay Massachusetts survey area.
  4. Does the data set describe conditions during a particular time period?
    Beginning_Date: 16-Aug-2006
    Ending_Date: 07-May-2008
    Currentness_Reference:
    ground condition of four separate date ranges - 20060816 to 20060823; 20070429 to 20070503; 20070725 to 20070807; 20080429 to 20080507
  5. What is the general form of this data set?
    Geospatial_Data_Presentation_Form: raster digital data
  6. How does the data set represent geographic features?
    1. How are geographic features stored in the data set?
      This is a Raster data set. It contains the following raster data types:
      • Dimensions 3512 x 8053 x 1, type Grid Cell
    2. What coordinate system is used to represent geographic features?
      Grid_Coordinate_System_Name: Universal Transverse Mercator
      Universal_Transverse_Mercator:
      UTM_Zone_Number: 19
      Transverse_Mercator:
      Scale_Factor_at_Central_Meridian: 0.999600
      Longitude_of_Central_Meridian: -69.000000
      Latitude_of_Projection_Origin: 0.000000
      False_Easting: 500000.000000
      False_Northing: 0.000000
      Planar coordinates are encoded using row and column
      Abscissae (x-coordinates) are specified to the nearest 5.000000
      Ordinates (y-coordinates) are specified to the nearest 5.000000
      Planar coordinates are specified in meters
      The horizontal datum used is D_WGS_1984.
      The ellipsoid used is WGS_1984.
      The semi-major axis of the ellipsoid used is 6378137.000000.
      The flattening of the ellipsoid used is 1/298.257224.
      Vertical_Coordinate_System_Definition:
      Depth_System_Definition:
      Depth_Datum_Name: Mean lower low water
      Depth_Resolution: 0.5
      Depth_Distance_Units: meters
      Depth_Encoding_Method: Explicit depth coordinate included with horizontal coordinates
  7. How does the data set describe geographic features?
    Value
    Depth in meters below mean lower low water (Source: ESRI)
    Entity_and_Attribute_Overview:
    Bathymetric depth values in ESRI ArcRaster format. Data values represent depth in meters referenced to mean lower low water (MLLW).
    Entity_and_Attribute_Detail_Citation: U.S. Geological Survey

Who produced the data set?

  1. Who are the originators of the data set? (may include formal authors, digital compilers, and editors)
    • U.S. Geological Survey
  2. Who also contributed to the data set?
  3. To whom should users address questions about the data?
    Brian Andrews
    U.S. Geological Survey
    Geographer
    384 Woods Hole Rd.
    Woods Hole, MA
    USA

    508-548-8700 x2348 (voice)
    508-457-2310 (FAX)
    bandrews@usgs.gov

Why was the data set created?

The purpose of this ArcRaster grid is to publish a merged bathymetry grid minimizing data gaps. This grid includes data from the four surveys (06012, 07001, 07002, 08002) where bathymetry was collected by the USGS in the Cape Cod Bay survey area at 5 meter resolution for regional analysis.

How was the data set created?

  1. From what previous works were the data drawn?
    Information unavailable from original metadata. (source 1 of 1)
    Information unavailable from original metadata. Assumed to be USGS., unknown, Information unavailable from original metadata..

    Other_Citation_Details:
    This file had a source contribution, but no other source information. This information had to be modified to meet the standard.
    Type_of_Source_Media: Information unavailable from original metadata.
    Source_Contribution:
    Sonar Configuration: Bathymetry data were acquired using a Systems Engineering and Assessment Ltd. (SEA) SWATHplus interferometric sonar operating at 234 kHz (06012, 07001, 08002) or 117 kHz (07002). Survey lines were run at an average speed of 5 knots and were spaced 75-200 m apart to obtain overlapping swaths of data and full coverage of the seafloor. During USGS field activities 06012 and 07002, the SWATHplus transducers were mounted on a rigid pole on the starboard side of the R/V Megan Miller, about 2.6 m below the waterline. During 06012, a TSS DMS 2-05 motion reference unit was mounted directly above the sonar transducers and continuously recorded and sent vertical displacement (heave) and attitude (pitch and roll) of the vessel during acquisition to the SWATHplus software. During 06012 vessel heading was determined by a KVH compass that was corrected for magnetic variation of +15.583 degrees (from NOAA Chart number13246 36th ed., Mar. 10/01) during post processing. During 07002, a Coda Octopus F180 inertial-motion unit, mounted directly above the transducers, measured true heading, vertical displacement (heave) and attitude (pitch and roll) of the vessel during acquisition. Field activities 07001 and 08002: the SWATHplus transducers were mounted on a rigid pole on the bow of the R/V Rafael, about 0.5 m below the waterline. A Coda Octopus F180 inertial-motion unit, mounted directly above the transducers, measured true heading, vertical displacement (heave) and attitude (pitch and roll) of the vessel during acquisition. Navigation: Field activity 06012: Real-Time Kinematic (RTK) GPS navigation was used to determine the horizontal and vertical position (xyz) of the GPS antenna mounted directly above the SWATHplus transducers with sub-meter accuracy. The RTK-corrected coordinates were transmitted to the ship from a land-based RTK-GPS station established by the USGS at NOAA Tidal Station #8446009 in Brant Rock Harbor, MA. Field activities 07001, 07002, and 08002: Differential GPS (DGPS) navigation was used to determine the horizontal position (x,y) of the GPS antenna mounted directly above and forward (F180R primary antenna, 0.5 meters) of the SWATHplus transducers with +/- 1-2 meter accuracy. RTK-GPS was used to determine the vertical position of the Ashtech GPS antenna (z) with sub-meter accuracy. Vertical coordinates for all four surveys were referenced to Mean Lower Low Water (MLLW) using the offset between the North American Vertical Datum of 1988 (NAVD 88) and MLLW published for the tidal benchmark. Horizontal (x and y) and vertical (z) offsets between the transducers, motion sensor, and GPS antenna were precisely measured and recorded within the SWATHplus acquisition software (SEA Swath Processor (2005)), which established the motion sensor as the common reference point during data acquisition. Speed of Sound: Sound-velocity profiles were collected approximately every 2 hours by a hand-casted Applied MicroSystems SV Plus sound velocimeter. The depth of the transducers below the sea surface was measured and recorded within the SWATHplus acquisition software, and used as a reference point for deriving the acoustic ray path based on sound velocity profiles. Tides: During post-processing, soundings were referenced to local MLLW by using orthometric to chart datum offsets obtained from NOAA Tidal Station #8446009 at Brant Rock Harbor, Massachusetts. Data were processed and gridded by using the SEA SWATHplus Swath Processor (version 10.0) CARIS Hydrographic Information Processing System (HIPS version 6.1).
  2. How were the data generated, processed, and modified?
    Date: 2008 (process 1 of 12)
    Step 1: Process GPS Tides Data all four surveys: Depths were corrected to Mean Lower Low Water (MLLW) using 1 second RTK-GPS heights of the GPS receiver mounted over the SWATHplus sonar head. These heights were extracted from each HYPACK navigation file using the AWK script "doRTK1_by_line_FIX" and smoothed in MATLAB (version 7.20.232 R2006a) using a third order polynomial. The smoothed 1 second heights were averaged to 1 minute heights and formatted for input to Swath Processor using the AWK script "DoRTK2". The resulting ASCII text file was then formatted to the Swath Processor format of HH:MM DD/MM/YYYY TTTTT.TTT and imported to tide table in the SEA Swath Processor session file (sxs). During the next step the tide data is merged into the bathymetric soundings data during the conversion of SWATHplus raw (sxr) files to SWATHplus processed (sxp) files. Processing occurred in 2006, 2007, and 2008. Person who carried out this activity:
    Brian Andrews
    U.S. Geological Survey
    Geographer
    384 Woods Hole Rd.
    Woods Hole, MA
    USA

    508-548-8700 x2348 (voice)
    508-457-2310 (FAX)
    bandrews@usgs.gov
    Date: 2008 (process 2 of 12)
    Step 2: Raw to Processed Conversion all four surveys: Each raw SWATHplus bathymetric sonar file (sxr) was converted to a SWATHplus processed file (sxp) using SEA SWATHplus Swath Processor (ver. 3.5-3.6 depending on the year). During the conversion process, sound velocity profiles were used to minimize potential refraction artifacts from fluctuations in the speed of sound within the water column. Various bathymetric filters were applied to eliminate sounding outliers. During this conversion process the tidal information from the previous process step was merged into the new processed file (sxp). The filters in Swath Processor reduced the appearance of an artifact observed in the port side of the bathymetric data from survey 06012; probably the result of a multi-pathing sound wave off the hull of the survey vessel. Although minimized, this striped artifact may still be visible in the final bathymetry grid, especially in areas of little local relief. Processing occurred in 2006, 2007, and 2008. Person who carried out this activity:
    Brian Andrews
    U.S. Geological Survey
    Geographer
    384 Woods Hole Rd
    Woods Hole, MA
    USA

    508-548-8700 x2348 (voice)
    508-457-2310 (FAX)
    bandrews@usgs.gov
    Date: 2008 (process 3 of 12)
    Step 3:SwathPlus to CARIS Conversion: A new CARIS HIPS project (ver. 6.1) was created for each of the four surveys with projection information set to Universal Transverse Mercator (UTM) Zone 19, WGS84. Each SWATHplus processed file (sxp) was imported to the new CARIS project using the Import/Conversion Wizard. A 5 meter resolution Bathymetric and Statistical Error (BASE) Surface was created from the files for each Julian day. The BASE surface for each day was reviewed for any inconsistencies or data anomalies. Navigation was edited as needed using the navigation editor tool in CARIS. Filters were applied to each line including beam to beam slopes and across track angle. The CARIS refraction editor was used to adjust the speed of sound in some cases to flatten out the depth profiles produced by localized variations in speed of sound through the water column. Small refraction artifacts remain in the flat areas of the southwest corner of the survey area from survey 07002. Processing occurred in 2006, 2007, and 2008. Person who carried out this activity:
    Brian Andrews
    U.S. Geological Survey
    Geographer
    384 Woods Hole Rd
    Woods Hole, MA
    USA

    508-548-8700 x2348 (voice)
    508-457-2310 (FAX)
    bandrews@usgs.gov
    Date: Nov-2009 (process 4 of 12)
    Step 4:Combine HDCS files for all four CARIS projects: Once the bathymetric data for all four separate surveys were edited, tide corrected, and finalized, they were combined into a single CARIS HIPS project that covered the entire Cape Cod Bay survey area. The final BASE surfaces for each of the four surveys were combined into one 5 meter resolution BASE surface for the entire area. Person who carried out this activity:
    Brian Andrews
    U.S. Geological Survey
    Geographer
    384 Woods Hole Rd
    Woods Hole, MA
    USA

    508-548-8700 x2348 (voice)
    508-457-2310 (FAX)
    bandrews@usgs.gov
    Data sources used in this process:
    • 06012_South5m.hns, 07001_5m.hns, 07002_5m.hns, 08002_5m.hns
    Data sources produced in this process:
    • CCB_BathAll_5m.hns
    Date: Dec-2009 (process 5 of 12)
    Step 5: CARIS to ArcInfo Conversion: The final 5 meter resolution CARIS BASE surface was imported to IVS 3D Data Magician (DMagic ver 6.1) using the "import gridded data" function and converted to an interim IVS DTM and geo file. The DTM file was then exported to an ASCII Raster using the function "export gridded data" using the ArcInfo no data format of -9999. The ASCII raster file (ccb_all5m.asc) was then imported to ArcGIS (ver. 9.3) as a 32-bit floating point ArcRaster grid.(ccb_bath_5m). The projection information was defined as UTM Zone 19, WGS_84 for the final grid using ArcToolbox "Define Projection" tool (ver. 9.3). Person who carried out this activity:
    Brian Andrews
    U.S. Geological Survey
    Geographer
    384 Woods Hole Rd
    Woods Hole, MA
    USA

    508-548-8700 x2348 (voice)
    508-457-2310 (FAX)
    bandrews@usgs.gov
    Date: Dec-2009 (process 6 of 12)
    Step 6:Create separate CARIS BASE surfaces for each survey. Separate 5-m BASE surfaces for each of the four surveys were created in CARIS ver 6.1. These individual surfaces were created to reduce the size of point files used in the next processing step. Person who carried out this activity:
    Brian Andrews
    U.S. Geological Survey
    Geographer
    384 Woods Hole Rd
    Woods Hole, MA
    USA

    508-548-8700 x2348 (voice)
    508-457-2310 (FAX)
    bandrews@usgs.gov
    Date: 16-Sep-2009 (process 7 of 12)
    Step 7:Create continuous grid with no data gaps. Filled in small gaps between/along adjacent survey lines using several steps that are described below as one group. All geoprocessing described below used ArcToolbox (ver 9.3) within ArcGIS (ver. 9.3). 1) Convert 5-m ArcRaster grid of each of the four survey into four point feature classes using the "Raster to point" tool with the "value" option. 2) Create new blank TIN (CCB_TINAll) using "Create TIN" Tool. 3) Using the "Edit TIN" tool, each of the four point feature classes of depth were added to the new blank TIN using the parameters: Input TIN: CCB_TinAll Input Feature Class: BathPts06012, BathPts07001, BathPts08002, BathPts07002 height_field: grid_code tag_field: none SF_type: masspoints use_z: false 4) Create a polygon feature class to use as a soft clip boundary to the TIN. Added feature class to TIN using "Edit TIN" tool with parameters: Input TIN: CCB_TinAll Input Feature Class: CCBathMaskPgon height_field: none tag_field: none SF_type: softclip use_z: false 5) Convert TIN that covers all data gaps into a Raster using the "TINRaster" tool and parameters: Input TIN: CCB_TinAll Ouput Raster: CCB_BathT Output Data Type: Float Method: Natural_Neighbors Sampling Distance: Cellsize 5 Z Factor: 1 Person who carried out this activity:
    Brian Andrews
    U.S. Geological Survey
    Geographer
    384 Woods Hole Rd
    Woods Hole, MA
    USA

    508-548-8700 x2348 (voice)
    508-457-2310 (FAX)
    bandrews@usgs.gov
    Date: unknown (process 8 of 12)
    Step 8: Mosaic grid with gaps and grid without gaps into a new raster using the "mosaic to new raster" tool. The gaps in the first grid (ccb_bath_5m) were filled in using the second grid (ccb_batht) to produce, one depth grid with no gaps. Mosaic parameters: Input Rasters: ccb_batht, ccb_bath5m pixel type:32 bit float, Cellsize: 5, Number of bands:1, Mosaic Method:first Mosaic colormap mode:first Person who carried out this activity:
    Brian Andrews
    U.S. Geological Survey
    Geographer
    384 Woods Hole Rd
    Woods Hole, MA
    USA

    508-548-8700 x2348 (voice)
    508-457-2310 (FAX)
    bandrews@usgs.gov
    Date: 20-Nov-2015 (process 9 of 12)
    Edits to the metadata were made to fix any errors that MP v 2.9.30 flagged. This is necessary to enable the metadata to be successfully harvested for various data catalogs. In some cases, this meant adding text "Information unavailable" or "Information unavailable from original metadata" for those required fields that were left blank. Other minor edits were probably performed (title, publisher, publication place, etc.). The format of the time period of content and some process dates had to be fixed. This file had a source contribution, but no other source information. This information had to be modified to meet the standard. The distribution format was modified in an attempt to be more consistent with other metadata files of the same data format. The metadata date (but not the metadata creator) was edited to reflect the date of these changes. The metadata available from a harvester may supersede metadata bundled within a download file. Compare the metadata dates to determine which metadata file is most recent. Person who carried out this activity:
    U.S. Geological Survey
    Attn: VeeAnn A. Cross
    Marine Geologist
    384 Woods Hole Rd.
    Woods Hole, MA

    508-548-8700 x2251 (voice)
    508-457-2310 (FAX)
    vatnipp@usgs.gov
    Date: 20-Jul-2018 (process 10 of 12)
    USGS Thesaurus keywords added to the keyword section. Person who carried out this activity:
    U.S. Geological Survey
    Attn: VeeAnn A. Cross
    Marine Geologist
    384 Woods Hole Road
    Woods Hole, MA

    508-548-8700 x2251 (voice)
    508-457-2310 (FAX)
    vatnipp@usgs.gov
    Date: 18-Nov-2019 (process 11 of 12)
    Crossref DOI link was added as the first link in the metadata. Person who carried out this activity:
    U.S. Geological Survey
    Attn: VeeAnn A. Cross
    Marine Geologist
    384 Woods Hole Road
    Woods Hole, MA

    508-548-8700 x2251 (voice)
    508-457-2310 (FAX)
    vatnipp@usgs.gov
    Date: 08-Sep-2020 (process 12 of 12)
    Added keywords section with USGS persistent identifier as theme keyword. Person who carried out this activity:
    U.S. Geological Survey
    Attn: VeeAnn A. Cross
    Marine Geologist
    384 Woods Hole Road
    Woods Hole, MA

    508-548-8700 x2251 (voice)
    508-457-2310 (FAX)
    vatnipp@usgs.gov
  3. What similar or related data should the user be aware of?
    Barnhardt, Walter A., Andrews, Brian D., and Butman, Bradford, 2006, High-Resolution Mapping of the Inner Continental Shelf: Nahant to Gloucester, Massachusetts: Open-File Report 2005-1293, U.S. Geological Survey, Reston, VA.

    Online Links:

    Ackerman, Seth D., Butman, Bradford, Barnhardt, Walter A., Danforth, William W., and Crocker, James M., 2006, High-Resolution Geologic Mapping of the Inner Continental Shelf: Boston Harbor and Approaches, Massachusetts: Open-File Report 2006-1008, U.S. Geological Survey, Reston, VA.

    Online Links:

    Barnhardt, Walter A., Andrews, Brian D., Ackerman, Seth D., Baldwin, Wayne E., and Hein, Christopher J., 2009, High-Resolution Geological Mapping of the Inner Continental Shelf: Cape Ann to Salisbury Beach, Massachusetts: Open-File Report 2007-1373, U.S. Geological Survey, Reston, VA.

    Online Links:

    Barnhardt, Walter A., Ackerman, Seth D., Andrews, Brian D., and Baldwin, Wayne E., 2010, Geophysical and Sampling Data from the Inner Continental Shelf: Duxbury to Hull, Massachusetts: Open-File Report 2009-1072, U.S. Geological Survey, Reston, VA.

    Online Links:


How reliable are the data; what problems remain in the data set?

  1. How well have the observations been checked?
  2. How accurate are the geographic locations?
    Field activity 06012: The SWATHplus transducers were mounted on a rigid pole, approximately 2.6 m below the water line, along the starboard side of the R/V Megan T. Miller. Position data were provided by an Ashtech Z-Surveyor Extreme for real-time kinematic (RTK) navigation (an Ashtech BR2G Differential Global Positioning System (DGPS) was used as a backup navigation system) and recorded to the raw data files (SXR) via Swath Processor (version 2.07) acquisition software. During some portions of the survey, technical difficulties caused the GPS systems to malfunction and lose the "fixed" RTK signal. When this occurred, the navigation system defaulted to a "float" RTK, and then to a GPS (stand alone) signal, after which the navigation signal was lost completely. Surveying was halted until a reliable GPS signal was restored. A conservative estimate of positional accuracy is +/- 2 meters, but when the navigation system was providing the "fixed" RTK signal, positional accuracy is <1 m. Field activities 07001, 07002, and 08002: The SWATHplus transducers were mounted on a rigid pole from the bow of the R/V Rafael, approximately 0.5 m below the water line during surveys 07001 and 08001, and 2.6 m below the water line on the starboard side for survey 07002. Position data were recorded by Hypack software to Hypack raw files using an Ashtech Z-Surveyor Extreme for real-time kinematic (RTK) navigation, and an Ashtech BR2G for Differential Global Positioning System (DGPS) navigation. DGPS navigation from the primary F180 antenna was recorded to the raw sonar data files (SXR) via SWATHplus acquisition software. A conservative estimate of positional accuracy is +/- 2 meters.
  3. How accurate are the heights or depths?
    Based on SWATHplus interferometric sonar system specifications, vertical accuracy of the raw data may approximate 1% of water depth, which translates to 0.1 0.6 meters within the northern Cape Cod Bay survey area. RTK-GPS was used to establish water-level heights relative to Mean Lower Low Water (MLLW), providing decimeter-scale accuracies. Tide-correction was done in post-processing (see process steps). Refraction artifacts were minimized by acquiring a range of sound velocity profiles throughout the survey area to model the sound velocity structure of the water column. Changes in vessel draft due to fuel and water usage were not considered.
  4. Where are the gaps in the data? What is missing?
    This grid does not include all bathymetric data collected in the northern Cape Cod Bay survey area. Data collected along transit lines, east-west seismic tie lines and other lines of poor quality were excluded from this grid. The "Mosaic" attribute in the CCB_BathTracklines shapefile published in this report identifies the 524 lines that were included, and the 60 lines that were not included, in this grid.
  5. How consistent are the relationships among the observations, including topology?
    Portions of this grid were interpolated to fill gaps that occurred between adjacent bathymetric survey lines. The grid "ccb_bath_5m" published in this report displays the depth data with gaps before interpolation.

How can someone get a copy of the data set?

Are there legal restrictions on access or use of the data?
Access_Constraints None
Use_Constraints These data are not for navigational use. Public domain data from the U.S. Government are freely redistributable with proper metadata and source attribution. Please recognize the U.S. Geological Survey (USGS) as the source of this information.
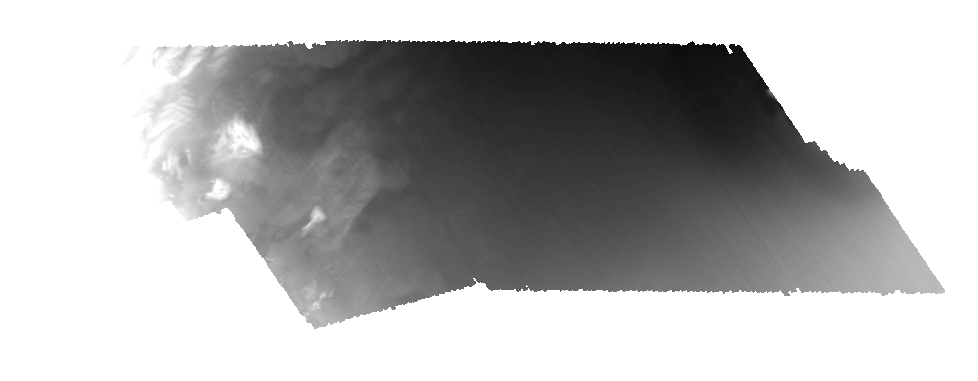
  1. Who distributes the data set? (Distributor 1 of 1)
    Brian Andrews
    U.S. Geological Survey
    Geographer
    384 Woods Hole Rd.
    Woods Hole, MA
    USA

    508-548-8700 x2348 (voice)
    bandrews@usgs.gov
  2. What's the catalog number I need to order this data set? Downloadable Data
  3. What legal disclaimers am I supposed to read?
    Neither the U.S. Government, the Department of the Interior, nor the USGS, nor any of their employees, contractors, or subcontractors, make any warranty, express or implied, nor assume any legal liability or responsibility for the accuracy, completeness, or usefulness of any information, apparatus, product, or process disclosed, nor represent that its use would not infringe on privately owned rights. The act of distribution shall not constitute any such warranty, and no responsibility is assumed by the USGS in the use of these data or related materials. Any use of trade, product, or firm names is for descriptive purposes only and does not imply endorsement by the U.S. Government.
  4. How can I download or order the data?
    • Availability in digital form:
      Data format: WinZip file containing the ArcRaster Grid of grid swath bathymetry collected in Cape Cod Bay, Massachusetts survey area. in format AIG (version ArcGIS 9.3) ESRI Raster GRID format Size: 60
      Network links: http://pubs.usgs.gov/of/2010/1006/GIS/raster/bathymetry/ccb_bath_f.zip
      Media you can order: DVD-ROM (Density 4.75 Gbytes) (format UDF)
    • Cost to order the data: None

  5. What hardware or software do I need in order to use the data set?
    These data are available as a ArcInfo 32-bit floating point binary grid in Environmental Systems Research Institute (ESRI) format. The grid consists of two folders, one with the "grid name", and one "info" folder. The two folders for each grid are compressed into one file using WinZip (ver. 9.0) software. To utilize these data, the user must have software capable of uncompressing the WinZip file and importing and viewing an ESRI ArcRaster grid. The two folders for each grid must be uncompressed to the same folder. If during the process of extracting multiple grids in WinZip format to the same folder, the user is prompted by WinZip software to "overwrite existing files" in the info folder select the "yes" option.

Who wrote the metadata?

Dates:
Last modified: 18-Mar-2024
Metadata author:
Brian Andrews
U.S. Geological Survey
Geographer
384 Woods Hole Rd.
Woods Hole, MA
USA

508-548-8700 x2348 (voice)
508-457-2310 (FAX)
whsc_data_contact@usgs.gov
Contact_Instructions:
The metadata contact email address is a generic address in the event the person is no longer with USGS. (updated on 20240318)
Metadata standard:
FGDC Content Standards for Digital Geospatial Metadata (FGDC-STD-001-1998)

This page is <https://cmgds.marine.usgs.gov/catalog/whcmsc/open_file_report/ofr2010-1006/ccb_bath_f.grd.faq.html>
Generated by mp version 2.9.51 on Mon Mar 25 16:05:29 2024