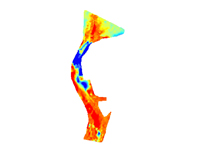
Thickness of Quaternary undifferentiated glaciofluvial, glaciolacustrine, fluvial, and lacustrine deposits within the St. Clair River between Michigan and Ontario, Canada, 2008 (ESRI GRID, QU)
In 2008, the U.S. Geological Survey (USGS), Woods Hole Coastal and Marine Science Center (WHCMSC), in cooperation with the U.S. Army Corps of Engineers conducted a geophysical and sampling survey of the riverbed of the Upper St. Clair River between Port Huron, MI, and Sarnia, Ontario, Canada. The objectives were to define the Quaternary geologic framework of the St. Clair River to evaluate the relationship between morphologic change of the riverbed and underlying stratigraphy. This report presents the geophysical and sample data collected from the St. Clair River, May 29-June 6, 2008 as part of the International Upper Great Lakes Study, a 5-year project funded by the International Joint Commission of the United States and Canada to examine whether physical changes in the St. Clair River are affecting water levels within the upper Great Lakes, to assess regulation plans for outflows from Lake Superior, and to examine the potential effect of climate change on the Great Lakes water levels (
http://www.iugls.org). This document makes available the data that were used in a separate report, U.S. Geological Survey Open-File Report 2009-1137, which detailed the interpretations of the Quaternary geologic framework of the region. This report includes a description of the suite of high-resolution acoustic and sediment-sampling systems that were used to map the morphology, surficial sediment distribution, and underlying geology of the Upper St. Clair River during USGS field activity 2008-016-FA . Video and photographs of the riverbed were also collected and are included in this data release. Future analyses will be focused on substrate erosion and its effects on river-channel morphology and geometry. Ultimately, the International Upper Great Lakes Study will attempt to determine where physical changes in the St. Clair River affect water flow and, subsequently, water levels in the Upper Great Lakes.