Online Links:
Online Links:
| Range of values | |
|---|---|
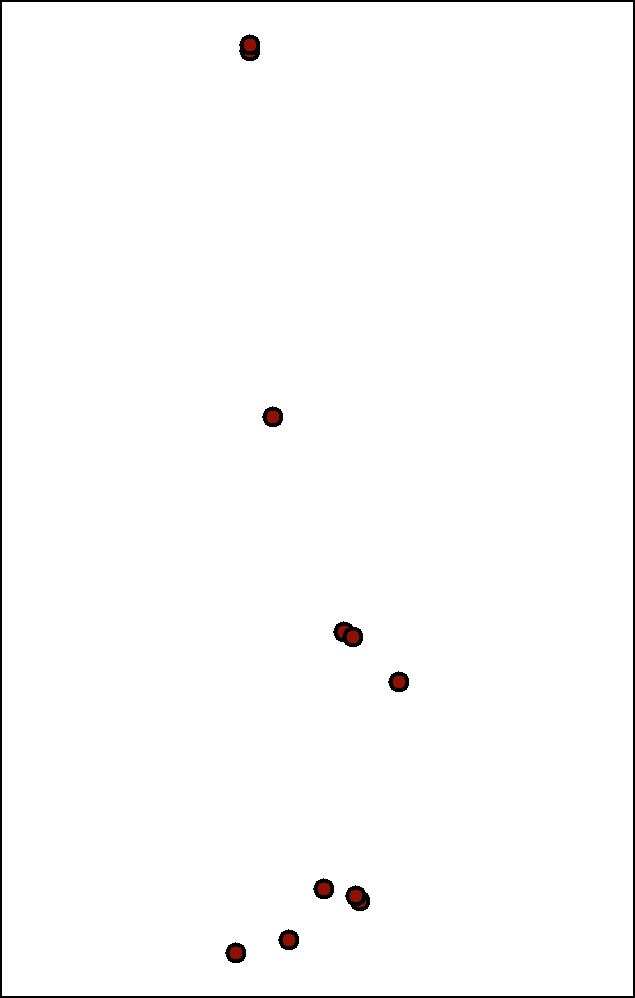
| Minimum: | 379775.1 |
| Maximum: | 382000 |
| Units: | meters |
| Resolution: | 1 |
| Range of values | |
|---|---|
| Minimum: | 4574011.5 |
| Maximum: | 4586325.6 |
| Units: | meters |
| Resolution: | 1 |
| Range of values | |
|---|---|
| Minimum: | 6.5 |
| Maximum: | 20 |
| Units: | meters |
| Resolution: | 0.1 |
| Range of values | |
|---|---|
| Minimum: | 214 |
| Maximum: | 341 |
| Units: | day |
| Resolution: | 1 |
| Range of values | |
|---|---|
| Minimum: | 1225 |
| Maximum: | 1959 |
| Units: | time |
Online Links:
Online Links:
| Access_Constraints | None |
|---|---|
| Use_Constraints | Public domain data from the U.S. Government are freely redistributable with proper metadata and source attribution. Please recognize the U.S. Geological Survey as the originator of the dataset. |
| Data format: | WinZip (v 14.5) file contains locations of sound velocity profiles collected by the U.S. Geological Survey - Woods Hole Coastal and Marine Science Center within the vicinity of Muskeget Channel MA and the associated metadata. Additional formats are also available in the zip file. in format Shapefile (version ArcGIS 9.3.1) Size: 1 |
|---|---|
| Network links: |
https://pubs.usgs.gov/of/2012/1258/GIS_catalog/svps/svp_data.zip https://pubs.usgs.gov/of/2012/1258/html/ofr2012-1258_GIS_catalog.html |
| Data format: | WinZip (v 14.5) file contains sound velocity profiles collected by the U.S. Geological Survey within the vicinity of Muskeget Channel, MA. It contains text files of each sound velocity cast. Additional formats are also available in the zip file. in format Text Size: 1 |
|---|---|
| Network links: |
https://pubs.usgs.gov/of/2012/1258/GIS_catalog/svps/svp_data.zip |
| Data format: | WinZip (v 14.5) file contains sound velocity profiles collected by the U.S. Geological Survey within the vicinity of Muskeget Channel, MA. It contains a PNG image of each profile plotted as depth versus velocity. Additional formats are also available in the zip file. in format PNG Size: 1 |
|---|---|
| Network links: |
https://pubs.usgs.gov/of/2012/1258/GIS_catalog/svps/svp_data.zip |