Online Links:
Online Links:
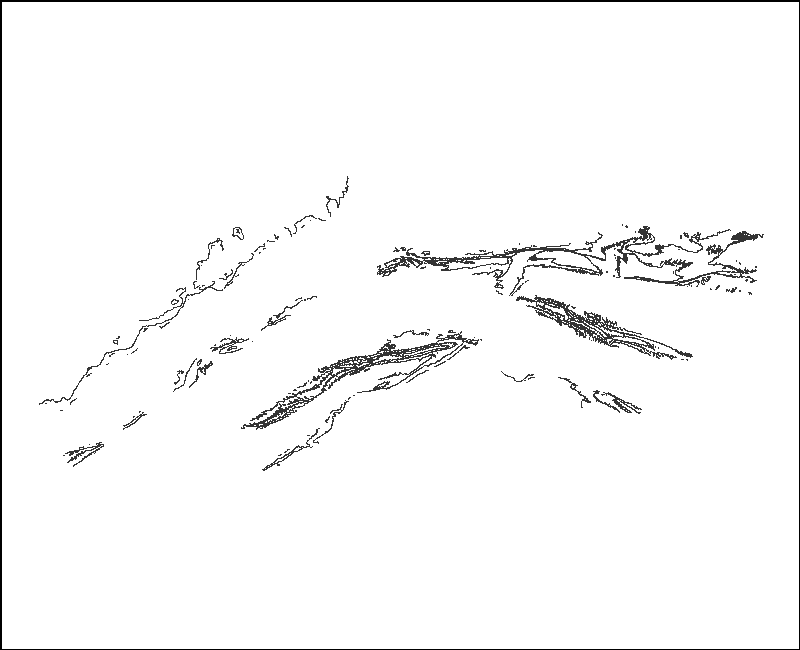
| Range of values | |
|---|---|
| Minimum: | -30 |
| Maximum: | -5 |
| Units: | meters |
| Resolution: | 5 |
| Range of values | |
|---|---|
| Minimum: | 50.26 |
| Maximum: | 30412.72 |
| Units: | meters |
| Resolution: | 0.1 |
Online Links:
Online Links:
Online Links:
Online Links:
Online Links:
Online Links:
| Access_Constraints | None |
|---|---|
| Use_Constraints | Not to be used for navigation. The Public domain data from the U.S. Government are freely redistributable with proper metadata and source attribution. Please recognize the U.S. Geological Survey as the originator of the dataset. |
| Data format: | This WinZip (v. 14.5) file contains a shapefile of bathymetric contours in the nearshore surrounding the Elizabeth Islands and sand shoals of Vineyard Sound, MA, and the associated metadata. in format Shapefile (version 9.3.1) Size: 1.5 |
|---|---|
| Network links: |
https://pubs.usgs.gov/of/2013/1020/GIS_catalog/bathy/contours_5m.zip https://pubs.usgs.gov/of/2013/1020/html/ofr2013-1020_GIS_catalog.html |