Online Links:
Online Links:
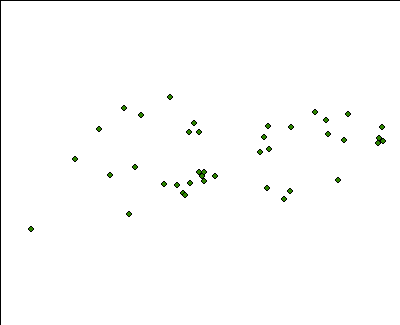
| Range of values | |
|---|---|
| Minimum: | 348594 |
| Maximum: | 379460 |
| Units: | meters |
| Resolution: | 1 |
| Range of values | |
|---|---|
| Minimum: | 4588928 |
| Maximum: | 4600465 |
| Units: | meters |
| Resolution: | 1 |
| Range of values | |
|---|---|
| Minimum: | 7 |
| Maximum: | 25 |
| Units: | meters |
| Resolution: | 0.1 |
| Range of values | |
|---|---|
| Minimum: | 214 |
| Maximum: | 341 |
| Units: | day |
| Resolution: | 1 |
| Range of values | |
|---|---|
| Minimum: | 2007 |
| Maximum: | 2011 |
| Units: | year |
| Resolution: | 1 |
Online Links:
Online Links:
Online Links:
Online Links:
| Access_Constraints | None |
|---|---|
| Use_Constraints | Public domain data from the U.S. Government are freely redistributable with proper metadata and source attribution. Please recognize the U.S. Geological Survey as the originator of the dataset. |
| Data format: | WinZip (v 14.5) file contains locations of sound velocity profiles collected by the U.S. Geological Survey - Woods Hole Coastal and Marine Science Center within Vineyard Sound and Buzzards Bay, MA and the associated metadata. in format Shapefile (version ArcGIS 9.3.1) Size: 1 |
|---|---|
| Network links: |
https://pubs.usgs.gov/of/2013/1020/GIS_catalog/svps/svp_locations.zip https://pubs.usgs.gov/of/2013/1020/html/ofr2013-1020_GIS_catalog.html |