Online Links:
Online Links:
| Range of values | |
|---|---|
| Minimum: | 4 |
| Maximum: | 41 |
| Units: | seconds |
| Range of values | |
|---|---|
| Minimum: | 252 |
| Maximum: | 257 |
| Range of values | |
|---|---|
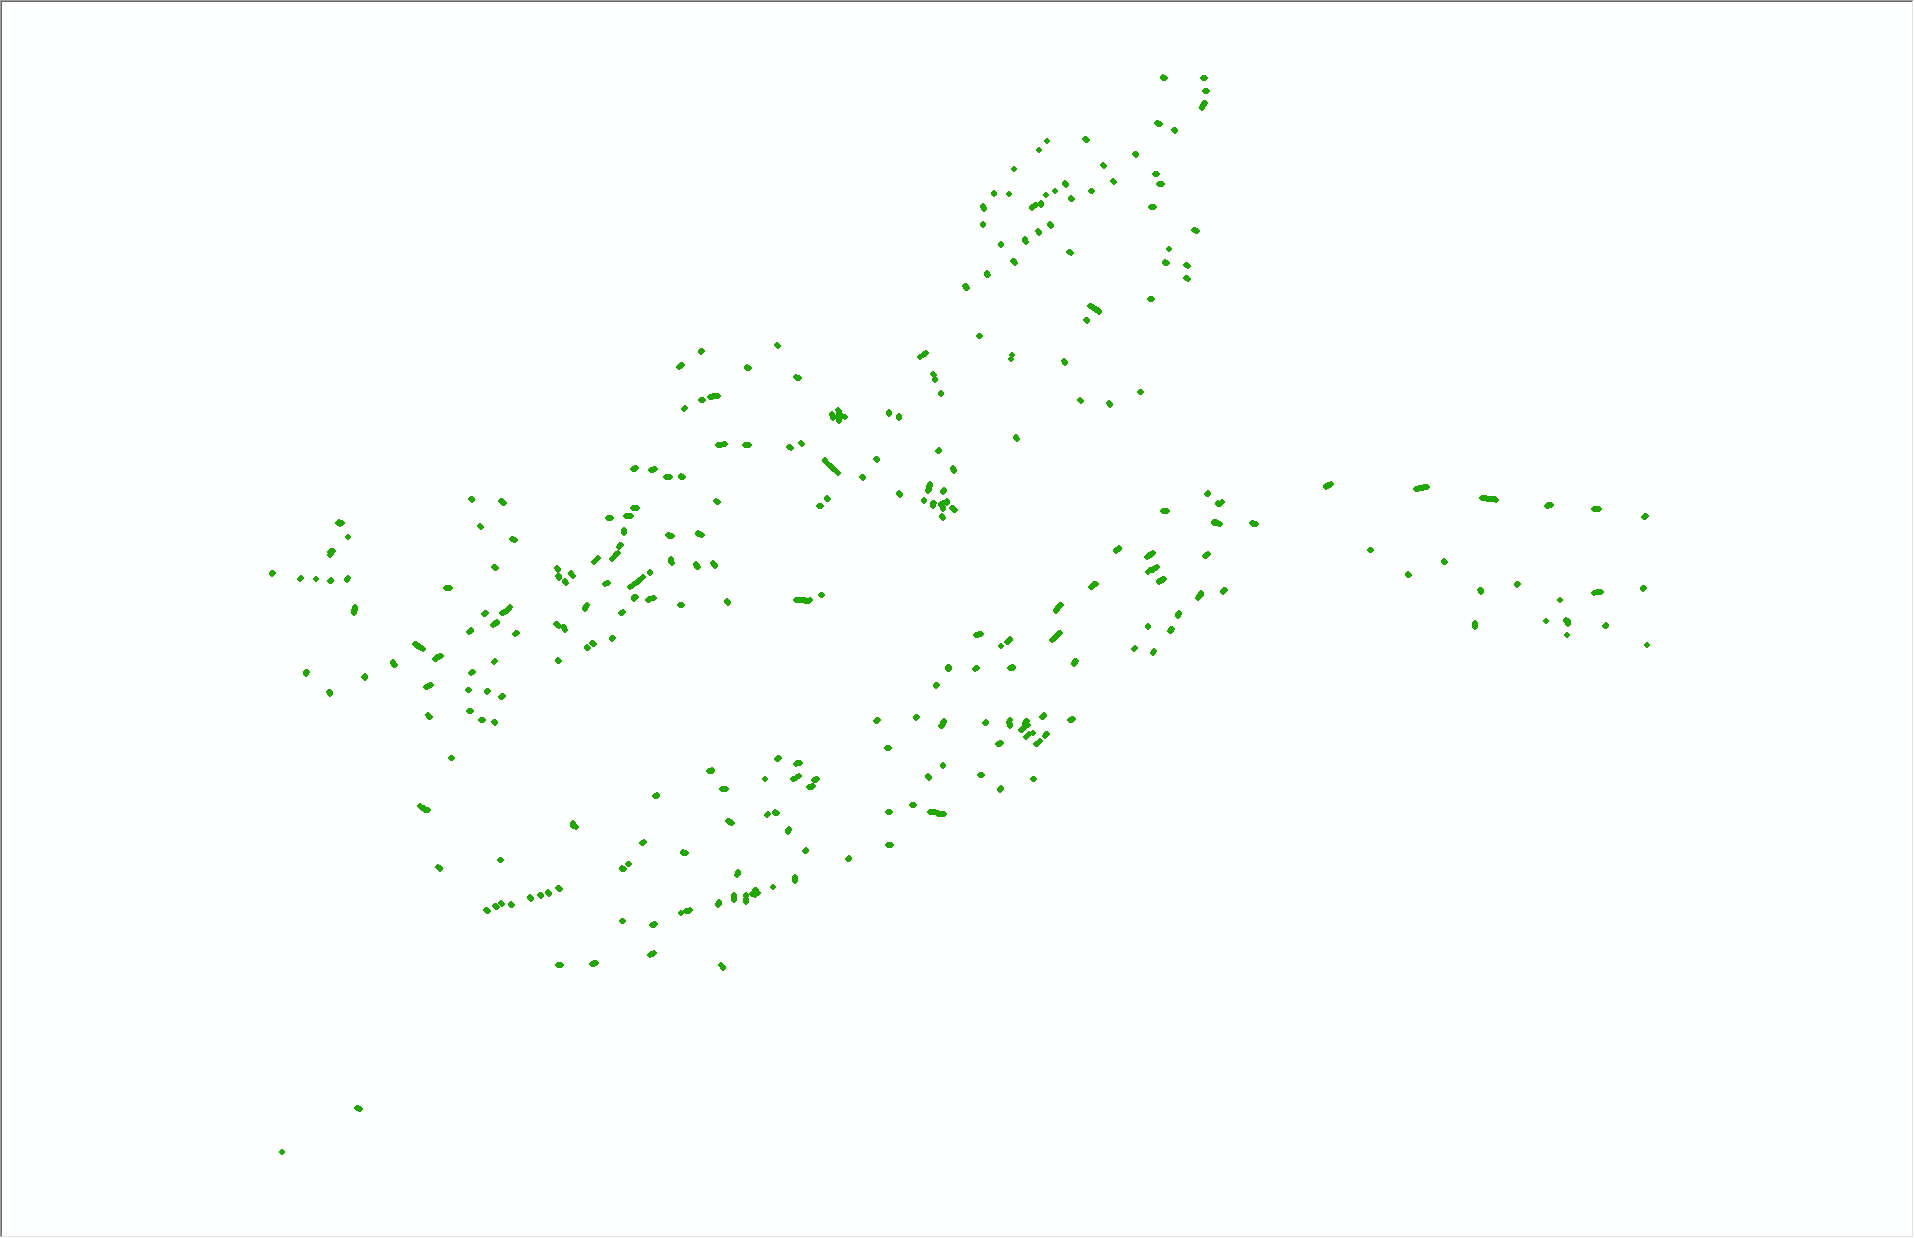
| Minimum: | 41.267625 |
| Maximum: | 41.649575 |
| Units: | Decimal degrees |
| Resolution: | 0.000001 |
| Range of values | |
|---|---|
| Minimum: | -71.096428 |
| Maximum: | -70.457338 |
| Units: | Decimal degrees |
| Resolution: | 0.000001 |
| Range of values | |
|---|---|
| Minimum: | 7.5 |
| Maximum: | 41.6 |
| Units: | meters |
| Resolution: | 0.1 |
| Range of values | |
|---|---|
| Minimum: | 0 |
| Maximum: | 578.2 |
| Units: | meters |
| Resolution: | 0.1 |
| Value | Definition |
|---|---|
| Benthic/Attached Biota | This biotic setting describes areas where biota lives on, in, or in close association with the seafloor or other substrates (e.g., pilings, buoys), extending down into the sediment to include the sub-surface layers of substrate that contain multi-cellular life. As a rule, Benthic/Attached Biota units are characterized by the various life histories and taxonomic characteristics of the dominant life forms. |
| -9999 | No data. Photo not analyzed. |
| Value | Definition |
|---|---|
| Aquatic Vegetation Bed | This class includes subtidal or intertidal bottoms and any other areas characterized by a dominant cover of rooted vascular plants, attached macroalgae, or mosses, which are usually submersed in the water column or floating on the surface. They may be exposed during low tides. |
| Faunal Bed | Seabeds dominated or characterized by a cover of animals that are closely associated with the bottom, including attached, clinging, sessile, infaunal, burrowing, laying, interstitial, and slow-moving animals, but not animals that have created substrate (Reef Biota). |
| Reef Biota | Areas dominated by reef-building fauna, including living corals, mollusks, polychaetes or glass sponges. In order to be classified as Reef Biota, colonizing organisms must be judged to be sufficiently abundant to construct identifiable biogenic substrates. The Reef Biota Class refers to only the living component of reef structures. |
| -9999 | No data. Photo not analyzed. |
| Value | Definition |
|---|---|
| Attached Fauna | Areas characterized by rock substrates, gravel substrates, other hard substrates, or mixed substrates that are dominated by fauna which maintain contact with the substrate surface, including firmly attached, crawling, resting, interstitial, or clinging fauna. |
| Benthic Macroalgae | Aquatic beds dominated by macroalgae attached to the substrate, such as kelp, intertidal fucoids, and calcareous algae. |
| Inferred Fauna | Areas dominated by evidence (real or inferred) of faunal activity, but where the fauna themselves are not currently present or evident, given the sampling methodology. |
| Mollusk Reef Biota | Areas dominated by consolidated aggregations of living and dead mollusks, usually bivalves (e.g., oysters or mussels or giant clams) or gastropods (e.g., vermetids) attached to their conspecifics and sufficiently abundant to create substrate. |
| Soft Sediment Fauna | Areas that are characterized by fine unconsolidated substrates (sand, mud) and that are dominated in percent cover or in estimated biomass by infauna, sessile epifauna, mobile epifauna, mobile fauna that create semi-permanent burrows as homes, or by structures or evidence associated with these fauna. |
| -9999 | No data. Photo not analyzed. |
| Value | Definition |
|---|---|
| Attached Anemones | Hard substrate areas dominated by attached anemones (coelenterates which secure themselves to a hard substrate with a pedal disc). |
| Attached Bryozoans | Areas dominated by abundant or structurally complex, attached bryozoan communities that are may be habitat-forming. |
| Attached Hydroids | Areas dominated by mounds or mats of hydroids that are attached to a hard substrate. |
| Attached Sponges | Hard or mixed substrate areas that are dominated by sponges and their associated communities, e.g., where non-reef building sponge species grow attached to hard substrate or are nestled among hard substrate, or where reef-building sponges grow on hard substrates in densities that are not judged sufficient to constitute a reef. |
| Attached Tunicates | Areas dominated by attached members of the subphylum Tunicata, known as tunicates, ascidians, or sea squirts. |
| Barnacles | Areas dominated by barnacles and associated fauna. |
| Burrowing Fauna | Assemblages dominated by the presence—or evidence—of larger, deep-burrowing, soft-bodied, generally worm-like infauna and/or areas dominated by small, burrowing, often worm-like fauna with a body width usually < 2 millimeters; animals are typically found within 5 centimeters of the sediment-water interface. For the purposes of this classification the biotic groups Small Surface-Burrowing Fauna and Larger Deep-Burrowing Fauna were combined as the resolution of the photographs does not allow a higher level of distinction between the two. |
| Clam Bed | Areas where either: (a) living clams, siphons, or siphon holes are the dominant surface feature, or; (b) clams dominate the faunal biomass. |
| Coralline/Crustose Algal Bed | Areas dominated by coralline or crustose algae that incorporate calcium carbonate into their tissues and form crusts on the substrate in many marine environments. |
| Filamentous Algal Bed | Areas dominated by filamentous algae that have a growth form consisting of fine filaments or strands with no blades or stipes. |
| Gastropod Reef | Areas dominated by consolidated aggregations of living and dead gastropod mollusks, typically those of the Family Vermetidae or the Genus Crepidula. Shells in a "reef" must have consolidated or conglomerated into a reef structure with some relief and permanence; a reef is more that an accumulation of loose shells. |
| Inferred Fauna | Areas dominated by evidence (real or inferred) of faunal activity, but where the fauna themselves are not currently present or evident, given the sampling methodology. This Biotic Group was added as a modification in the CMECS classification where no faunal activity is apparent visually, but the absence of faunal cannot be assumed due to a lack of a physical sample. |
| Leathery/Leafy Algal Bed | Areas dominated by leathery/leafy algae have a variety of specialized tissues (including thalli) that resemble stems and leaf-like blades. |
| Mobile Crustaceans on Hard or Mixed Substrates | Areas where the epifaunal community is dominated by slow-moving crustaceans on hard or mixed substrates, often living on, between, or under rocks. This group is limited to the epifaunal crustacean taxa that are relatively non-motile (e.g., hermit crabs, xanthid crabs, grapsid crabs, mysids, palaemonids and other small shrimps, amphipods, isopods) and cannot move outside the boundaries of the classification unit within one day. The classifcation unit is the field of view of the photograph. |
| Mobile Crustaceans on Soft Sediments | Areas where the epifaunal or surface community is dominated by slow-moving crustaceans. This group is limited to the relatively non-motile, epifaunal, crustacean taxa (e.g., hermit crabs, mole crabs, amphipods, mysids, isopods) and does not include the more mobile arthropod forms (e.g., swimming crabs, horseshoe crabs, penaied shrimps) which can leave the classified area in less than one day and are defined as Associated Taxa. The classifcation area is the field of view of the photograph. |
| Mobile Mollusks on Hard or Mixed Substrates | Areas dominated by slow-moving mollusks, most commonly gastropods. |
| Mobile Mollusks on Soft Sediments | Areas dominated by epifaunal, slow-moving, generally detritivorous, herbivorous, or omnivorous gastropods, scaphopods, or other mollusks foraging at the surface of unconsolidated sediments. |
| Sand Dollar Bed | Assemblages dominated by surface-dwelling, "irregular" echinoids of the Phylum Echinodermata and Order Clypeasteroida (e.g., sand dollars, sea biscuits). |
| Sessile Gastropods | Hard substrate areas dominated by sessile (or mostly sessile) gastropods, often suspension feeders. |
| Soft Sediment Bryozoans | Areas dominated by bryozoans. Bryozoans may be either embedded in fine substrates or resting, unattached, on the sediment surface. |
| Sponge Bed | Sandy or muddy areas of the seafloor that are dominated by sponges and their associated communities, but do not create substrate such that they would be considered Reef Biota. |
| Tracks and Trails | Areas where sediment surface patterns are dominated by tracks and trails left by locomotion of mobile epifauna and other fauna that are no longer present. |
| Tube-Building Fauna | Soft sediment areas dominated by larger tube builders (tube width > 2 millimeters, or tube length > 30 millimeters), most commonly polychaetes, but including many other worm-like phyla (phoronids, sipunculids), crustaceans, and others and/or soft sediment areas dominated by tube-building annelids (e.g., spionids, sabellids), amphipods, small phoronids, or other small, surface-dwelling, tube-building fauna. For the purposes of this classification the biotic groups Small Tube-Building Fauna and Larger Tube-Building Fauna were combined as the resolution of the photographs does not allow a higher level of distinction between the two. |
| Tunneling Megafauna | Intertidal or Subtidal areas dominated by burrowing or construction activities of larger (megafaunal) organisms that create a water-filled tunnel with a diameter of > 1 centimeter. |
| -9999 | No data. Photo not analyzed. |
| Value | Definition |
|---|---|
| Codium sp. | Photographs with the green algae Codium sp. present. Community added to characterize the Leathery/Leafy Algal Bed Biotic Group. |
| Crepidula sp. | Photographs with the slipper shell gastropod Crepidula sp. present. Community added to characterize the Gastropod Reef and Sessile Gastropods Biotic Groups. |
| Crepidula sp., Codium sp. | Photographs with the slipper shell gastropod Crepidula sp. and the green algae Codium sp. present. Community added to characterize the Leathery/Leafy Algal Bed, Gastropod Reef, and Sessile Gastropods Biotic Groups. |
| Didemnum sp. | Photographs with the colonial tunicate Didemnum sp. present. Community added to characterize the Attached Tunicates and Tunicate Bed Biotic Groups. |
| -9999 | No data. Photo not analyzed. |
| [blank] | Photo was only analyzed to the biotic group level. No Biotic Community could be determined or resolved in the photograph. |
| Value | Definition |
|---|---|
| Attached Anemones | Hard substrate areas dominated by attached anemones (coelenterates which secure themselves to a hard substrate with a pedal disc). |
| Attached Bryozoans | Areas dominated by abundant or structurally complex, attached bryozoan communities that are may be habitat-forming. |
| Attached Sponges | Hard or mixed substrate areas that are dominated by sponges and their associated communities, e.g., where non-reef building sponge species grow attached to hard substrate or are nestled among hard substrate, or where reef-building sponges grow on hard substrates in densities that are not judged sufficient to constitute a reef. |
| Attached Tube-Building Fauna | Hard substrate areas with a percent cover dominated by tube builders, including annelids, phoronids, sipunculids, crustaceans, gastropods, pogonophorans, echiurans, priapulids, and other phyla. |
| Attached Tunicates | Areas dominated by attached members of the subphylum Tunicata, known as tunicates, ascidians, or sea squirts. |
| Barnacles | Areas dominated by barnacles and associated fauna. |
| Burrowing Anemones | Areas dominated by anemones (solitary coelenterates) that use their pedal disc to burrow in soft substrates. |
| Burrowing Fauna | Assemblages dominated by the presence—or evidence—of larger, deep-burrowing, soft-bodied, generally worm-like infauna and/or areas dominated by small, burrowing, often worm-like fauna with a body width usually < 2 millimeters; animals are typically found within 5 centimeters of the sediment-water interface. For the purposes of this classification the biotic groups Small Surface-Burrowing Fauna and Larger Deep-Burrowing Fauna were combined as the resolution of the photographs does not allow a higher level of distinction between the two. |
| Clam Bed | Areas where either: (a) living clams, siphons, or siphon holes are the dominant surface feature, or; (b) clams dominate the faunal biomass. |
| Coralline/Crustose Algal Bed | Areas dominated by coralline or crustose algae that incorporate calcium carbonate into their tissues and form crusts on the substrate in many marine environments. |
| Filamentous Algal Bed | Areas dominated by filamentous algae that have a growth form consisting of fine filaments or strands with no blades or stipes. |
| Holothurian Bed | Soft sediment assemblages dominated by holothurians or "sea cucumbers." |
| Leathery/Leafy Algal Bed | Areas dominated by leathery/leafy algae have a variety of specialized tissues (including thalli) that resemble stems and leaf-like blades. |
| Mobile Crustaceans on Soft Sediments | Areas where the epifaunal or surface community is dominated by slow-moving crustaceans. This group is limited to the relatively non-motile, epifaunal, crustacean taxa (e.g., hermit crabs, mole crabs, amphipods, mysids, isopods) and does not include the more mobile arthropod forms (e.g., swimming crabs, horseshoe crabs, penaied shrimps) which can leave the classified area in less than one day and are defined as Associated Taxa. |
| Mobile Mollusks on Hard or Mixed Substrates | Areas dominated by slow-moving mollusks, most commonly gastropods. |
| Mobile Mollusks on Soft Sediments | Areas dominated by epifaunal, slow-moving, generally detritivorous, herbivorous, or omnivorous gastropods, scaphopods, or other mollusks foraging at the surface of unconsolidated sediments. |
| Sessile Gastropods | Hard substrate areas dominated by sessile (or mostly sessile) gastropods, often suspension feeders. |
| Sponge Bed | Sandy or muddy areas of the seafloor that are dominated by sponges and their associated communities, but do not create substrate such that they would be considered Reef Biota. |
| Tracks and Trails | Areas where sediment surface patterns are dominated by tracks and trails left by locomotion of mobile epifauna and other fauna that are no longer present. |
| Tube-Building Fauna | Soft sediment areas dominated by larger tube builders (tube width > 2 millimeters, or tube length > 30 millimeters), most commonly polychaetes, but including many other worm-like phyla (phoronids, sipunculids), crustaceans, and others and/or soft sediment areas dominated by tube-building annelids (e.g., spionids, sabellids), amphipods, small phoronids, or other small, surface-dwelling, tube-building fauna. For the purposes of this classification the biotic groups Small Tube-Building Fauna and Larger Tube-Building Fauna were combined as the resolution of the photographs does not allow a higher level of distinction between the two. |
| Tunicate Bed | Sandy or muddy areas dominated by members of the subphylum Urochordata, including ascidians, sea squirts, and other tunicates. |
| Tunneling Megafauna | Intertidal or Subtidal areas dominated by burrowing or construction activities of larger (megafaunal) organisms that create a water-filled tunnel with a diameter of > 1 centimeter. |
| -9999 | No data. Photo not analyzed. |
| [blank] | No other Co-occurring Element Modifier could be classified or resolved in the photograph. |
| Value | Definition |
|---|---|
| Attached Bryozoans | Areas dominated by abundant or structurally complex, attached bryozoan communities that are may be habitat-forming. |
| Attached Sponges | Hard or mixed substrate areas that are dominated by sponges and their associated communities, e.g., where non-reef building sponge species grow attached to hard substrate or are nestled among hard substrate, or where reef-building sponges grow on hard substrates in densities that are not judged sufficient to constitute a reef. |
| Attached Tube-Building Fauna | Hard substrate areas with a percent cover dominated by tube builders, including annelids, phoronids, sipunculids, crustaceans, gastropods, pogonophorans, echiurans, priapulids, and other phyla. |
| Attached Tunicates | Areas dominated by attached members of the subphylum Tunicata, known as tunicates, ascidians, or sea squirts. |
| Barnacles | Areas dominated by barnacles and associated fauna. |
| Burrowing Anemones | Areas dominated by anemones (solitary coelenterates) that use their pedal disc to burrow in soft substrates. |
| Burrowing Fauna | Assemblages dominated by the presence—or evidence—of larger, deep-burrowing, soft-bodied, generally worm-like infauna and/or areas dominated by small, burrowing, often worm-like fauna with a body width usually < 2 millimeters; animals are typically found within 5 centimeters of the sediment-water interface. For the purposes of this classification the biotic groups Small Surface-Burrowing Fauna and Larger Deep-Burrowing Fauna were combined as the resolution of the photographs does not allow a higher level of distinction between the two. |
| Clam Bed | Areas where either: (a) living clams, siphons, or siphon holes are the dominant surface feature, or; (b) clams dominate the faunal biomass. |
| Coralline/Crustose Algal Bed | Areas dominated by coralline or crustose algae that incorporate calcium carbonate into their tissues and form crusts on the substrate in many marine environments. |
| Filamentous Algal Bed | Areas dominated by filamentous algae that have a growth form consisting of fine filaments or strands with no blades or stipes. |
| Holothurian Bed | Soft sediment assemblages dominated by holothurians or "sea cucumbers." |
| Leathery/Leafy Algal Bed | Areas dominated by leathery/leafy algae have a variety of specialized tissues (including thalli) that resemble stems and leaf-like blades. |
| Mobile Crustaceans on Soft Sediments | Areas where the epifaunal or surface community is dominated by slow-moving crustaceans. This group is limited to the relatively non-motile, epifaunal, crustacean taxa (e.g., hermit crabs, mole crabs, amphipods, mysids, isopods) and does not include the more mobile arthropod forms (e.g., swimming crabs, horseshoe crabs, penaied shrimps) which can leave the classified area in less than one day and are defined as Associated Taxa. |
| Mobile Mollusks on Hard or Mixed Substrates | Areas dominated by slow-moving mollusks, most commonly gastropods. |
| Mobile Mollusks on Soft Sediments | Areas dominated by epifaunal, slow-moving, generally detritivorous, herbivorous, or omnivorous gastropods, scaphopods, or other mollusks foraging at the surface of unconsolidated sediments. |
| Sessile Gastropods | Hard substrate areas dominated by sessile (or mostly sessile) gastropods, often suspension feeders. |
| Sponge Bed | Sandy or muddy areas of the seafloor that are dominated by sponges and their associated communities, but do not create substrate such that they would be considered Reef Biota. |
| Tracks and Trails | Areas where sediment surface patterns are dominated by tracks and trails left by locomotion of mobile epifauna and other fauna that are no longer present. |
| Tube-Building Fauna | Soft sediment areas dominated by larger tube builders (tube width > 2 millimeters, or tube length > 30 millimeters), most commonly polychaetes, but including many other worm-like phyla (phoronids, sipunculids), crustaceans, and others and/or soft sediment areas dominated by tube-building annelids (e.g., spionids, sabellids), amphipods, small phoronids, or other small, surface-dwelling, tube-building fauna. For the purposes of this classification the biotic groups Small Tube-Building Fauna and Larger Tube-Building Fauna were combined as the resolution of the photographs does not allow a higher level of distinction between the two. |
| Tunneling Megafauna | Intertidal or Subtidal areas dominated by burrowing or construction activities of larger (megafaunal) organisms that create a water-filled tunnel with a diameter of > 1 centimeter. |
| -9999 | No data. Photo not analyzed. |
| [blank] | No other Co-occurring Element Modifier could be classified or resolved in the photograph. |
| Value | Definition |
|---|---|
| Anomia sp. | Photographs with the jingle shell Anomia sp. present. |
| Arbacia punctulata | Photographs with the sea urchin Arbacia punctulata present. |
| Asterias sp. | Photographs with the sea star Asterias sp. present. |
| Astrangia sp. | Photographs with the hard coral Astrangia sp. present. |
| Bivalvia | Photographs with bivalve mollusks Bivalvia present. |
| Bugula sp. | Photographs with the bryozoan Bugula sp. present. |
| Carcinus maenas | Photographs with the green crab Carcinus maenas present. |
| Centropristis striata | Photographs with the black sea bass Centropristis striata present. |
| Cerianthidae | Photographs with the burrowing anemone Cerianthidae present. |
| Crepidula sp. | Photographs with the slipper shell Crepidula sp. present. |
| Decapoda | Photographs with Decopoda crustaceans present. |
| Henricia sanguinolenta | Photographs with the blood star Henricia sanguinolenta present. |
| Homarus americanus | Photographs with the American lobster Homarus americanus present. |
| Menidia sp. | Photographs with the silverside Menidia sp. present. |
| Ovalipes ocellatus | Photographs with the lady crab Ovalipes ocellatus present. |
| Pagurus sp. | Photographs with the hermit crab Pagurus sp. present. |
| Pisces | Photographs with fish Pisces present. |
| Pisidae | Photographs with spider crab Pisidae present. |
| Pleuronectiformes | Photographs with flatfish Pleuronectiformes present. |
| Porifera | Photographs with sponge Porifera present. |
| Raja sp. | Photographs with skate Raja sp. present. |
| -9999 | No data. Photo not analyzed. |
| [blank] | No other Associated Taxa Modifier could be classified or resolved in the photograph. |
| Value | Definition |
|---|---|
| Anomia sp. | Photographs with the jingle shell Anomia sp. present. |
| Arbacia punctulata | Photographs with the sea urchin Arbacia punctulata present. |
| Asterias sp. | Photographs with the sea star Asterias sp. present. |
| Astrangia sp. | Photographs with the hard coral Astrangia sp. present. |
| Bivalvia | Photographs with bivalve mollusks Bivalvia present. |
| Bugula sp. | Photographs with the bryozoan Bugula sp. present. |
| Henricia sanguinolenta | Photographs with the blood star Henricia sanguinolenta present. |
| Holothuroidea | Photographs with sea cucumber Holothuroidea present. |
| Pagurus sp. | Photographs with the hermit crab Pagurus sp. present. |
| Pisces | Photographs with fish Pisces present. |
| Porifera | Photographs with sponge Porifera present. |
| -9999 | No data. Photo not analyzed. |
| [blank] | No other Associated Taxa Modifier could be classified or resolved in the photograph. |
Online Links:
Online Links:
Online Links:
Online Links:
Online Links:
Online Links:
Online Links:
| Access_Constraints | None |
|---|---|
| Use_Constraints | Public domain data from the U.S. Government are freely redistributable with proper metadata and source attribution. Please recognize the U.S. Geological Survey as the source of this information. |
| Data format: | A zip file containing the geospatial data in shapefile format and as a comma-delimited text file, and metadata describing the data set of seafloor photograph locations (including biogical classifications) collected with the SEABOSS. in format Shapefile (version ArcGIS 10.1) Zip file of Esri point shapefile Size: 0.3 |
|---|---|
| Network links: |
https://pubs.usgs.gov/of/2014/1221/GIS/shapefile/BBVS_BottomPhotos_wBio.zip |
| Media you can order: | DVD-ROM (Density 4.75 Gbytes) (format UDF) |
| Data format: | A comma-delimited text file containing navigation and grain-size analysis data. The first record contains field headings. in format ASCII (version CSV file) CSV file Size: 0.662 |
|---|---|
| Network links: |
https://pubs.usgs.gov/of/2014/1221/GIS/shapefile/BBVS_BottomPhotos_wBio.csv https://pubs.usgs.gov/of/2014/1221/html/appendix1.html |
| Media you can order: | DVD-ROM (Density 4.75 Gbytes) (format UDF) |