Title:
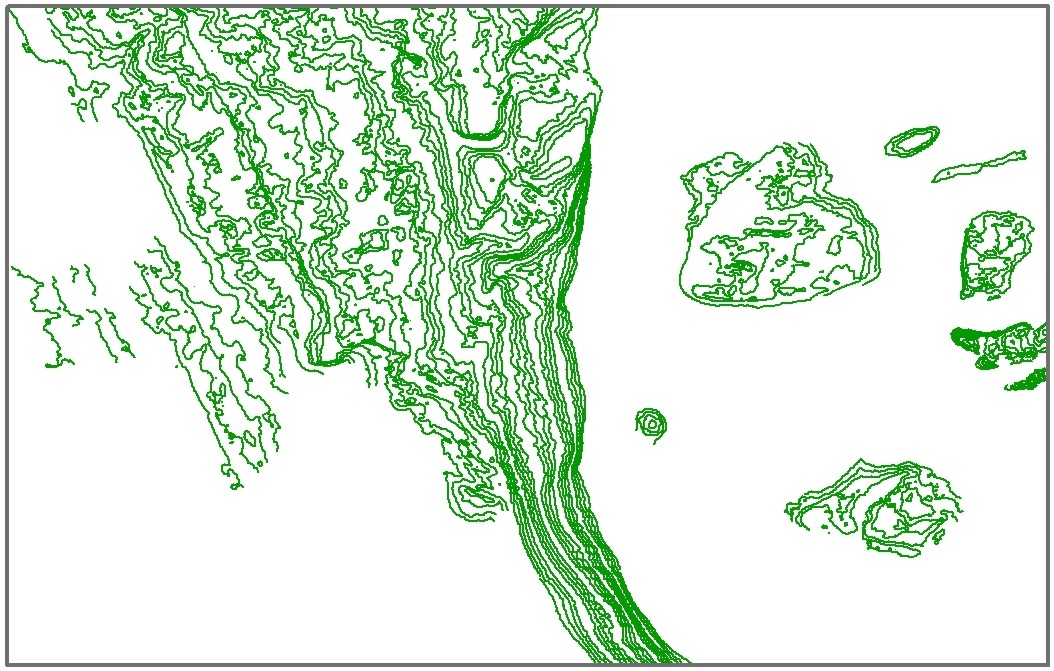
Polyline shapefile of a portion of the 1-meter (m) contours in quadrangle 6 of the Stellwagen Bank Survey Area offshore of Boston, Massachusetts necessary to show small features not displayed by 5-m contours - based on bathymetry data collected by the U.S. Geological Survey from 1994-1996 (Geographic, NAD 83)
Abstract:
The U.S. Geological Survey (USGS), in cooperation with the National Oceanic and Atmospheric Administration's National Marine Sanctuary Program, has conducted seabed mapping and related research in the Stellwagen Bank National Marine Sanctuary region since 1993. The area is approximately 3,700 square kilometers (km2) and is subdivided into 18 quadrangles. Seven maps, at a scale of 1:25,000, of quadrangle 6 (211 km2) depict seabed topography, backscatter, ruggedness, geology, substrate mobility, mud content, and areas dominated by fine-grained or coarse-grained sand. Interpretations of bathymetric and seabed backscatter imagery, photographs, video, and grain-size analyses were used to create the geology-based maps. In all, data from 420 stations were analyzed, including sediment samples from 325 locations. The seabed geology map shows the distribution of 10 substrate types ranging from boulder ridges to immobile, muddy sand to mobile, rippled sand. Substrate types are defined on the basis of sediment grain-size composition, surficial morphology, sediment layering, and the mobility or immobility of substrate surfaces. This map series is intended to portray the major geological elements (substrates, features, processes) of environments within quadrangle 6. Additionally, these maps will be the basis for the study of the ecological requirements of invertebrate and vertebrate species that utilize these substrates and guide seabed management in the region.