Future coastal hazards along the U.S. North and South Carolina coasts
By Patrick L. Barnard, Kevin M. Befus, Jeffrey J Danielson, Anita C. Engelstad, Li H. Erikson, Amy C. Foxgrover, Matthew W Hardy, Daniel J. Hoover, Tim Leijnse, Chris Massey, Robert McCall, Norberto Nadal-Caraballo, Kees M. Nederhoff, Leonard Ohenhen, Andrea O'Neill, Kai A. Parker, Manoocher Shirzaei, Xin Su, Jennifer A. Thomas, Maarten van Ormondt, Sean F. Vitousek, Kilian Vos, and Madison Yawn
https://doi.org/10.5066/P9W91314
Dates
Published: Jan. 28, 2023
Last Revised: Nov. 22, 2024 (ver. 2.0)
Summary
This product consists of several datasets that map future coastal flooding and erosion hazards due to sea level rise (SLR) and storms along the North and South Carolina coast. The SLR scenarios encompass a plausible range of projections by 2100 based on the best available, science and with enough resolution to support a suite of different planning horizons. The storm scenarios are derived with the use of atmospheric drivers from the Coupled Model Intercomparison Project Phase 6 (CMIP6) High Resolution Model Intercomparison Project (HighResMIP), a widely endorsed study that seeks to improve GCM hurricane modeling and applies a systematic approach to investigate the impact of horizontal resolution on simulating climate variables and hurricanes. Downscaled data products provided as part of this data release include: Projected Flood hazards (28 scenarios of 7 SLRs in combination with 3 storms and daily conditions), storm surge and astronomic tide time-series within the nearshore region for projected future storms (2020-2050), shoreline change time-series (2020-2100), depth to water table (7 SLR scenarios), and vertical land motion (14 years of historical observations).
Simulation Data
-
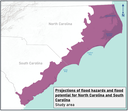
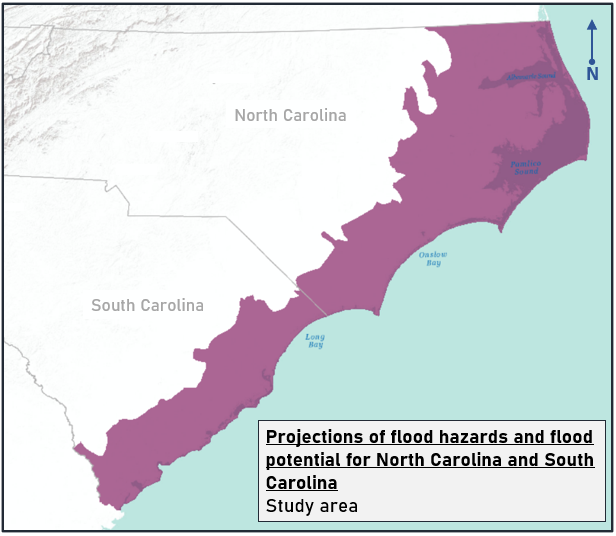
Projections of coastal flood hazards and flood potential for North Carolina and South Carolina
Projected impacts by compound coastal flood hazards for future sea-level rise (SLR) and storm scenarios are shown for North Carolina and South Carolina. Accompanying uncertainty for each SLR and storm scenario, indicating total uncertainty from model processes and contributing datasets, are illustrated in maximum and minimum flood potential. As described by Nederhoff and others (2024), projections were made using a system of numerical models driven by output from Global Climate Models (GCMs) from the Coupled Model Intercomparison Project Phase 6 (CMIP6) and a tropical cyclone database from US Army Corp of Engineers. The resulting data products include detailed flood-hazard maps along the North Carolina and South Carolina coast due to sea level rise and plausible future storm conditions that consider the changing climate, hurricanes, and natural variability. In addition to sea-level rise, flood simulations run by these numerical models included dynamic contributions from tide, storm surge, wind, waves, river discharge, precipitation, and seasonal sea-level fluctuations. Outputs include impacts from combinations of SLR scenarios (0, 0.25, 0.5, 1.0, 1.5, 2.0, and 3.0 m) storm conditions including 1-year, 20-year and 100-year return interval storms and a background condition (no storm - astronomic tide and average atmospheric conditions).
Data Files
FloodHaz_ModelOutput_Boundary_NC.zip - 189.9 KB - MD5:959405965d8dae79560f21f90cf11da1
FloodHaz_ModelOutput_Boundary_SC.zip - 121.9 KB - MD5:96fb3b26df001a8c9888658ece3012b9
Projections_FloodHazard_NC.zip - 1.1 GB - MD5:b736688e5c48e93e4ec958c08fe80aa0
Projections_FloodHazard_SC.zip - 594.8 MB - MD5:41835bb98cfa32942335572b2d691f24
Metadata Files
Projections_FloodHazards_metadata.xml - 62.9 KB
Projections_FloodHazards_metadata.txt - 60.0 KB
-
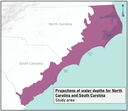
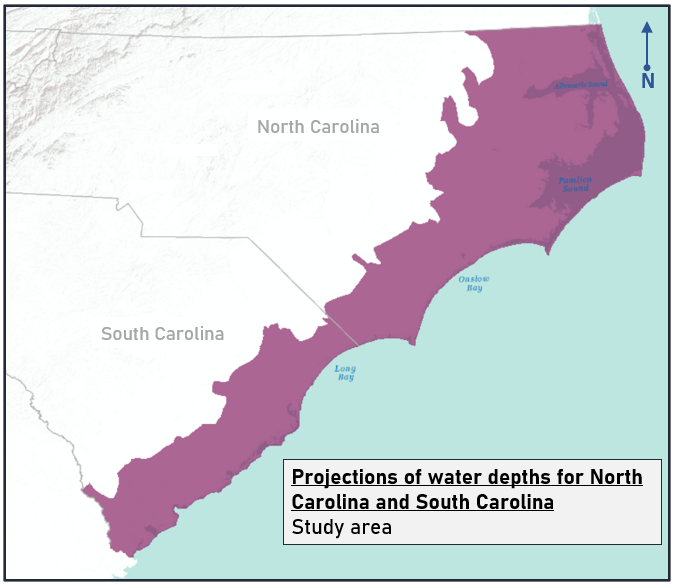
Projections of coastal water depths for North Carolina and South Carolina
Projected water depths from compound coastal flood hazards for future sea-level rise (SLR) and storm scenarios are shown for North Carolina and South Carolina. As described by Nederhoff and others (2024), projections were made using a system of numerical models driven by output from Global Climate Models (GCMs) from the Coupled Model Intercomparison Project Phase 6 (CMIP6) and a tropical cyclone database from U.S. Army Corp of Engineers. The resulting data are depths of projected flood hazards along the North Carolina and South Carolina coast due to sea level rise and plausible future storm conditions that consider the changing climate, hurricanes, and natural variability. The resulting data products include water depths that are consistent with coastal flood projections, also available in this dataset (Barnard, and others, 2023). In addition to sea-level rise, flood simulations run by these numerical models included dynamic contributions from tide, storm surge, wind, waves, river discharge, precipitation, and seasonal sea-level fluctuations. Outputs include impacts from combinations of SLR scenarios (0, 0.25, 0.5, 1.0, 1.5, 2.0, and 3.0 m), storm conditions including 1-year, 20-year, and 100-year return interval storms, and a background condition (no storm - astronomic tide and average atmospheric conditions).
Data Files
Projections_WaterDepth_NC.zip - 7.4 GB - MD5:34527dd7584479e0113aada5ea0011bc
Projections_WaterDepth_SC.zip - 3.3 GB - MD5:c565d3bc436d900464bddce940d506c7
Metadata Files
Projections_WaterDepths_metadata.xml - 62.6 KB
Projections_WaterDepths_metadata.txt - 59.8 KB
-
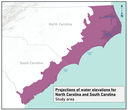
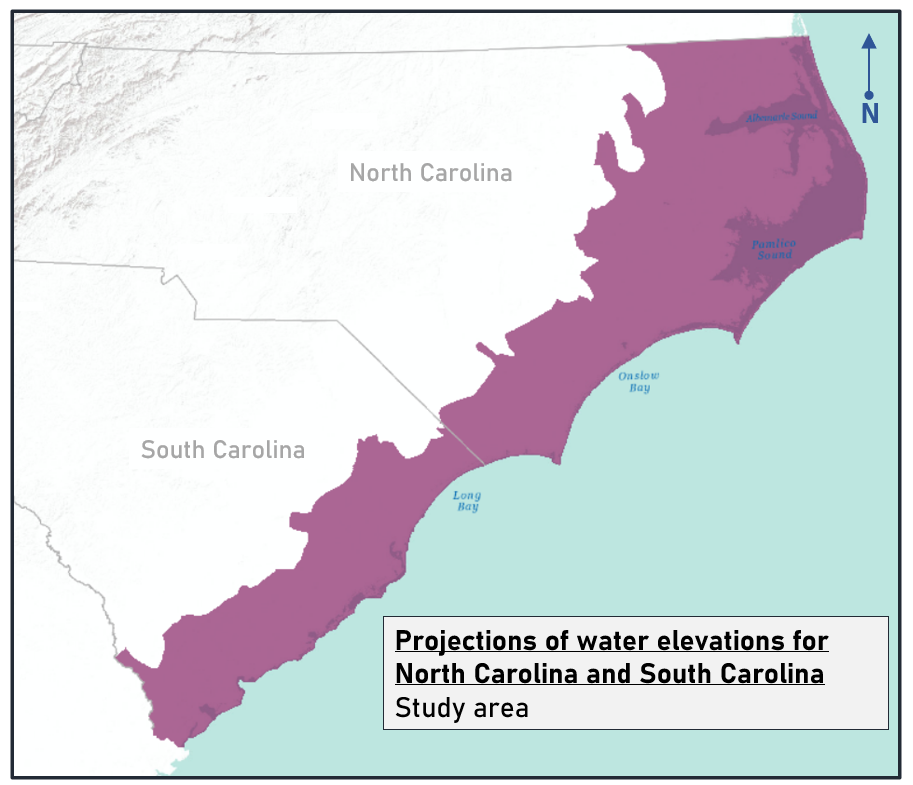
Projections of coastal water elevations for North Carolina and South Carolina
Projected water elevations from compound coastal flood hazards for future sea-level rise (SLR) and storm scenarios are shown for North Carolina and South Carolina. As described by Nederhoff and others (2024), projections were made using a system of numerical models driven by output from Global Climate Models (GCMs) from the Coupled Model Intercomparison Project Phase 6 (CMIP6) and a tropical cyclone database from U.S. Army Corps of Engineers. The resulting data are elevations of projected flood hazards along the North Carolina and South Carolina coast due to sea level rise and plausible future storm conditions that consider the changing climate, hurricanes, and natural variability. The resulting data products include water elevations that are consistent with coastal flood projections, also available in this dataset (Barnard, and others, 2023). In addition to sea-level rise, flood simulations run by these numerical models included dynamic contributions from tide, storm surge, wind, waves, river discharge, precipitation, and seasonal sea-level fluctuations. Outputs include impacts from combinations of SLR scenarios (0, 0.25, 0.5, 1.0, 1.5, 2.0, and 3.0 m), storm conditions including 1-year, 20-year, and 100-year return interval storms, and a background condition (no storm - astronomic tide and average atmospheric conditions).
Data Files
Projections_WaterElevation_NC.zip - 2.1 GB - MD5:90c4d9731665a370c0d8cac61a8062f1
Projections_WaterElevation_SC.zip - 1007.2 MB - MD5:9cd33c92bbd40f9711c4a96aeb045c40
Metadata Files
Projections_WaterElevation_metadata.xml - 60.7 KB
Projections_WaterElevation_metadata.txt - 57.9 KB
-
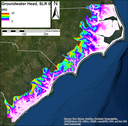
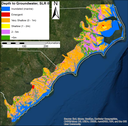
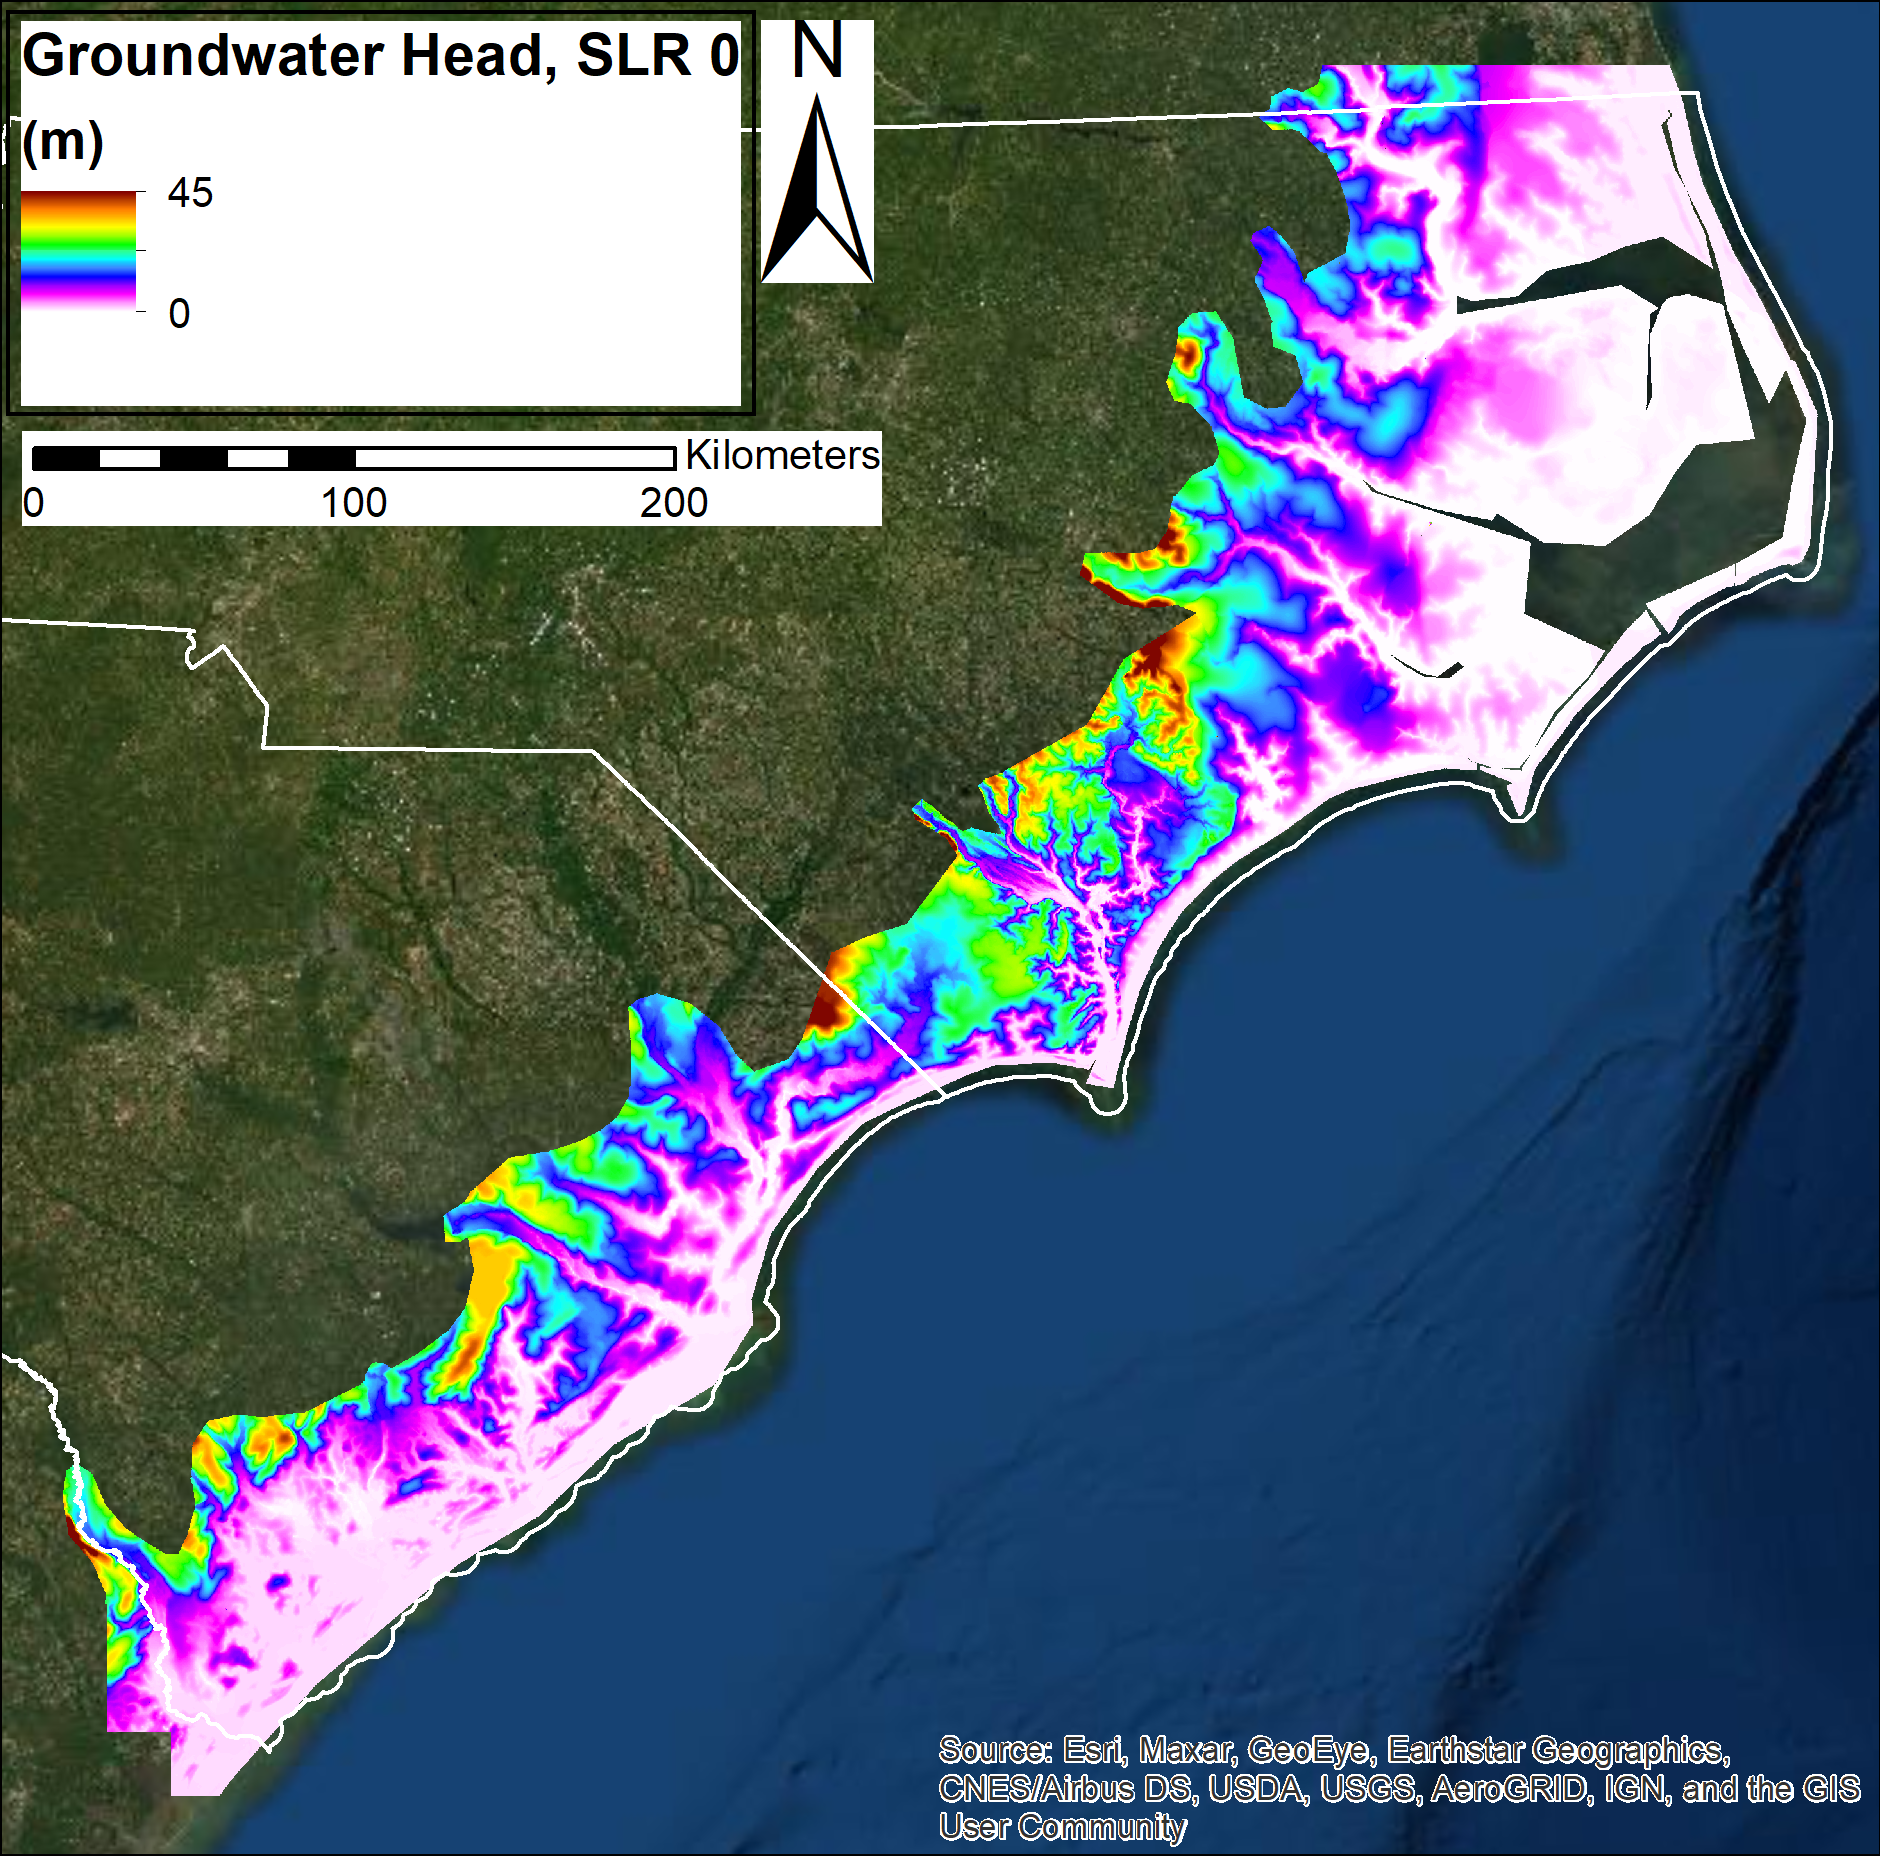
Projected groundwater head along the North and South Carolina coasts
Seamless unconfined groundwater heads for U.S. coastal North and South Carolina groundwater systems were modeled with homogeneous, steady-state MODFLOW simulations. The geographic extent examined was limited primarily to low-elevation (land surface less than approximately 10 m above mean sea level) areas. Steady-state MODFLOW groundwater flow models were used to obtain detailed (50-meter-scale) predictions over large geographic scales (100s of kilometers) of groundwater heads for both current and future sea-level rise (SLR) scenarios (0, 0.25, 0.5, 1, 1.5, 2, 2.5, and 3 m) using 3 spatially varying hydraulic conductivities (K); one based on published K’s, one with published K’s reduced by a factor of 10 (K*0.1), and one with published K’s increased by a factor of 10 (K*10) to assess the sensitivity of model results to K. All models had variable thicknesses corresponding to published transmissivities. The models were run with a local mean higher-high water (MHHW) marine boundary condition and with groundwater reaching the land surface removed from the model, simulating loss via natural drainage.
Data Files
GWHazards_GWHead_NC_Kx0p1.zip - 1007.2 MB - MD5:187ab02c8a70e11094a51add295dd736
GWHazards_GWHead_NC_Kx10.zip - 998.6 MB - MD5:60d2a2e1cdedd26952e989ba94917727
GWHazards_GWHead_NC_Kx1.zip - 1005.1 MB - MD5:e5f9db520185fc9f3c42c9f1626cb23e
GWHazards_GWHead_SC_Kx0p1.zip - 584.9 MB - MD5:e593e752dea44969f03b23abdded1275
GWHazards_GWHead_SC_Kx10.zip - 580.6 MB - MD5:57fafc2175c81cf8578aa804ca224b56
GWHazards_GWHead_SC_Kx1.zip - 583.5 MB - MD5:ebe2261008333f9ec4a3cb2bdcc51a7e
Metadata Files
GWHazards_GWHead_metadata.xml - 25.1 KB
GWHazards_GWHead_metadata.txt - 24.1 KB
-
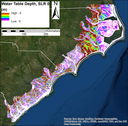
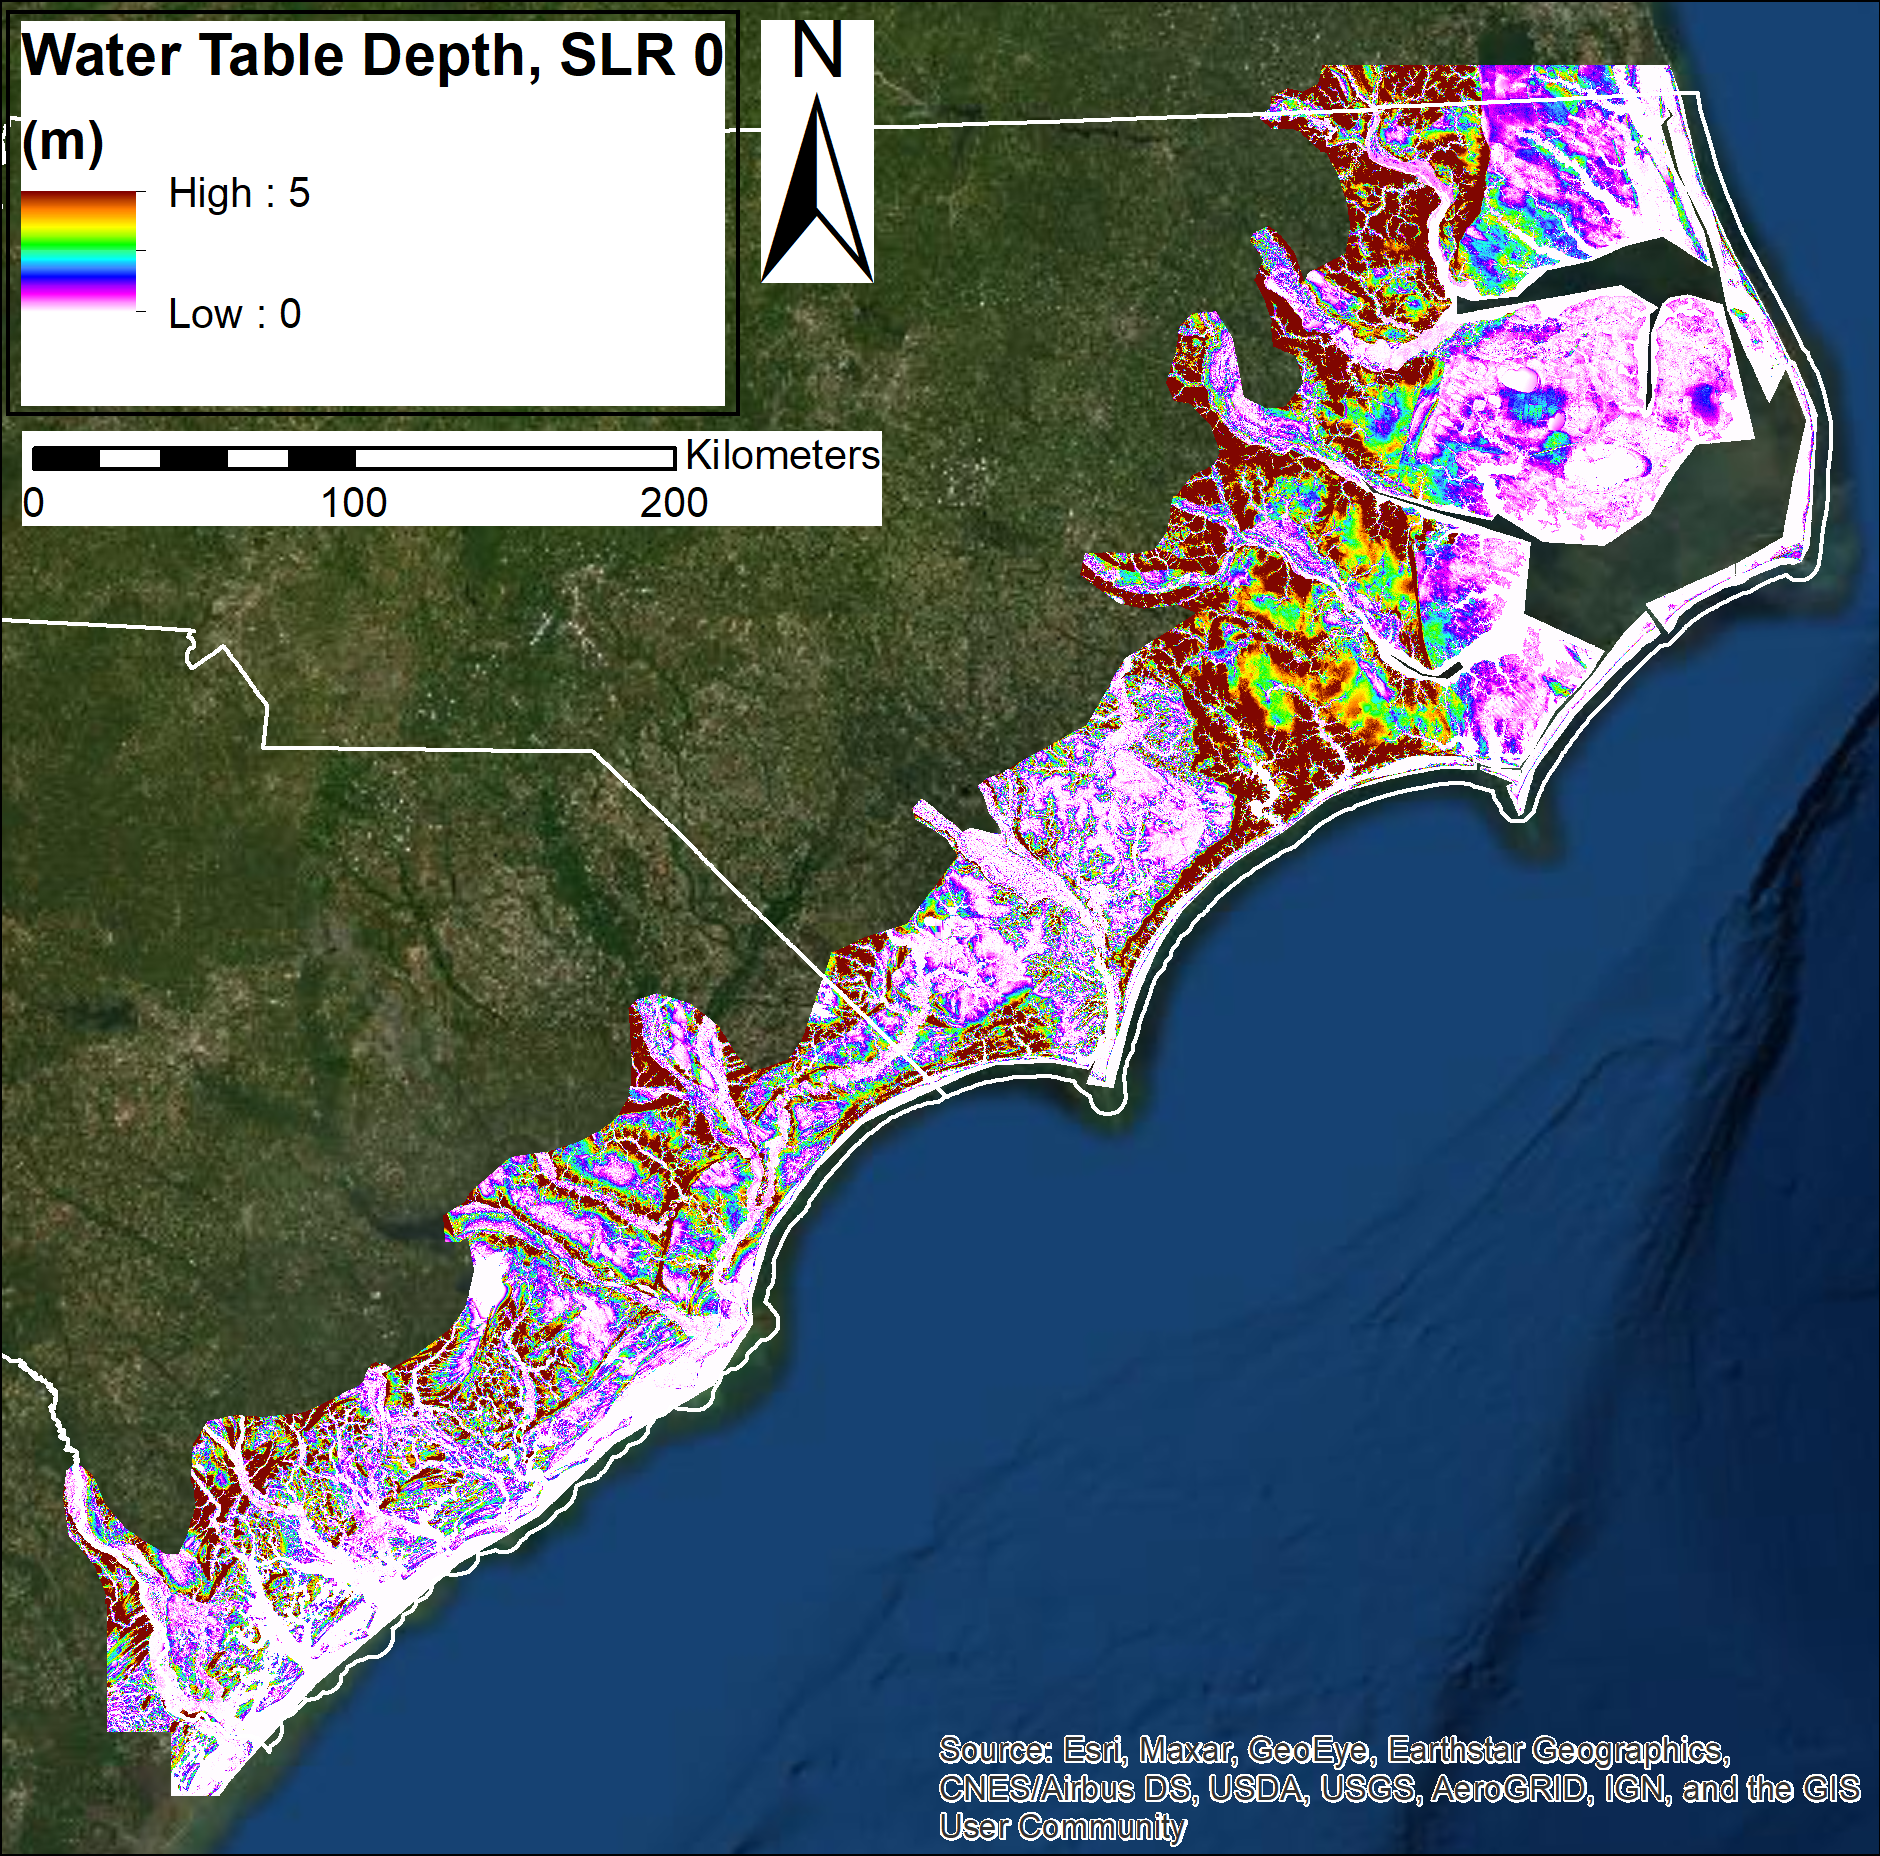
Projected water table depths along the North and South Carolina coasts
To predict water table depths, seamless groundwater heads for unconfined coastal North and South Carolina groundwater systems were modeled with homogeneous, steady-state MODFLOW simulations. The geographic extent examined was limited primarily to low-elevation (land surface less than approximately 10 m above mean sea level) areas. Steady-state MODFLOW groundwater flow models were used to obtain detailed (50-meter-scale) predictions over large geographic scales (100s of kilometers) of groundwater heads for both current and future sea-level rise (SLR) scenarios (0, 0.25, 0.5, 1, 1.5, 2, 2.5, and 3 m) using 3 spatially varying hydraulic conductivities (K); one based on published K’s, one with published K’s reduced by a factor of 10 (K*0.1), and one with published K’s increased by a factor of 10 (K*10) to assess the sensitivity of model results to K. All models had variable thicknesses corresponding to published transmissivities. The models were run with a local mean higher-high water (MHHW) marine boundary condition, and with groundwater reaching the land surface removed from the model, simulating loss via natural drainage. Modeled groundwater heads were then subtracted from high-resolution topographic digital elevation model (DEM) data to obtain the water table depths.
Data Files
GWHazards_WaterTableDepth_NC_SLR0p25.zip - 10.2 GB - MD5:3c07dfc1d743817b32a2b05058b9db27
GWHazards_WaterTableDepth_NC_SLR0p5.zip - 10.2 GB - MD5:f2ea44bf9906a404e3cf23d37517523d
GWHazards_WaterTableDepth_NC_SLR0.zip - 10.2 GB - MD5:93c7c7eb24927cc0f327430ae5237697
GWHazards_WaterTableDepth_NC_SLR1p0.zip - 10.2 GB - MD5:ac1da132dd729cb6ac30a985ccb54ad8
GWHazards_WaterTableDepth_NC_SLR1p5.zip - 10.1 GB - MD5:e3e8606cc8d3148679795fcb1f2eaf0b
GWHazards_WaterTableDepth_NC_SLR2p0.zip - 10.1 GB - MD5:80f6783e368d7b84a1458c479487f873
GWHazards_WaterTableDepth_NC_SLR2p5.zip - 10.1 GB - MD5:7f4e1c8c0e665236330b4beaaae2ed61
GWHazards_WaterTableDepth_NC_SLR3p0.zip - 10.1 GB - MD5:3920fe72a826684406fa79f647d18c25
GWHazards_WaterTableDepth_SC_SLR0p25.zip - 5.5 GB - MD5:4297c70a411a727aaf1fca6fe046eab7
GWHazards_WaterTableDepth_SC_SLR0p5.zip - 5.5 GB - MD5:5898c3a35d387d422f0e9abe41b87a71
GWHazards_WaterTableDepth_SC_SLR0.zip - 5.5 GB - MD5:f2579feae4cf4d60bbe1cc5d35f2c1f6
GWHazards_WaterTableDepth_SC_SLR1p0.zip - 5.5 GB - MD5:02499d4399eedf78cd8cc1415a802edb
GWHazards_WaterTableDepth_SC_SLR1p5.zip - 5.4 GB - MD5:f00f741b3b2848a38954976a6cd4f7d0
GWHazards_WaterTableDepth_SC_SLR2p0.zip - 5.4 GB - MD5:02a939ff15884727f497bdc600af4a81
GWHazards_WaterTableDepth_SC_SLR2p5.zip - 5.4 GB - MD5:09e520f6e67141805116c8a71ff78fa4
GWHazards_WaterTableDepth_SC_SLR3p0.zip - 5.4 GB - MD5:7ff13b4b28ea2cb3373ec0f336592841
Metadata Files
GWHazards_WaterTableDepth_metadata.xml - 35.5 KB
GWHazards_WaterTableDepth_metadata.txt - 34.0 KB
-
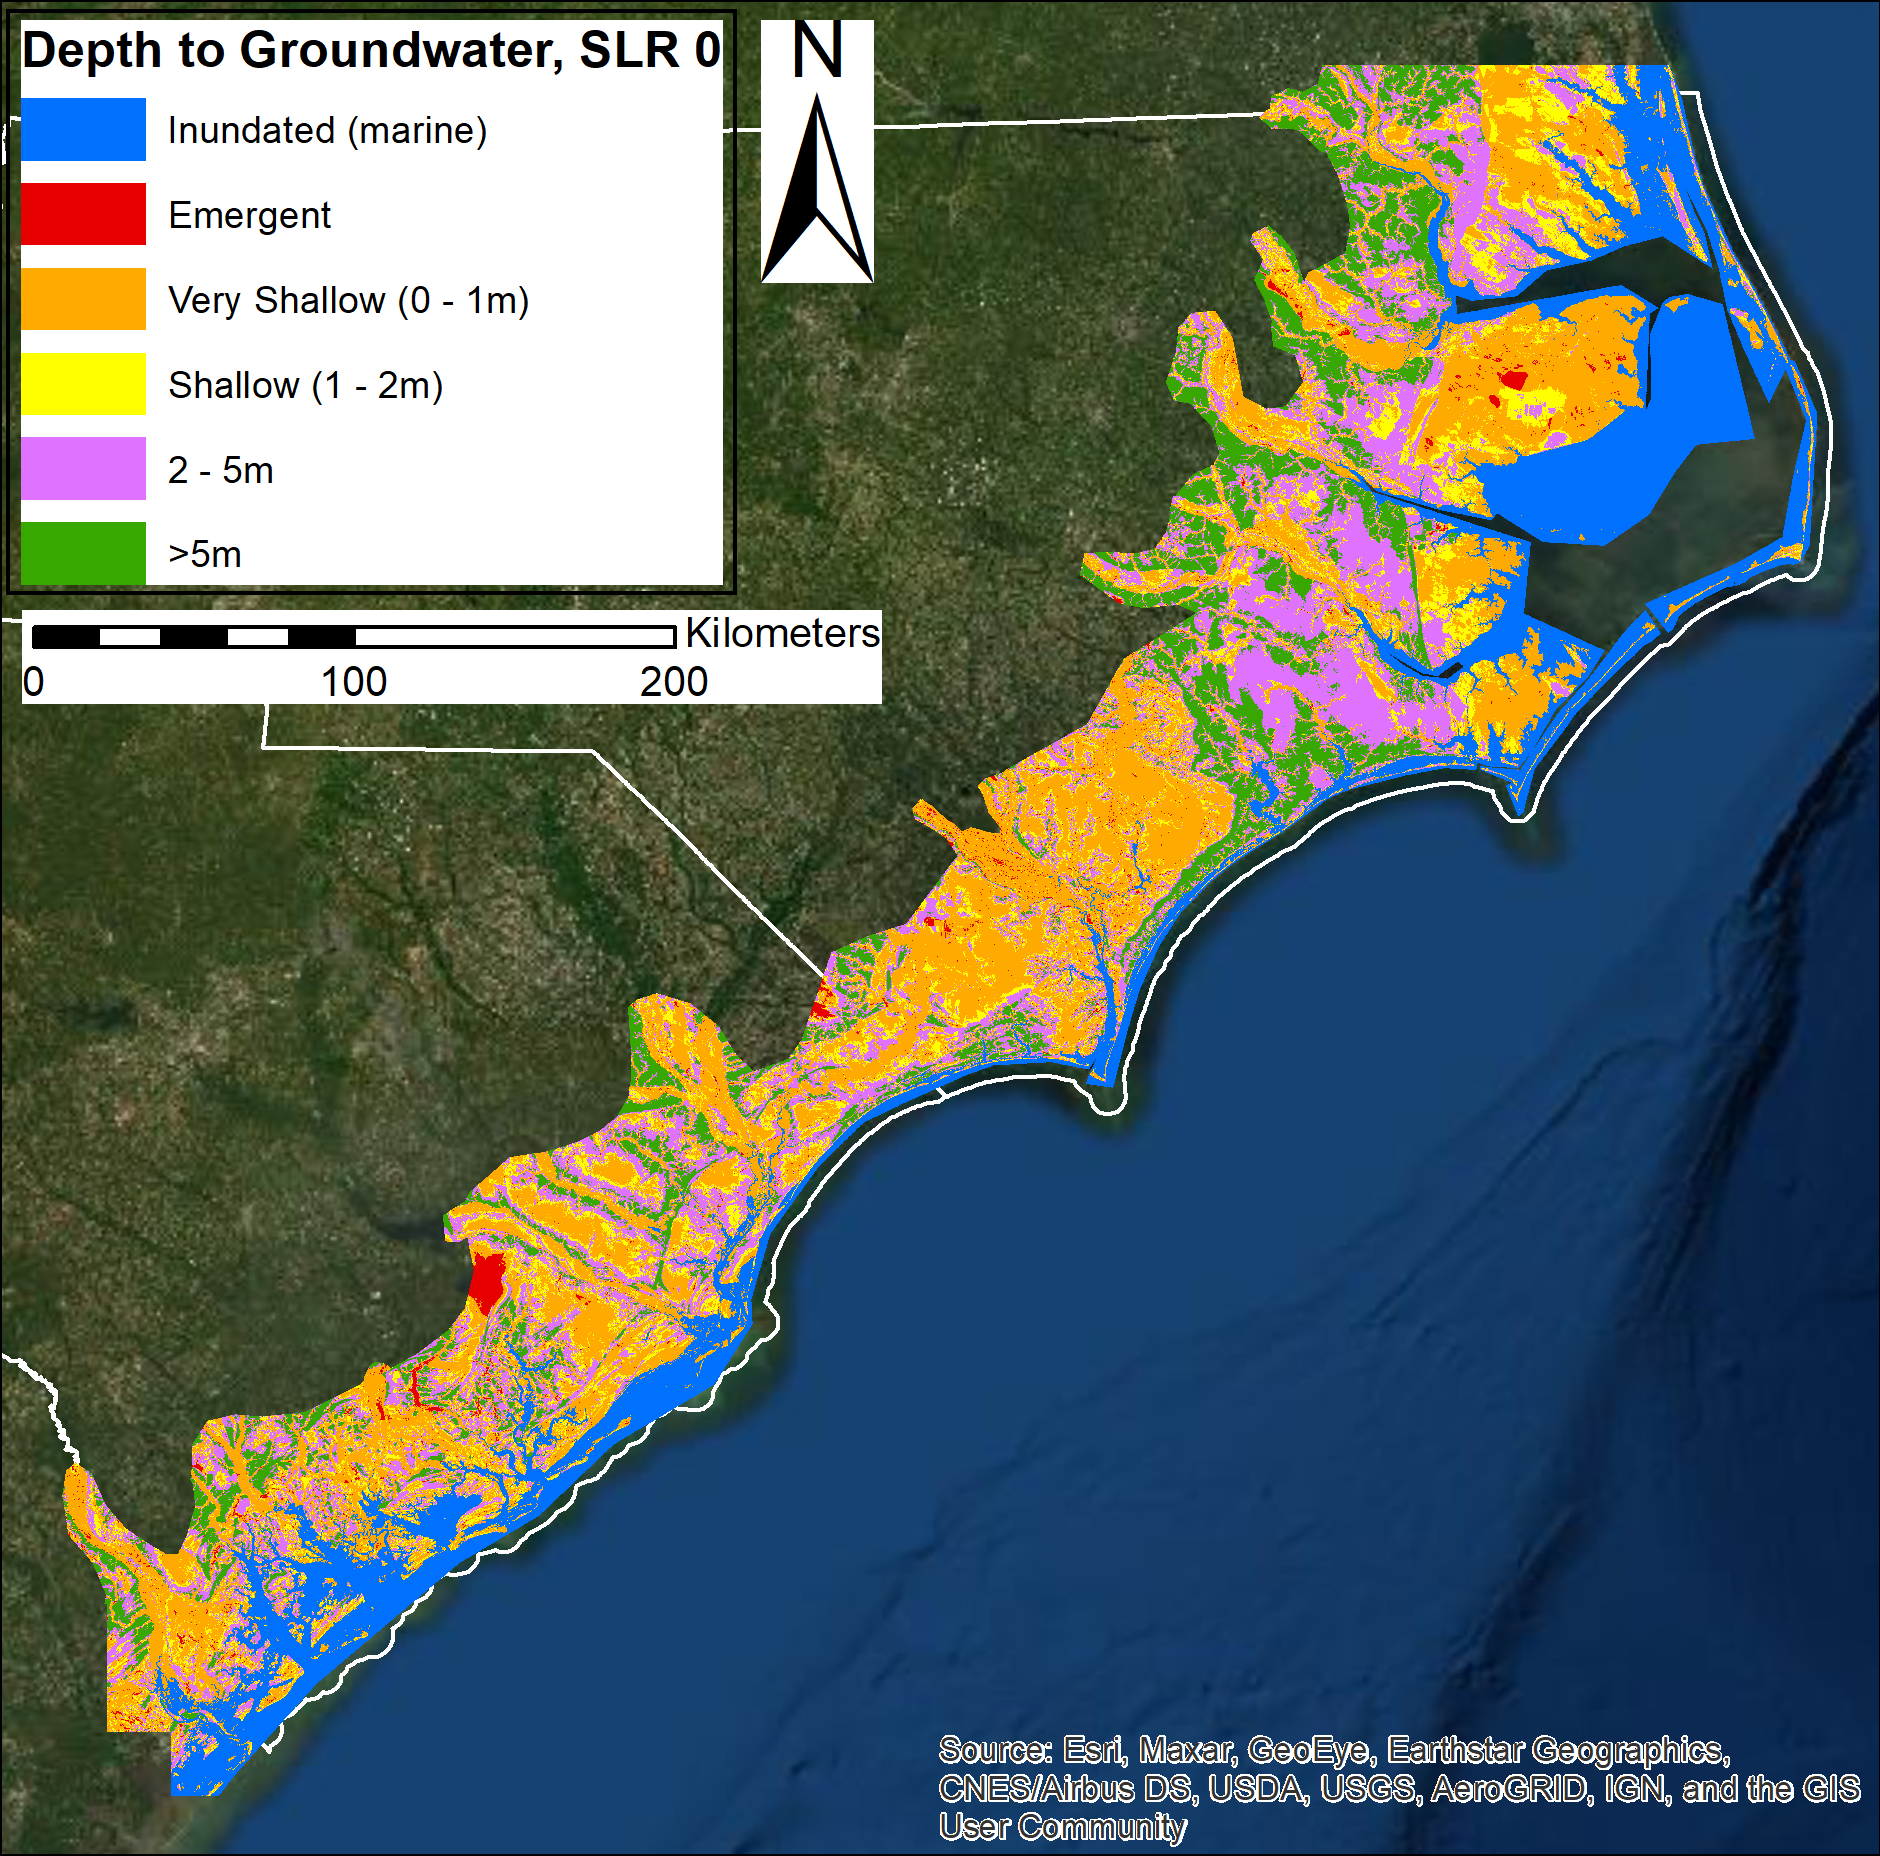
Projected groundwater emergence and shoaling along the North and South Carolina coasts
Groundwater emergence and shoaling extents are derived from water table depth GeoTIFFs, which are calculated as steady-state groundwater model heads subtracted from high-resolution topographic digital elevation model (DEM) land surface elevations. Results are provided as shapefiles of water table depth in specific depth ranges.
Data Files
GWHazards_EmergShoaling_NC_Kx0p1_WTbins.zip - 434.5 MB - MD5:6466c6513dee3c90d8116ef5421743f8
GWHazards_EmergShoaling_NC_Kx10_WTbins.zip - 328.4 MB - MD5:75d32d667cb9e953d7b155d815912189
GWHazards_EmergShoaling_NC_Kx1_WTbins.zip - 418.6 MB - MD5:7ae49174e4bef29e99588fe8bca73a0e
GWHazards_EmergShoaling_SC_Kx0p1_WTbins.zip - 266.0 MB - MD5:6dd94eacc2b53590013af2c266248f60
GWHazards_EmergShoaling_SC_Kx10_WTbins.zip - 192.1 MB - MD5:b7e768db2c0a0537ab3bd3e038bad2b0
GWHazards_EmergShoaling_SC_Kx1_WTbins.zip - 261.4 MB - MD5:92e684ccee4d12645b4fc1c319edb671
Metadata Files
GWHazards_EmergShoaling_metadata.xml - 25.3 KB
GWHazards_EmergShoaling_metadata.txt - 25.0 KB
-
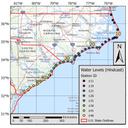
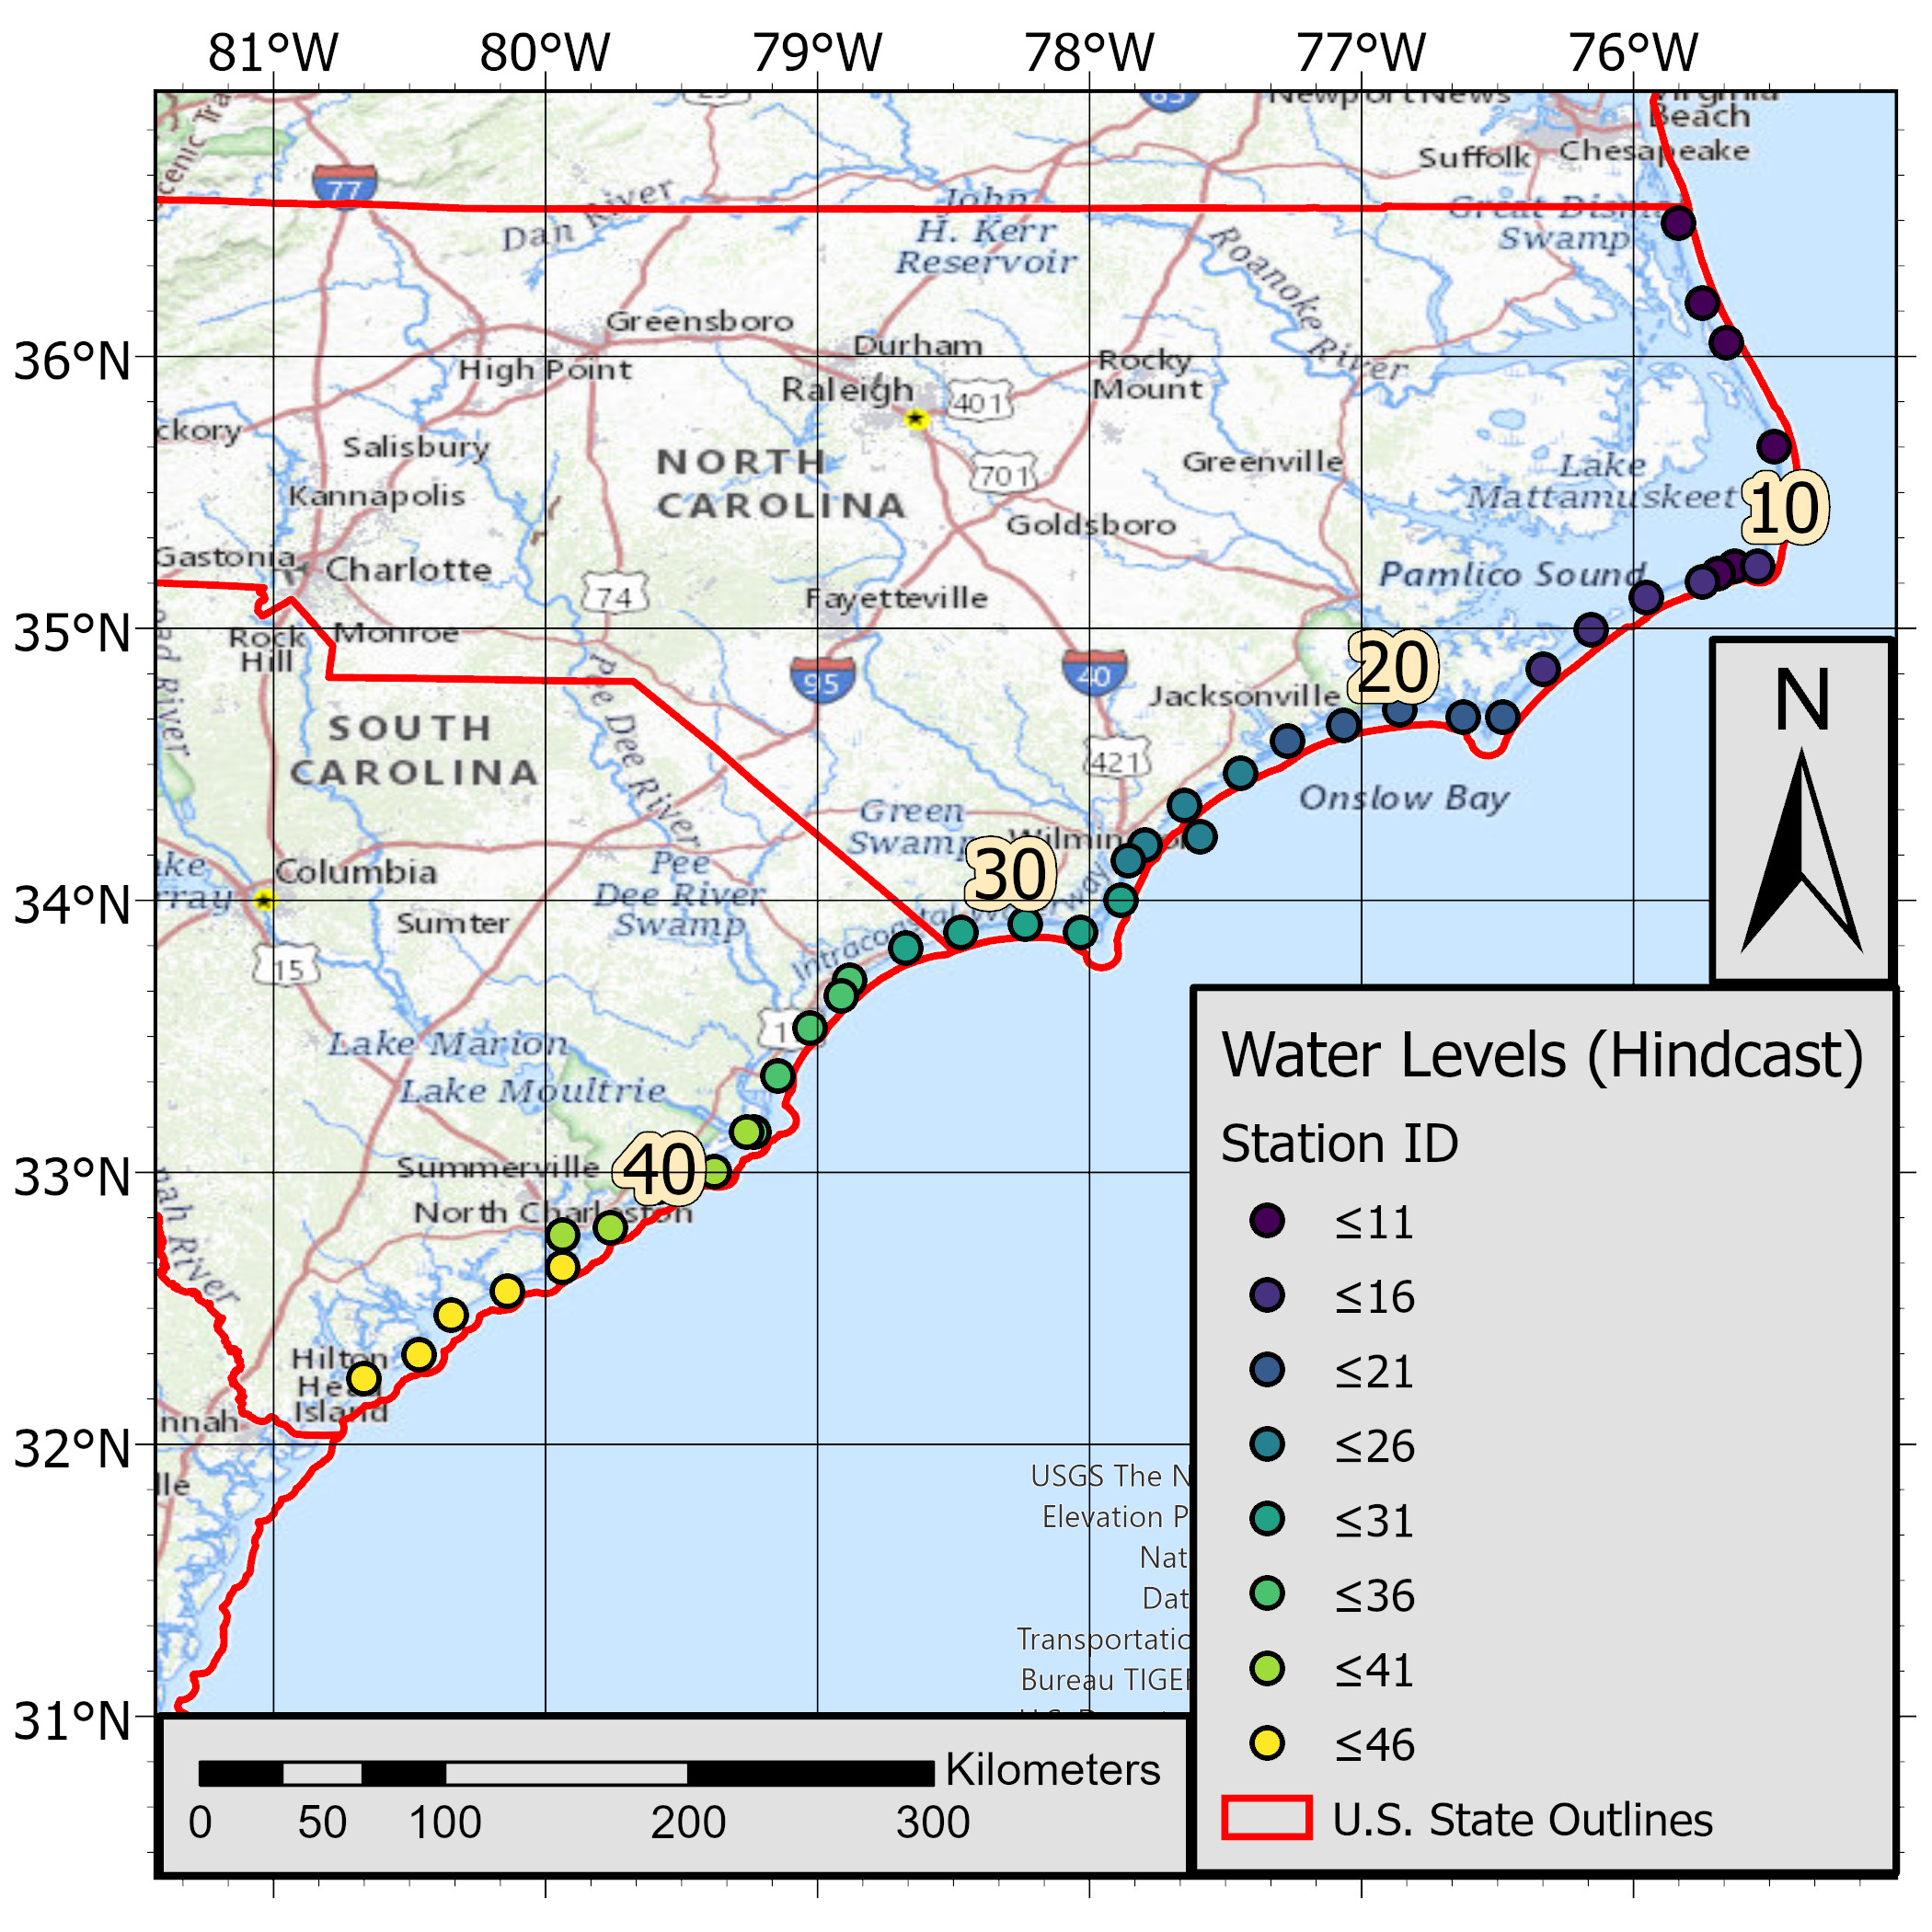
Nearshore water level, tide, and non-tidal residual hindcasts (1979-2016) for the North and South Carolina coasts
A dataset of modeled nearshore water levels (WLs) was developed for the North and South Carolina coastlines. Water levels, defined for this dataset as the linear sum of tides and non-tidal residuals (NTR), were produced by Muis and others (2016) using a global tide and surge model (GTSM) forced by global atmospheric fields -. Water level outputs were extracted from the global grid at approximately 20 km resolution along the coastlines. These data were then statistically downscaled using a signal-specific set of corrections to improve skill in comparison to tide gauge observations (Parker and others, 2023). Hindcast water levels were forced by ERA5 atmospheric forcing provided by the dataset of Hersbach and others (2020). ERA5 is a reanalysis product, incorporating observations and data assimilation to best represent the experienced climate. Therefore, data from this version of the dataset are comparable to observed WLs along the study region.
Data Files
WL_Tide_NTR_ERA5hindc_NC.zip - 464.5 MB - MD5:9f874498f5a1fe9b990c742d19e04eb5
WL_Tide_NTR_ERA5hindc_SC.zip - 311.4 MB - MD5:fc2e57e24d0b1c48100a887111523354
WL_Tide_NTR_ERA5_Ref_StationIdsLocs_NC.csv - 553 bytes - MD5:9a0e726b7ecc4c135eb9f9907ed4ace5
WL_Tide_NTR_ERA5_Ref_StationIdsLocs_SC.csv - 372 bytes - MD5:9e906aa6dfb3e78957951fc4f925412b
Metadata Files
WL_Tide_NTR_ERA5hindc_metadata.xml - 33.3 KB
WL_Tide_NTR_ERA5hindc_metadata.txt - 32.0 KB
-
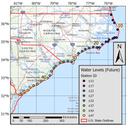
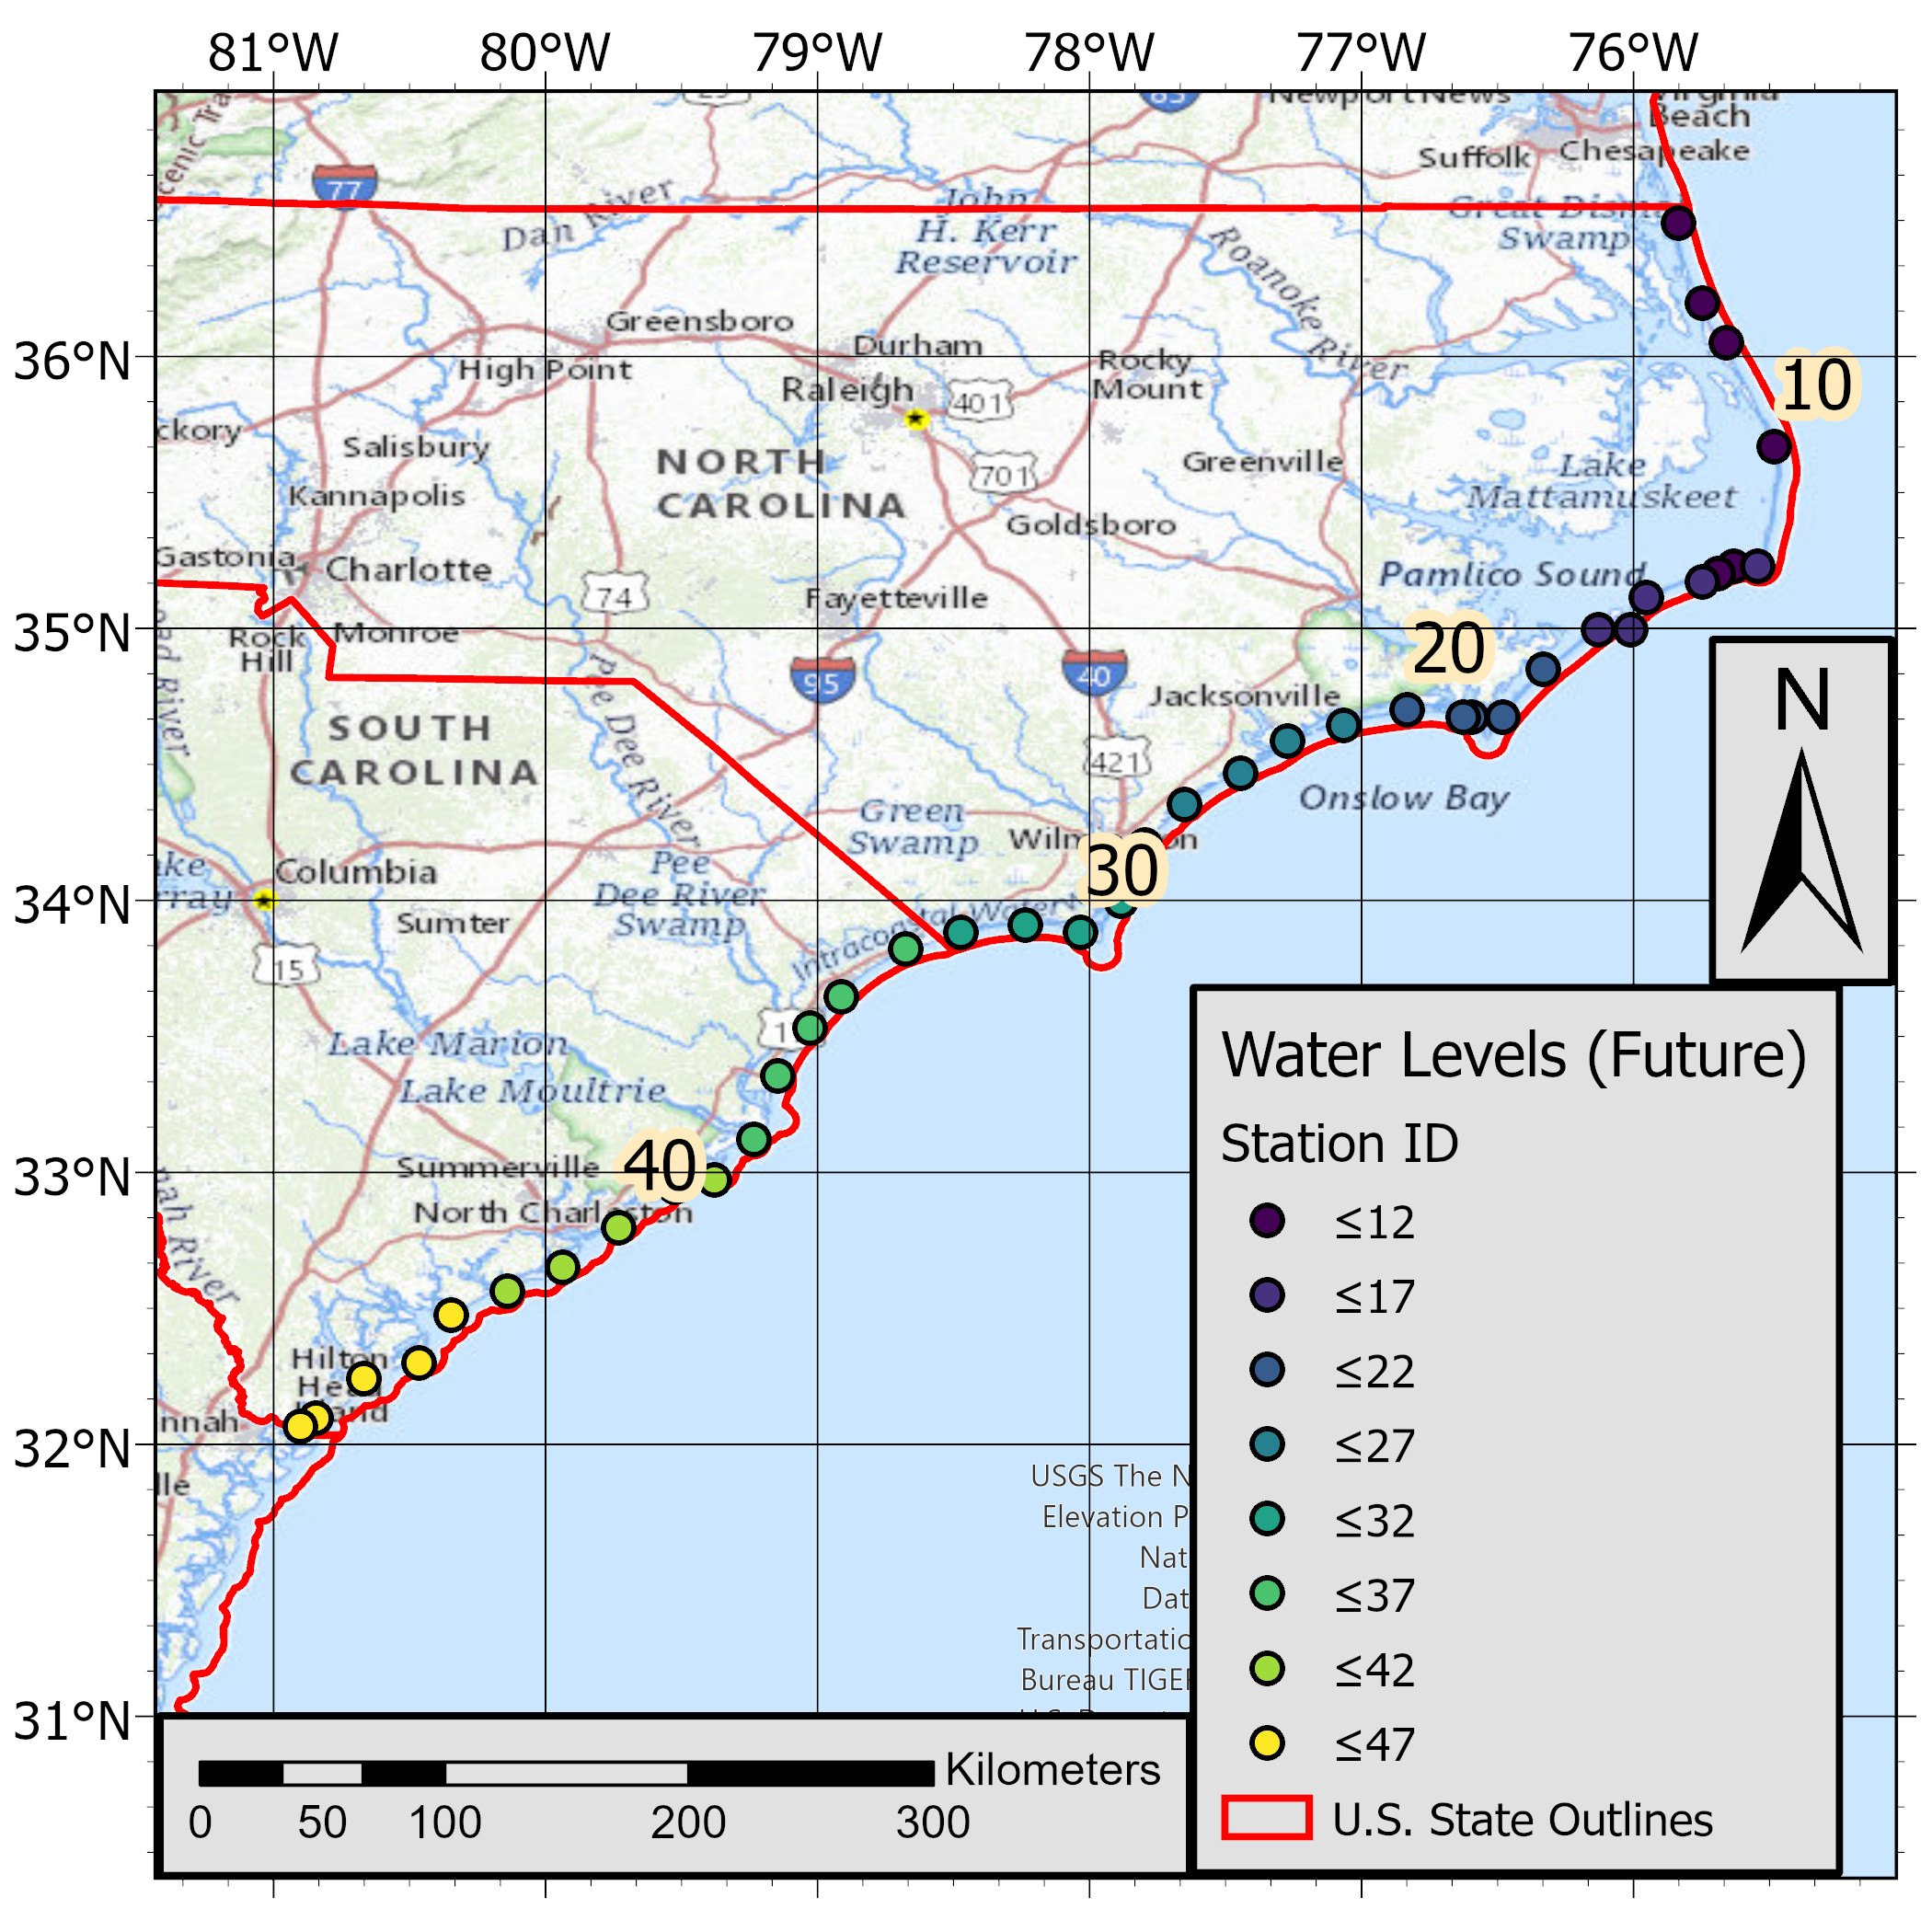
Nearshore water level, tide, and non-tidal residual future projections (2016-2050) for the North and South Carolina coasts
A dataset of modeled nearshore water levels (WLs) was developed for the North and South Carolina coastlines. Water levels, defined for this dataset as the linear sum of tides and non-tidal residuals (NTR), were produced by Muis and others (2016) using a global tide and surge model (GTSM) forced by global atmospheric fields. Water level outputs were extracted from the global grid at approximately 20 km resolution along the southeast Atlantic coastline. These data were then statistically downscaled using a signal-specific set of corrections to improve skill in comparison to tide gauge observations (Parker and others, 2023). Projected water levels were forced by CMIP6 future period data. This dataset provides information on how water levels are expected to change moving towards the future. Four CMIP6 climate models were selected from the High-Resolution Model Intercomparison project (highresMIP; Haarsma and others, 2016) to sample variability in climate predictions.
Data Files
WL_Tide_NTR_CMIP6Fut_NC.zip - 1.2 GB - MD5:449ab91c1e13071f49503940d0ce981b
WL_Tide_NTR_CMIP6Fut_SC.zip - 1.5 GB - MD5:1960aa3d8187a300d4189ab23f3fde49
WL_Tide_NTR_CMIP6_Ref_StationIdsLocs_NC.csv - 525 bytes - MD5:4546b580d71c8b3b27c8106078b09fe0
WL_Tide_NTR_CMIP6_Ref_StationIdsLocs_SC.csv - 318 bytes - MD5:470a11dc6b229816a061f794b4994a47
Metadata Files
WL_Tide_NTR_CMIP6Fut_metadata.xml - 36.7 KB
WL_Tide_NTR_CMIP6Fut_metadata.txt - 35.5 KB
-
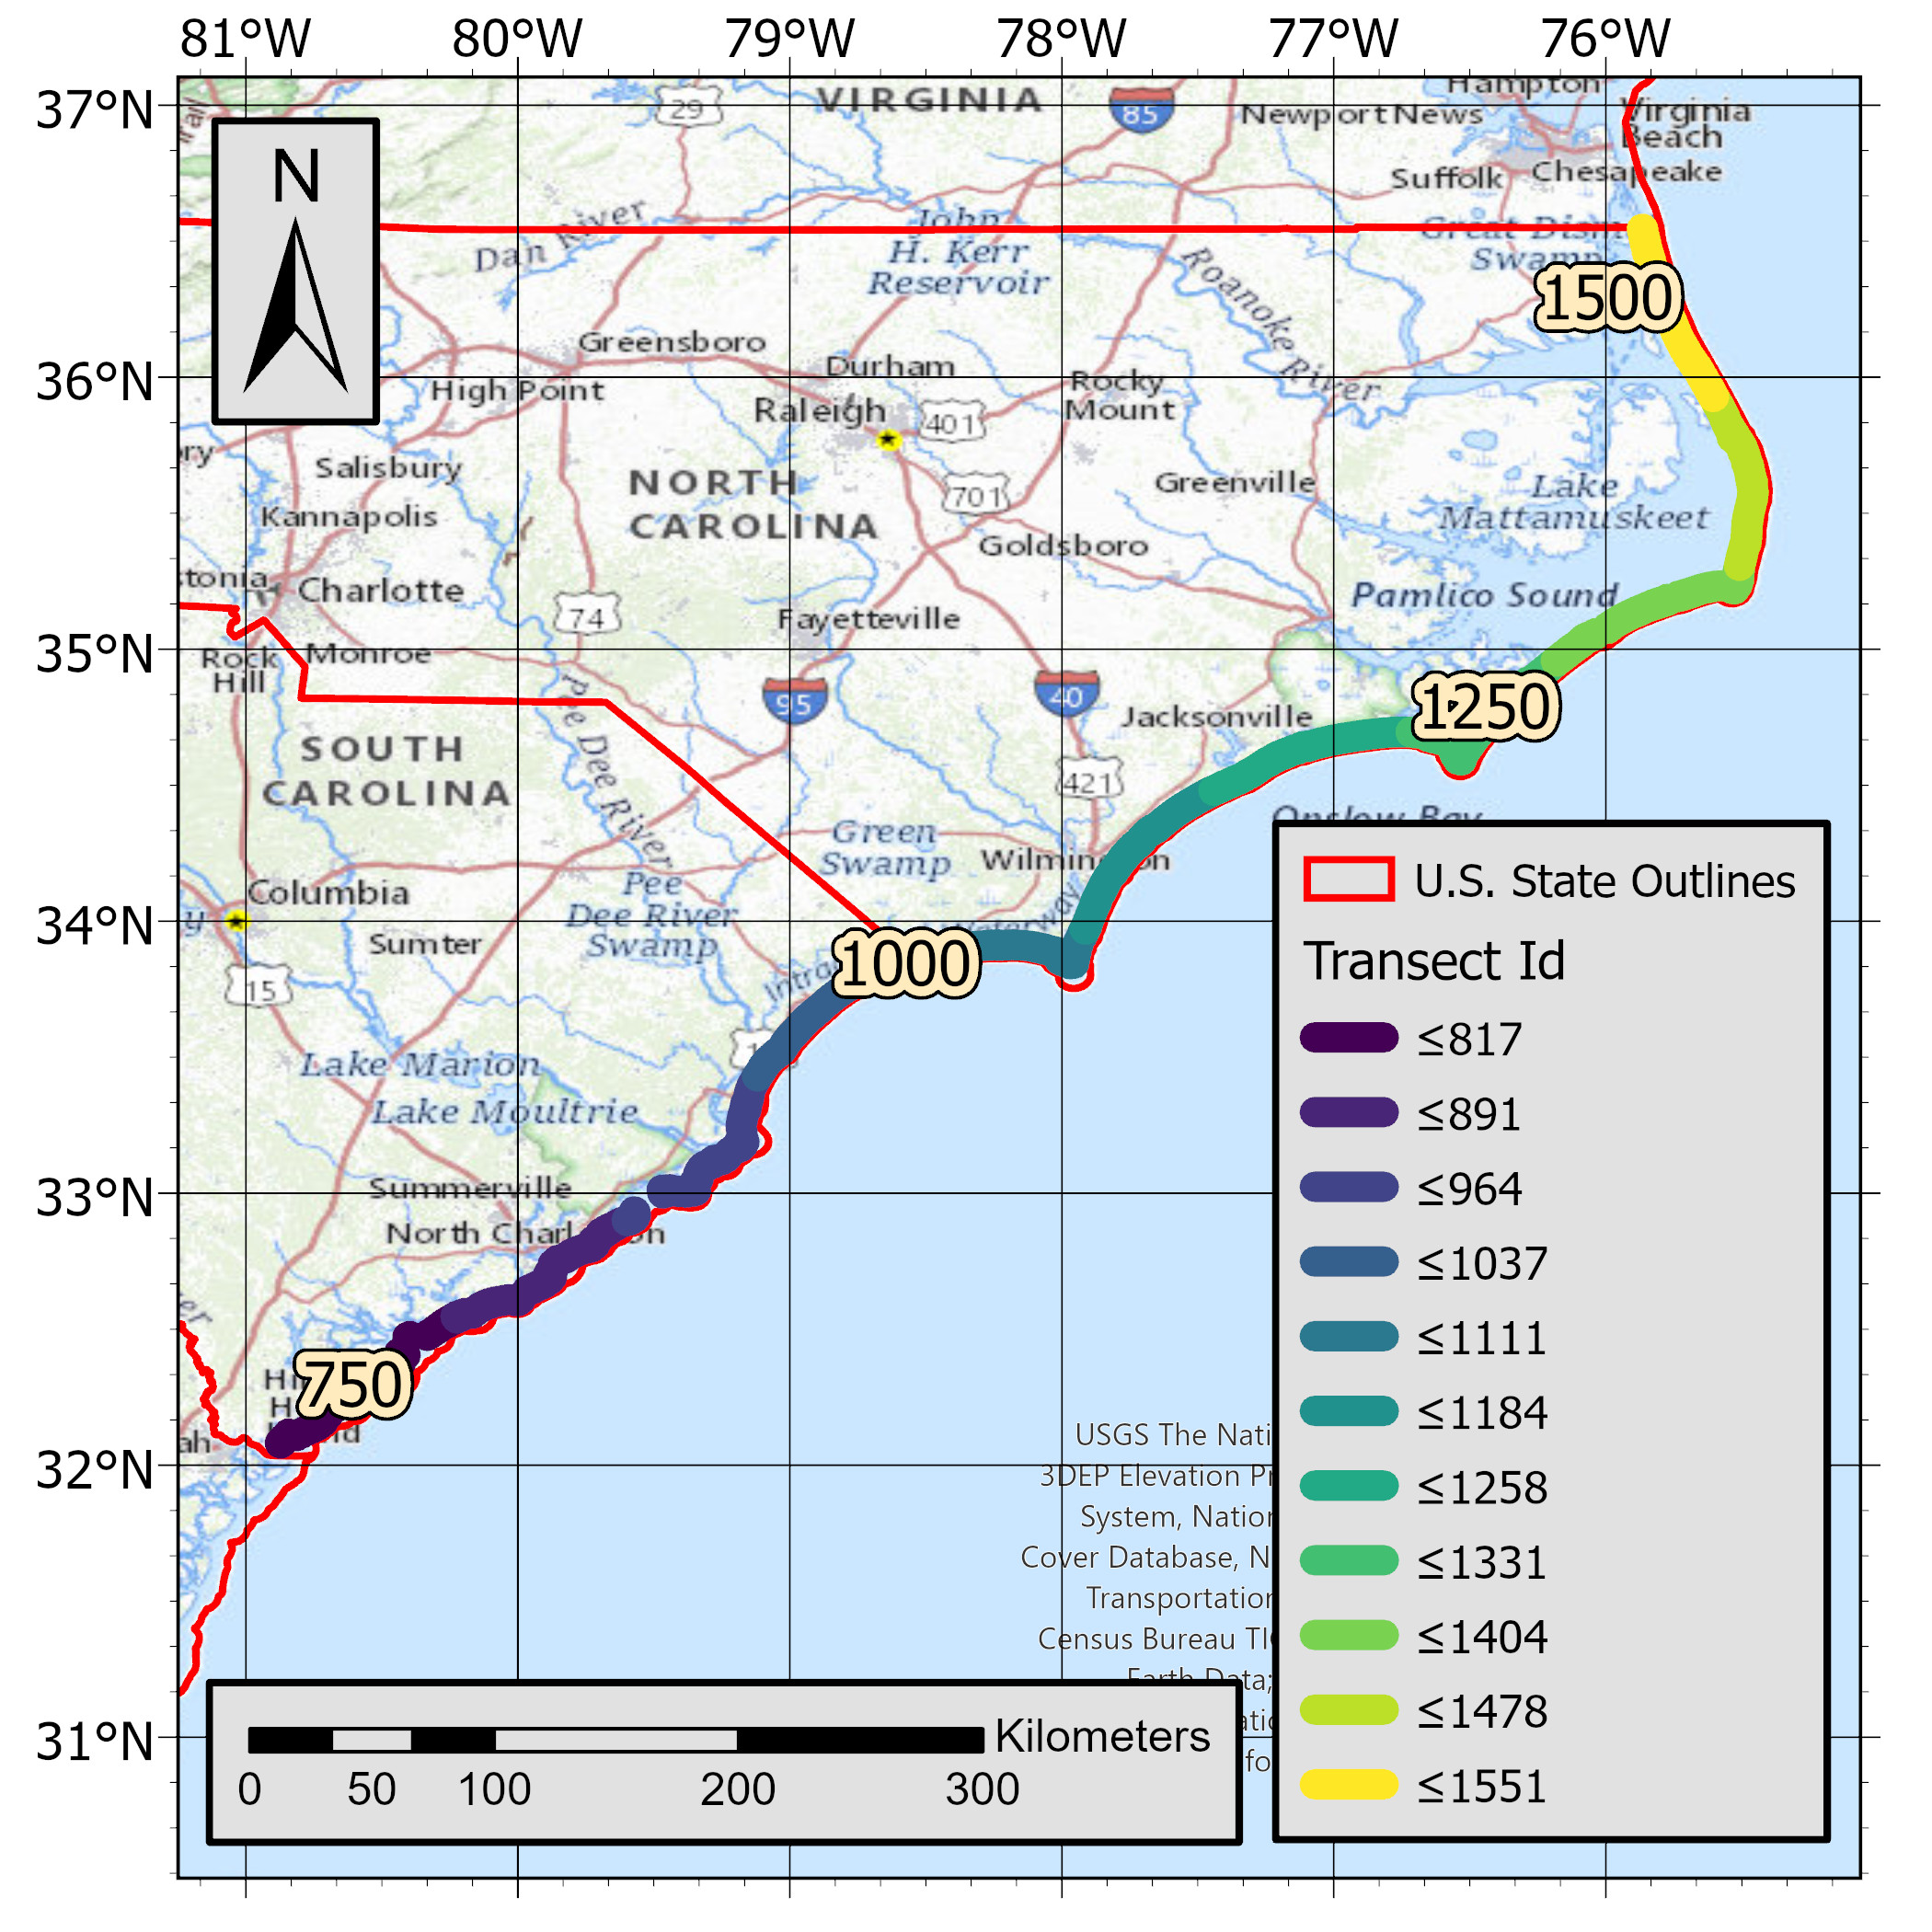
Nearshore parametric wave setup hindcast data (1979-2019) for the North and South Carolina coasts
This dataset presents alongshore wave setup timeseries for the North and South Carolina coastlines. Wave setup was modelled using parameterization for open coast sandy beaches as presented in Stockdon and others (2006). The parameterization relates onshore wave setup to offshore wave conditions and beach characteristics. Wave conditions were extracted at approximately the 10 m depth contour and reverse shoaled to the deep-water condition. These data were then matched to cross-shore transects spaced at approximately 1 km along the coastline. Beach slope at these transects were extracted from lidar (Doran and others, 2017) and temporally averaged across all available datasets. This dataset is forced by waves taken directly from the ERA5 reanalysis, which incorporates observations and data assimilation (Hersbach and others, 2020). Therefore, data presented in this data release represent a best prediction of the observed historical wave setup along the study region. This dataset and the methodology used for its production is further detailed in Parker and others (2023). Modeled wave setup time series are presented for the hindcast period 1979 to 2019. Output includes 1-hour wave setup provided at approximately 1,600 alongshore transects at approximately 1-5 km resolution. Data are available as csv files for each transect location and are bundled by state.
Data Files
WaveSetup_ERA5_NC.zip - 779.2 MB - MD5:a11735c9927b4d0b0ebb8c9a9f37abc3
WaveSetup_ERA5_SC.zip - 432.8 MB - MD5:553eaf26d310a200dfd089edf3363c26
WaveSetup_Ref_TransectIdsLocs_NC.csv - 21.5 KB - MD5:9968b0cf98f181d414d9a359c0e76d07
WaveSetup_Ref_TransectIdsLocs_SC.csv - 12.3 KB - MD5:4b5086402d508239c1828b0f725bdd80
Metadata Files
WaveSetup_ERA5_metadata.xml - 32.7 KB
WaveSetup_ERA5_metadata.txt - 31.5 KB
-
Nearshore parametric wave setup future projections (2020-2050) for the North and South Carolina coasts
This dataset presents alongshore wave setup timeseries for the North and South Carolina coastlines. Wave setup was modelled using parameterization for open coast sandy beaches as presented in Stockdon and others (2006). The parameterization relates onshore wave setup to offshore wave conditions and beach characteristics. Wave conditions were extracted at approximately the 10 m depth contour and reverse shoaled to the deep-water condition. These data were then matched to cross-shore transects spaced at approximately 1 km along the coastline. Beach slope at these transects were extracted from lidar (Doran and others, 2017) and temporally averaged across all available datasets. Waves were modelled using a global WAVEWATCHIII model forced by atmospheric forcing from the Coupled Model Intercomparison Project (CMIP6) future period data. This dataset provides information on how water setup is expected to change moving towards the future. The methodology used to produce this dataset is further detailed in Parker and others (2023). Data are provided for 6 CMIP6 models from the HighResMIP project (Haarsma and others, 2016). Output includes 1-hour wave setup provided at approximately 1,600 alongshore transects at approximately 1-5 km resolution. Data are available as csv files for each transect location and are bundled by state.
Data Files
WaveSetup_CMIP6Fut_NC.zip - 1.7 GB - MD5:6767d8d3a0e754ecb9647d52428538a8
WaveSetup_CMIP6Fut_SC.zip - 940.6 MB - MD5:93d96189d343f94ce587ec011ad6d38b
WaveSetup_Ref_TransectIdsLocs_NC.csv - 21.5 KB - MD5:9968b0cf98f181d414d9a359c0e76d07
WaveSetup_Ref_TransectIdsLocs_SC.csv - 12.3 KB - MD5:4b5086402d508239c1828b0f725bdd80
Metadata Files
WaveSetup_CMIP6Fut_metadata.xml - 33.8 KB
WaveSetup_CMIP6Fut_metadata.txt - 32.6 KB

-
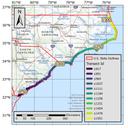
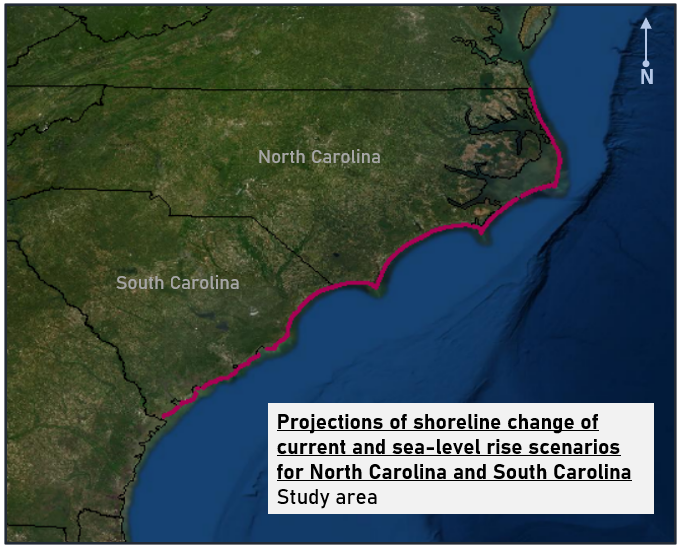
Projections of shoreline change of current and future (2005-2100) sea-level rise scenarios for North Carolina and South Carolina
This dataset contains projections of shoreline change and uncertainty bands for future scenarios of sea-level rise (SLR). Scenarios include 25, 50, 75, 100, 150, 200, and 300 centimeters (cm) of SLR by the year 2100. Output for SLR of 0 cm is also included, reflective of conditions in 2005, in accordance with recent SLR projections and guidance from the National Oceanic and Atmospheric Administration (NOAA; see process steps). Projections were made using the Coastal Storm Modeling System - Coastal One-line Assimilated Simulation Tool (CoSMoS-COAST), a numerical model (described in Vitousek and others, 2017; 2021; 2023) run in an ensemble forced with global-to-local nested wave models and assimilated with satellite-derived shoreline (SDS) observations. Shoreline positions from models are generated at pre-determined cross-shore transects and output includes different cases covering important model behaviors (cases are described in process steps of metadata; see citations listed in the Cross References section for more details on the methodology and supporting information). This model shows change in shoreline positions along transects, considering sea level, wave conditions, along-shore/cross-shore sediment transport, long-term trends due to sediment supply, and estimated variability due to unresolved processes (as described in Vitousek and others, 2021). Variability associated with complex coastal processes (for example, beach cusps/undulations and shore-attached sandbars) are included via a noise parameter in a model, which is tuned using observations of shoreline change at each transect and run in an ensemble of 200 simulations; this approach allows for a representation of statistical variability in a model that is assimilated with sequences of noisy observations. The model synthesizes and improves upon numerous, well-established shoreline models in the scientific literature; processes and methods are described in this metadata (see lineage and process steps), but also described in more detail in Vitousek and others 2017, 2021 and 2023. KMZ data are readily viewable in Google Earth. For best display of results, it is recommended to turn off any 3D features or terrain. For technical users and researchers, shapefile and KMZ data can be ingested into geographic information system (GIS) software such as Global Mapper or QGIS.
Data Files
ShorelineChange_projctn_NC.zip - 213.3 MB - MD5:4420f978330fc984c30130ce853c7660
ShorelineChange_projctn_SC.zip - 110.3 MB - MD5:d22ecccf3d63c5837fa7e7e947bfb359
Metadata Files

Satellite Data
-
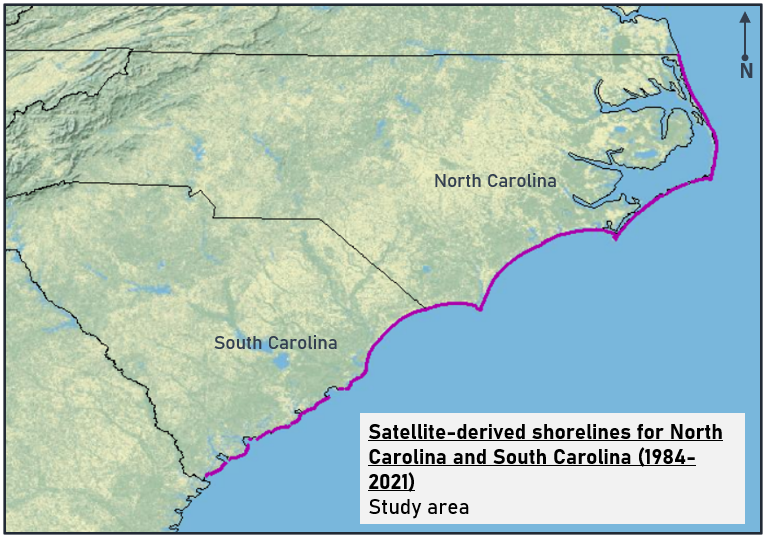
Satellite-derived shorelines for North Carolina and South Carolina (1984-2021)
This dataset contains shoreline positions derived from available Landsat satellite imagery for North Carolina and South Carolina for the time period of 1984 to 2021. Positions were determined using CoastSat (Vos and others, 2019a and 2019b), an open-source mapping toolbox, was used to classify coastal Landsat imagery and detect shorelines at the sub-pixel scale.
To understand shoreline evolution in complex environments and operate long-term simulations illustrating potential shoreline positions in the next century (Vitousek and others, 2017, 2021), robust historical shoreline data is necessary. Satellite-derived shorelines (SDS) offer expansive shoreline observational data over large geographic and temporal scales. Resulting shorelines for the period of 1984-2021 are presented in KMZ format. Significant uncertainty is associated with the locations of shorelines in extremely dynamic regions, including at the locations of river mouths, tidal inlets, capes, and ends of spits.
These data are readily viewable in Google Earth. For best display of results, it is recommended to turn off any 3D viewing. For technical users and researchers, data can be ingested into Global Mapper or QGIS for more detailed analysis.Data Files
Satellite_Derived_Shorelines_NC_north.zip - 45.9 MB - MD5:d4a41c6a1742770a957bf566f5e1b41b
Satellite_Derived_Shorelines_NC_south.zip - 41.5 MB - MD5:127d0f1f4a7e71aa681de37562a62557
Satellite_Derived_Shorelines_SC.zip - 51.4 MB - MD5:f1bb7e2e3a2a9d24abd85df0aa9d352a
Metadata Files

-
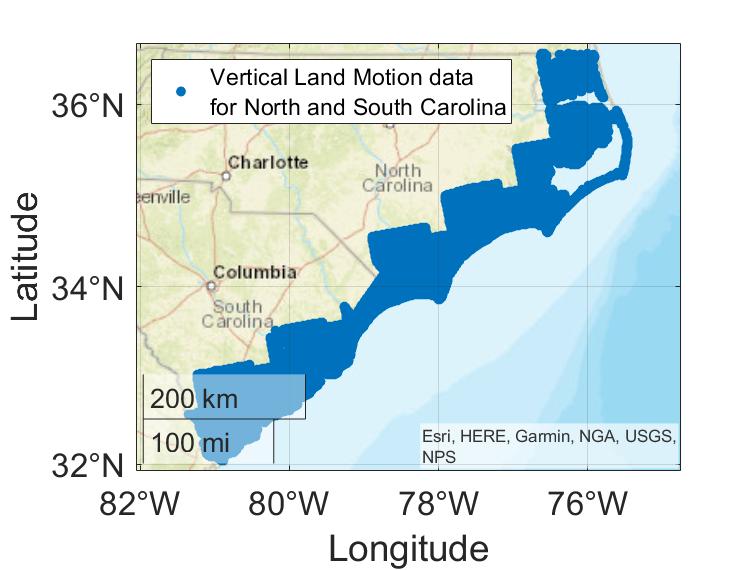
Vertical land motion rates for the years 2007 to 2020 for the North and South Carolina coasts
Rates of land subsidence and uplift for the North and South Carolina coasts are derived from Sentinel-1A/B (2015-2020) and ALOS (2007-2011) synthetic aperture radar (SAR) satellites, at approximately 50-75 m resolution and mm-level precision. The data consist of vertical land motion (VLM) rates and the 1-sigma error in land motion rates and are available as csv files.
Data Files
VerticalLandMotion_Rate_NC.zip - 58.1 MB - MD5:b8fe214525b6706805fdc547876a8d6f
VerticalLandMotion_Rate_SC.zip - 52.1 MB - MD5:992c5ffbae9908f63cb60930c27cf1dd
Metadata Files
VerticalLandMotion_Rate_metadata.xml - 26.7 KB
VerticalLandMotion_Rate_metadata.txt - 25.7 KB
Suggested Citation
Barnard, P.L., Befus, K.M., Danielson, J.J., Engelstad, A.C., Erikson, L.H., Foxgrover, A.C., Hardy, M.W., Hoover, D.J., Leijnse, T., Massey, C., McCall, R., Nadal-Caraballo, N., Nederhoff, K.M., Ohenhen, L., O'Neill, A., Parker, K.A., Shirzaei, M., Su, X., Thomas, J.A., van Ormondt, M., Vitousek, S.F., Vox, K., and Yawn, M.C., 2023, Future coastal hazards along the U.S. North and South Carolina coasts (ver. 2.0, November 2024): U.S. Geological Survey data release, https://doi.org/10.5066/P9W91314.
Revision History
First release: 2023
Revised: November 2024 (ver. 2.0)
Changes in Version 2.0
New dataset added for rasters of water surface elevation derived from existing flood depth data