Typhoon Merbok Disaster Emergency Recovery Coastal Monitoring
Extratropical Typhoon Merbok struck Alaska's west coast in September 2022 and generated significant storm surge that caused severe flooding, erosion damage, and loss of subsistence infrastructure to over 35 communities along more than 1300 miles of Alaska’s western coast. The U.S. Geological Survey participated in a multi-agency response to study the storm's effects and develop enhanced storm modeling and forecasting tools.
Coastal monitoring
The U.S. Geological Survey (USGS) Pacific Coastal and Marine Science Center conducts coastal monitoring in four communities impacted by Merbok using coastal imagery and oceanographic data. Coastal observing web cameras (CoastCams) collect images of the coast and nearshore waters of areas impacted by Typhoon Merbok. Buoys deployed during ice-free months near each CoastCam station collect oceanographic data.
Camera stations and buoys were installed at: Golovin, Shishmaref, Teller, and Unalakleet. Click the station links to learn more and see image products.
Data from these stations will be used to assess the skill of the USGS Total Water Level and Coastal Change Forecast. Additional information about this project is available at the Real-time Forecasts of Coastal Change and Coastal Change Hazards Portal for the use of the public, government officials, and city planners to protect and prepare coastal communities for storm impacts.
Coastal imagery
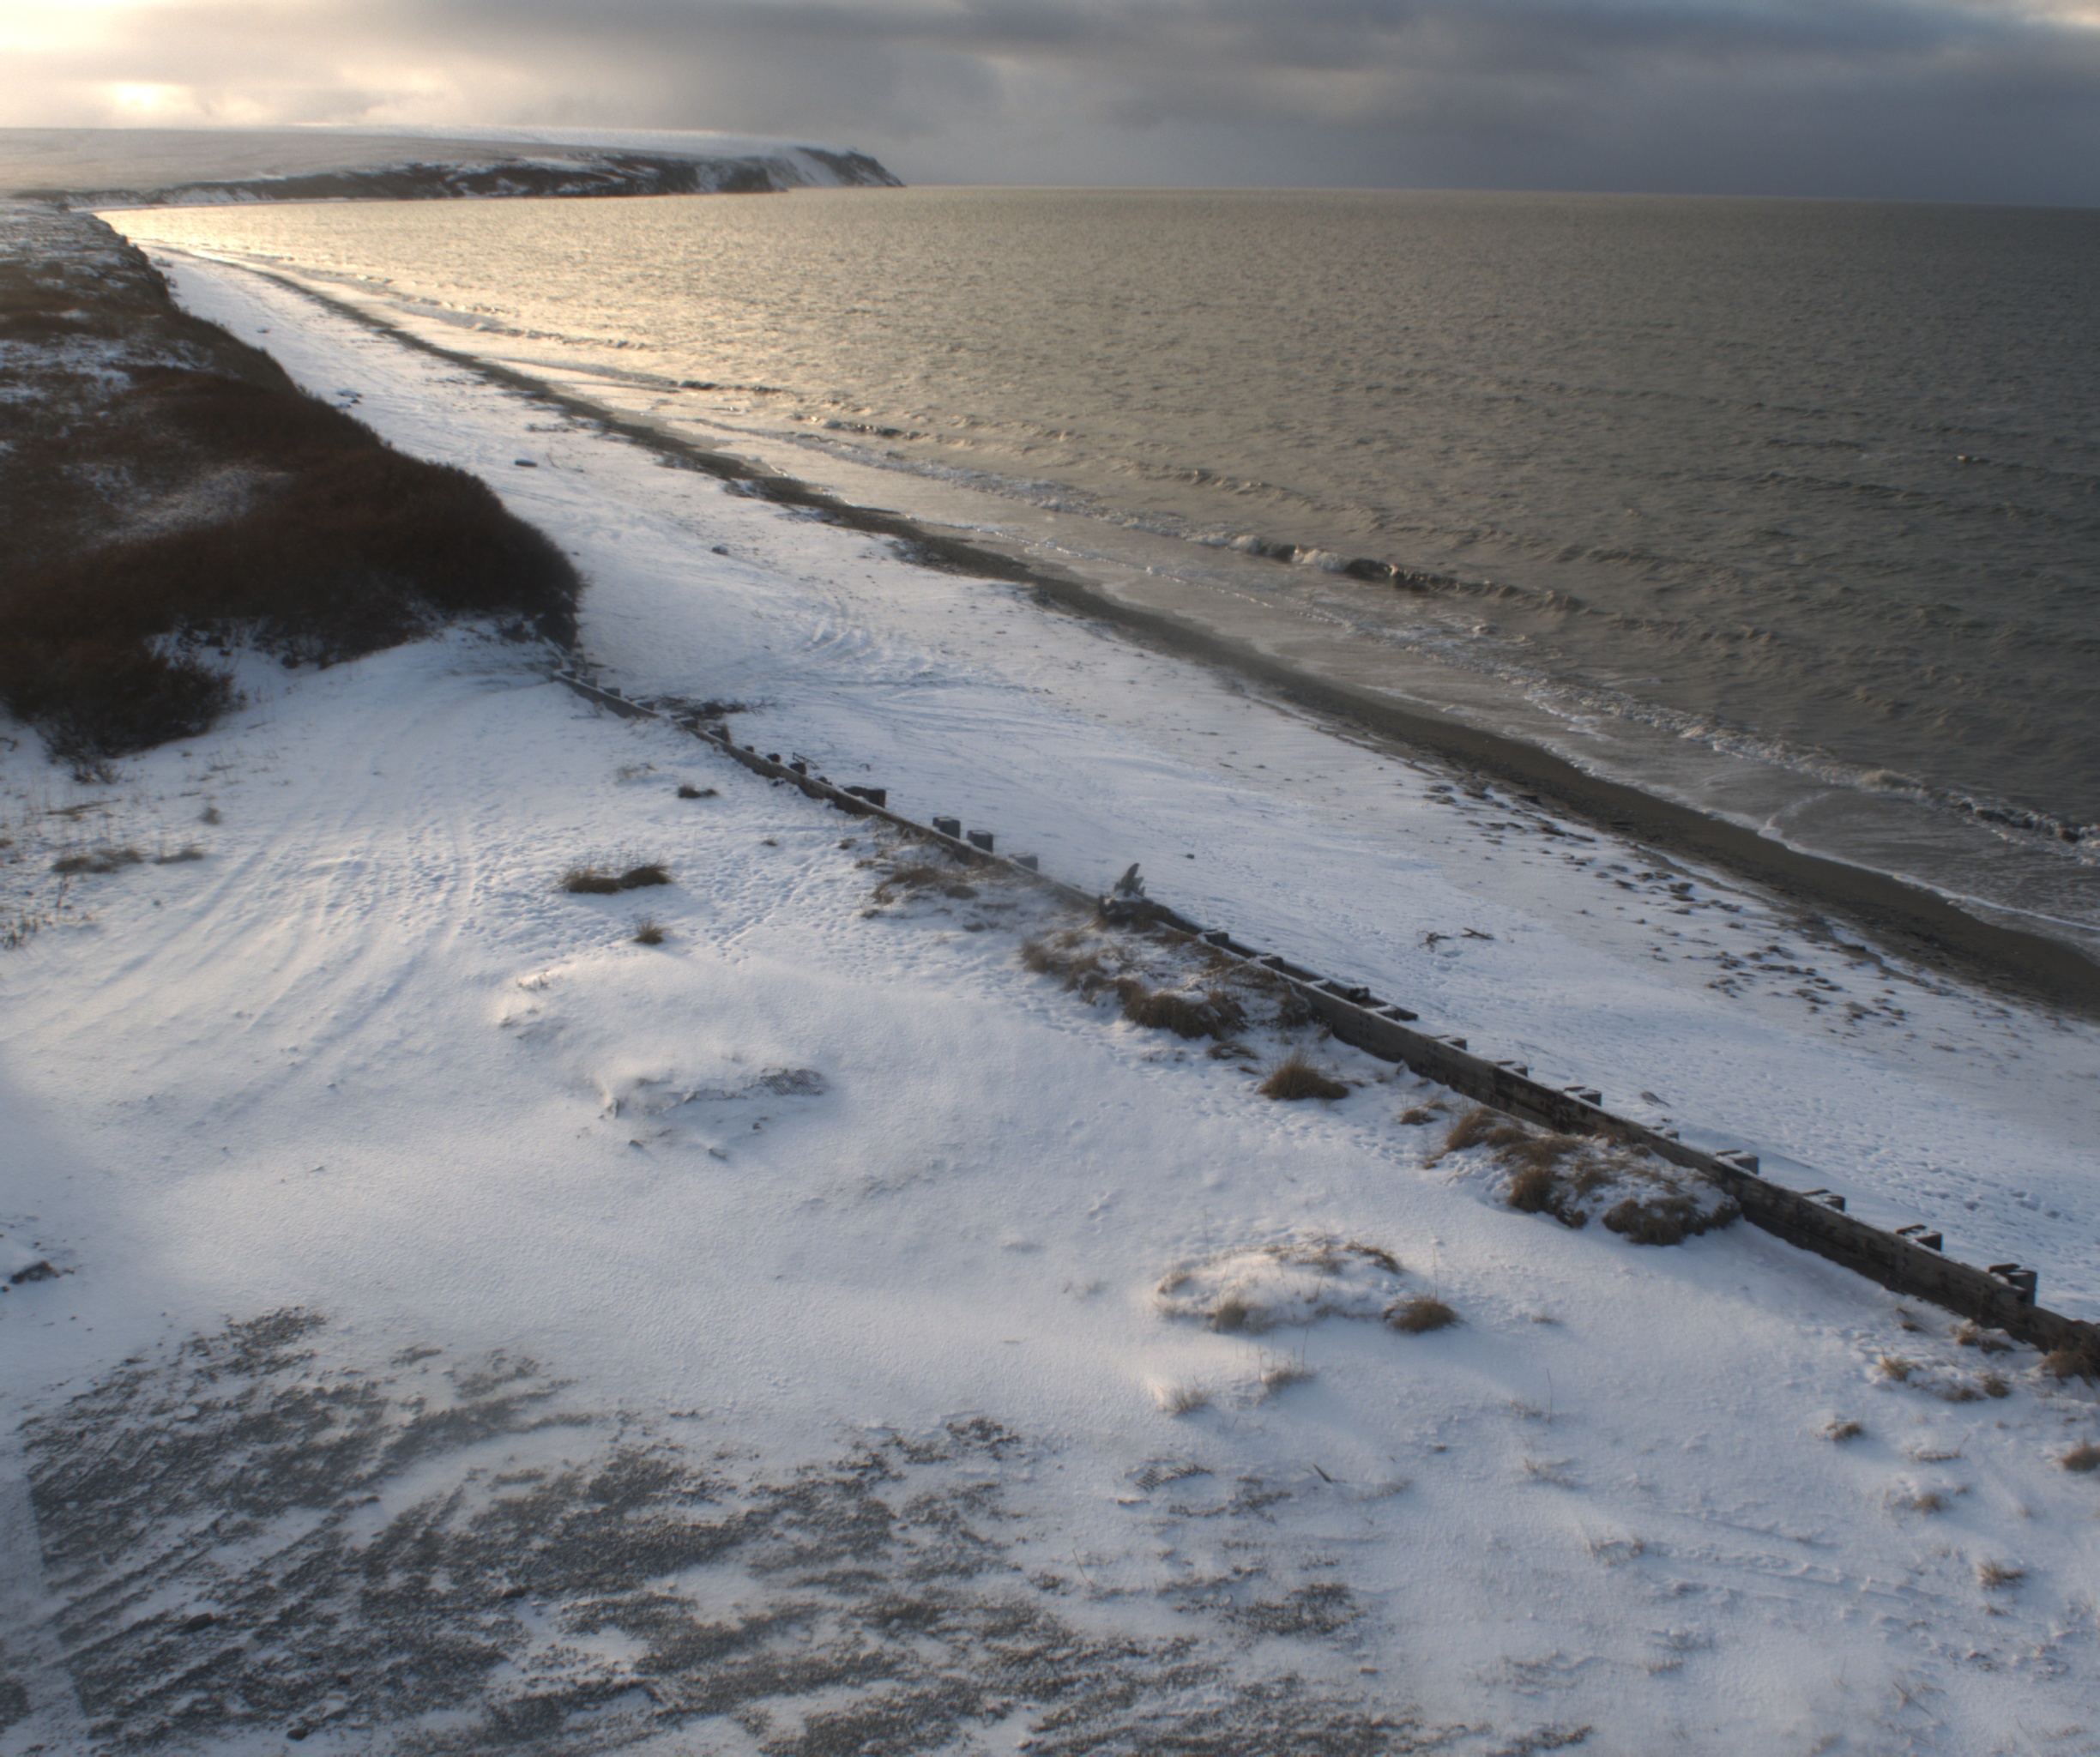
Example snapshot from the Teller station.
Remote video cameras are a powerful tool to continuously monitor long stretches of coast. A camera system provides hourly estimates of coastal water levels influenced by tides, winds, waves, and changes at the coast. The systems used by USGS consist of two video cameras housed in a weather-proof case mounted with a seaward view and a minicomputer wired to the camera and stored in a sheltered location. The minicomputer is solar-powered and runs automatically with cellular internet connection. At regular intervals, during daylight hours, the camera takes snapshots and videos from which several products are created, such as time exposure images. This type of data collection has been successful at numerous sites around the world and can be used to examine a range of coastal information, including waves, regular and extreme water level statistics, shoreline position, sandbar position and movement, rip current presence, and coastal changes.
The following types of images can be obtained by processing the data from the camera system:
- Snapshots: The first frame of the video, just like a standard photo
- Time exposure: Time averaged-image of all frames, it is used to determine the location of persistent wave breaking.
- Variance: Image that shows the standard deviation of pixel intensity, it is used to determine where objects in the image are moving.
- Bright: A composite image that shows the brightest pixel values throughout the video, is it used to estimate the maximum wave run-up on the beach.
- Dark: A composite image that shows the darkest pixel values throughout the video, it is used to remove the bright intensity breaking waves from the image.
Oceanographic data
Surface wave buoys measure the changes in elevation of the sea surface as waves pass by the buoy. The buoys record accelerations and/or Global Positioning System (GPS) signals. These data are analyzed to calculate information describing the waves including:
- Significant wave height: The average of the highest one-third of all the wave heights during the sampling period.
- Peak period: The wave period is the time it takes for one complete wave to pass a particular point. Peak refers to the wave period with the most wave energy.
- Peak wave direction: The direction waves are traveling from at the peak period (meteorological convention). The units are degrees from true North, increasing clockwise, with North as 0 degrees and East as 90 degrees, etc.
- Peak directional spreading: Describes the range of wave directions about the peak wave direction.
Map showing locations of CoastCam and buoy stations in area affected by Typhoon Merbok. Click on the circular markers on the map to see CoastCam station information and sample imagery.
More information
USGS aids storm response to Extratropical Typhoon Merbok in AlaskaUSGS CoastCam network
Pacific Coastal and Marine Science Center
USGS Coastal and Marine Hazards and Resources Program
Contact us
|
Daniel Nowacki dnowacki@usgs.gov 831-460-7428 |
Li Erikson lerikson@usgs.gov 831-460-7563 |
Ann Gibbs agibbs@usgs.gov 831-460-7540 |
PCMSC Data Management pcmsc_data@usgs.gov 831-460-7540 |