|
|
|
|
VIDEO FRAME
|
NARRATIVE
|
|
|
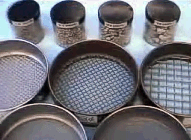
The most common and widely
accepted method of separating sand- and gravel-sized material into
classes is by the use of wire-mesh sieves. |
|
|
First, a bank of sieves is assembled consisting
of a pan and the 3, 2, 1, 0, and -1 phi sieves arranged with the
finest mesh on the bottom. It is not important whether the analyst
uses Wentworth or phi scales for the sieve sizes as long as the
interval between the sieves brings out the continuous nature of the
frequency distribution. |
|
|
A sample of about 40 grams or
less is introduced into the top of the bank, the cover is attached. |
|
|
The bank is placed into a mechanical shaker. |
|
|
After agitation for 10 to 15
minutes, the bank of sieves is removed from the mechanical shaker,
and the sieves are separated. |
|
|
If material is retained on the -1 phi sieve,
than gravel is present in the sample and the procedure must be
repeated with a bank of gravel sieves to analyze that fraction. |
|
|
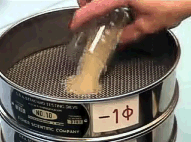
Each sieve that contains some
sample is, in turn, emptied individually onto a large sheet of
paper. Brushing and tapping the sieve on the flat work surface
ensures that all of the sample has been dislodged from the sieve. |
|
|
The sediment is transferred to a tared beaker. |
|
|
The beaker with sample is
weighed and the weight is recorded. The recorded weights of the phi
sizes are added and normalized to determine the frequency
distributions within the sand and gravel fractions. |


