|
|
|
|
VIDEO FRAME
|
NARRATIVE
|
|
|
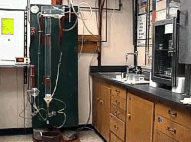
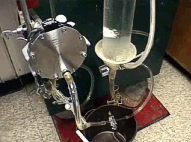
The Rapid Sediment Analyzer,
or RSA, is a settling tube suitable for the analysis of sand-sized
material. |
|
|
This model is equipped with a differential
pressure transducer and calculates a size distribution based on the
change in pressure with elapsed time. Other RSA’s are equipped with
balances that can measure changes in weight with time. |
|
|
A micro splitter is used to
obtain a representative 7 to 8-gram subsample. |
|
|
The sample is placed in a tablespoon and
dampened with water by pipette to prevent trapped intergranular air
from impeding the settling process. |
|
|
The sample should then be
manually spread into a thinner layer to facilitate rapid
disaggregation upon impact with the water surface. |
|
|
Care must be taken to introduce the entire
sample simultaneously into the middle of the settling tube. If the
entire sample is not entered simultaneously, the sample will take
longer to settle out of suspension and the calculated distribution
will be finer than actually present. If the sample is not entered
directly into the center of the settling tube, density currents may
form along the tube wall allowing the sample to settle more rapidly
and this results in a calculated distribution that is coarser than
actually present. |
|
|
The sand grains settle
according to Stoke’s Law; pressure decreases as the grains settle
past the lower transducer port. |
|
|
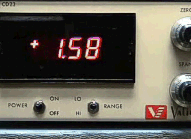
The analog signal from the transducer is
amplified and logged on a computer equipped with an
analog-to-digital converter. A typical analysis time is
approximately 2 minutes. |


