USGS Coastal and Marine Hazards and Resources Program
Title Page /
Table of Contents /
List of Figures /
Introduction /
Maps / Data Collection/Processing / Interpretation / Acknowledgments / Appendix 1 / Appendix 2 /
Appendix 3 /
 |
||
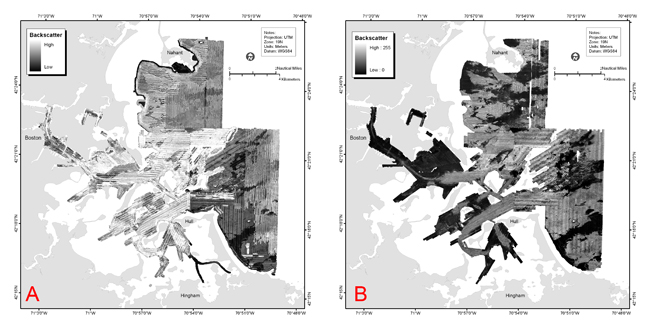
Figure 4.22. Sidescan sonar mosaic (A) assembled in the field during the hydrographic surveys and (B) the mosaic assembled from reprocessed sidescan-sonar data. The mosaics are qualitatively similar, but the reprocessed mosaic has more uniform intensity and improved resolution. | ||