USGS Coastal and Marine Hazards and Resources Program
Title Page /
Table of Contents /
List of Figures /
Introduction /
Maps / Data Collection/Processing / Interpretation / Acknowledgments / Appendix 1 / Appendix 2 /
Appendix 3 /
 |
||
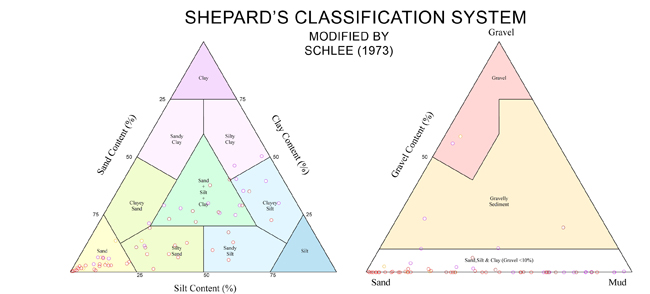
Figure A2.1. Texture of surficial sediment collected in grab samples shown on ternary diagrams. The stations are keyed to the map units (see fig. 4.21). Texture of the rough sea-floor zones is not represented, as samples could not be collected in areas of boulders or gravel pavement. | ||