Multibeam bathymetric data collected in Cape Cod Bay, Massachusetts during USGS Field Activity 2019-002-FA, using a dual-head Reson T20-P multibeam echo sounder (32-bit GeoTIFF, UTM Zone 19N, NAD 83, MLLW Vertical Datum, 5-m resolution)

Metadata also available as - [Outline] - [Parseable text] - [XML]

Frequently anticipated questions:


What does this data set describe?

Title:
Multibeam bathymetric data collected in Cape Cod Bay, Massachusetts during USGS Field Activity 2019-002-FA, using a dual-head Reson T20-P multibeam echo sounder (32-bit GeoTIFF, UTM Zone 19N, NAD 83, MLLW Vertical Datum, 5-m resolution)
Abstract:
Accurate data and maps of sea floor geology are important first steps toward protecting fish habitat, delineating marine resources, and assessing environmental changes due to natural or human impacts. To address these concerns the U.S. Geological Survey, in cooperation with the Massachusetts Office of Coastal Zone Management (CZM), comprehensively mapped the Cape Cod Bay sea floor to characterize the surface and shallow subsurface geologic framework. Geophysical data collected include swath bathymetry, backscatter, and seismic reflection profile data. Ground-truth data, including sediment samples, underwater video, and bottom photographs were also collected. This effort is part of a long-term collaboration between the USGS and the Commonwealth of Massachusetts to map the State’s waters, support research on the Quaternary evolution of coastal Massachusetts, the influence of sea-level change and sediment supply on coastal evolution, and efforts to understand the type, distribution, and quality of subtidal marine habitats. This collaboration produces high-resolution geologic maps and Geographic Information System (GIS) data that serve the needs of research, management and the public. Data collected as part of this mapping cooperative continue to be released in a series of USGS Open-File Reports and Data Releases (https://www.usgs.gov/centers/whcmsc/science/geologic-mapping-massachusetts-seafloor). This data release provides the geophysical and geologic sampling data collected in Cape Cod Bay during USGS Field Activities 2019-002-FA and 2019-034-FA in 2019.
Supplemental_Information:
Support for 2019-002-FA was provided to the USGS from the Massachusetts Office of Coastal Zone Management. Additional information on the field activities associated with this project are available at https://cmgds.marine.usgs.gov/fan_info.php?fan=2019-002-FA and https://cmgds.marine.usgs.gov/fan_info.php?fan=2019-034-FA.
  1. How might this data set be cited?
    Ackerman, Seth D., 20220718, Multibeam bathymetric data collected in Cape Cod Bay, Massachusetts during USGS Field Activity 2019-002-FA, using a dual-head Reson T20-P multibeam echo sounder (32-bit GeoTIFF, UTM Zone 19N, NAD 83, MLLW Vertical Datum, 5-m resolution): data release DOI:10.5066/P99DR4PN, U.S. Geological Survey, Coastal and Marine Hazards and Resources Program, Woods Hole Coastal and Marine Science Center, Woods Hole, Massachusetts.

    Online Links:

    This is part of the following larger work.

    Ackerman, Seth D., Foster, David S., Andrews, Brian D., Danforth, William W., Baldwin, Wayne E., Huntley, Emily C., Worley, Charles R., and Brothers, Laura L., 2022, High-resolution geophysical and geological data collected in Cape Cod Bay, Massachusetts during USGS Field Activities 2019-002-FA and 2019-034-FA: data release DOI:10.5066/P99DR4PN, U.S. Geological Survey, Reston, VA.

    Online Links:

    Other_Citation_Details:
    Suggested citation: Ackerman, S.D., Foster, D.S., Andrews, B.D., Danforth, W.W., Baldwin, W.E., Huntley, E.C., Worley, C.R., and Brothers, L.L., 2022, High-resolution geophysical and geological data collected in Cape Cod Bay, Massachusetts during USGS Field Activities 2019-002-FA and 2019-034-FA (ver. 2.0, September 2022): U.S. Geological Survey data release, https://doi.org/10.5066/P99DR4PN.
  2. What geographic area does the data set cover?
    West_Bounding_Coordinate: -70.52226274
    East_Bounding_Coordinate: -70.09312866
    North_Bounding_Coordinate: 42.03757526
    South_Bounding_Coordinate: 41.74330944
  3. What does it look like?
    https://cmgds.marine.usgs.gov/data-releases/media/2021/10.5066-P99DR4PN/5a5a52e4cb5e456c90a6f98f64b7d138/2019-002-FA_T20P_Bathymetry_5m_MLLW_browse.jpg (JPEG)
    Thumbnail image of 5-m multibeam echo sounder bathymetry data collected in Cape Cod Bay, Massachusetts.
  4. Does the data set describe conditions during a particular time period?
    Beginning_Date: 01-Aug-2019
    Ending_Date: 29-Aug-2019
    Currentness_Reference:
    ground condition during field activity 2019-002-FA: 20190801-20190829
  5. What is the general form of this data set?
    Geospatial_Data_Presentation_Form: raster digital data
  6. How does the data set represent geographic features?
    1. How are geographic features stored in the data set?
      This is a Raster data set. It contains the following raster data types:
      • Dimensions 6429 x 7024 x 1, type Grid Cell
    2. What coordinate system is used to represent geographic features?
      Grid_Coordinate_System_Name: Universal Transverse Mercator
      Universal_Transverse_Mercator:
      UTM_Zone_Number: 19N
      Transverse_Mercator:
      Scale_Factor_at_Central_Meridian: 0.9996
      Longitude_of_Central_Meridian: -69
      Latitude_of_Projection_Origin: 0
      False_Easting: 500000
      False_Northing: 0
      Planar coordinates are encoded using row and column
      Abscissae (x-coordinates) are specified to the nearest 5.0
      Ordinates (y-coordinates) are specified to the nearest 5.0
      Planar coordinates are specified in meters
      The horizontal datum used is GCS_North_American_1983_2011.
      The ellipsoid used is GRS_1980.
      The semi-major axis of the ellipsoid used is 6378137.000000.
      The flattening of the ellipsoid used is 1/298.257222101.
      Vertical_Coordinate_System_Definition:
      Depth_System_Definition:
      Depth_Datum_Name: Mean Lower Low Water
      Depth_Resolution: 0.1
      Depth_Distance_Units: meters
      Depth_Encoding_Method: Explicit depth coordinate included with horizontal coordinates
  7. How does the data set describe geographic features?
    Entity_and_Attribute_Overview:
    Elevation values in 32-bit GeoTIFF format. Data values represent depths referenced to the Mean Lower Low Water.
    Entity_and_Attribute_Detail_Citation: U.S. Geological Survey

Who produced the data set?

  1. Who are the originators of the data set? (may include formal authors, digital compilers, and editors)
    • Seth D. Ackerman
  2. Who also contributed to the data set?
    The authors acknowledge our fellow participants of the Cape Cod Bay field activities 2019-002-FA (Walter Barnhardt, Luke Bennett, Eric Moore, Alex Nichols, Jake Fredericks, and Dan Kennedy) and 2019-034-FA (Dann Blackwood, Eric Moore, and Alex Nichols); the crew of the M/V Warren Jr and the R/V Tioga; and our sea floor mapping group onshore support team during these surveys (Jane Denny, PJ Bernard, Barry Irwin, and Emile Bergeron).
  3. To whom should users address questions about the data?
    Seth Ackerman
    U.S. Geological Survey
    Geologist
    384 Woods Hole Rd.
    Woods Hole, MA
    USA

    508-548-8700 x2315 (voice)
    508-457-2310 (FAX)
    sackerman@usgs.gov

Why was the data set created?

This dataset provides a high-resolution digital elevation model (DEM) of the seabed created from bathymetric sonar data collected by the U.S. Geological Survey during survey 2019-002-FA in Cape Cod Bay, Massachusetts. The final dataset is referenced to the Mean Lower Low Water (MLLW) tidal datum. In conjunction with other geophysical and sample data, this bathymetry dataset will be used to investigate the morphology and geologic framework of the sea floor and coastal environment.

How was the data set created?

  1. From what previous works were the data drawn?
    Reson T20P multibeam echo sounder raw bathymetry and backscatter (source 1 of 1)
    U.S. Geological Survey, Unpublished Material, raw MBES data in HSX format.

    Type_of_Source_Media: disc
    Source_Contribution:
    Multibeam echo sounder (MBES) bathymetry and backscatter data were collected using dual-head Reson T20-P sonars aboard the M/V Warren Jr. The system was pole-mounted on the port side of the vessel with the transducers located approximately 4.13 m below the waterline when deployed. Vessel navigation and attitude data were acquired using an Applanix POS MV Wavemaster (model 220, V5). An AML Micro X SV mounted on the sonar bracket monitored sound speed near the sonars during acquisition, and an AML MVP30 moving vessel profiler (MVP) or an AML Minos X sound velocity profiler (SVP) was deployed from the stern of the vessel to collect water column sound speed profiles at 1 to 4 hour intervals while underway (See shapefile 2019-002-FA_MVPSVP_data.shp available from the larger work citation). The Reson SeaBat User Interface (version 5.0.0.6) was used to control the sonars, as well as to monitor and record the sonar data. Hypack Hysweep (version 2019, 19.0.6.0) was also used to record and monitor the sonar data. The SeaBat User Interface logged the navigation, attitude, bathymetry, time-series backscatter, and water column data to s7k format files for each sonar. The line files were created by the Reson UI using the following naming convention: YYYYMMDD_HHMMSS_M/S. The line files were appended with a "M" or "S" suffix to denote the port (primary) and starboard (or secondary) sonar heads, respectively. Hypack Hysweep 2019 also was used to log the navigation, attitude, and bathymetry data for both sonars to a single HSX format file. Hypack Hysweep filenames have the format 'YYYYMMDD_HHMMSS_LLL_HHMM', which prepends the Reson filename (YYYYMMDD_HHMMSS) to the Hypack Hysweep filename (LLL_HHMM), where LLL indicates the three digit planned line number and HHMM is the UTC time. The Hypack Hysweep HSX data were used to produce the final processed bathymetry grid.
  2. How were the data generated, processed, and modified?
    Date: May-2020 (process 1 of 4)
    PROCESSING STEP 1: CARIS HIPS DATA PROCESSING. Multibeam bathymetry processing within CARIS HIPS (version 11.3) post-survey consisted of the following flow:
    1) A vessel configuration file was created in CARIS for the HSX sonar files (WarrenJrHSX_4-24-2020.hvf) which included relevant, linear and angular installation offsets for each T20-P unit as well as vendor specified uncertainty values for each of the survey sensors.
    2) A CARIS HIPS project (version 11.3) was created with projection information set to Universal Transverse Mercator (UTM) Zone 19N, WGS84 using the vessel configuration file from step 1.
    3) Each HSX file was imported to the new CARIS project using the Import/Conversion Wizard.
    4) Delayed heave data from raw POS MV files were used to update HIPS survey lines using the import auxiliary data function.
    5) Post-processed navigation, vessel attitude, and GPS height data from POSPac SBET files, and post-processed RMS attitude error data from POSPac smrmsg files were used to update HIPS survey lines using the import auxiliary data function.
    6) Navigation source was set to Applanix SBET, and navigation was reviewed and edited as needed using the Navigation Editor tool.
    6) Georeference Bathymetry was done to apply the sound velocity corrections from the final SVP file (2019-002-FA_SVP_MASTER_v2.svp) containing all the sound velocity profiles collected during the survey, specifying the nearest in time method, 'delayed' heave source, and use surface sound speed.
    8) 5-m resolution Swath Angle Weighted (SWATH) surfaces were created to incorporate all the files as they were processed, and the SWATH surfaces were reviewed for inconsistencies and anomalies.
    9) The swath and subset editors were used to remove spurious points through manual editing and filter application, and the refraction editor was used to adjust sound speed values in areas where sound velocity data did not adequately correct depth profiles, which were obviously influenced by local anomalies in speed of sound through the water column.
    The steps described above were performed by Brian Andrews and Bill Danforth. The contact person for this and all subsequent processing steps below is Seth Ackerman. Person who carried out this activity:
    Seth Ackerman
    U.S. Geological Survey
    Geologist
    384 Woods Hole Rd.
    Woods Hole, MA
    USA

    508-548-8700 x2315 (voice)
    508-457-2310 (FAX)
    sackerman@usgs.gov
    Date: May-2021 (process 2 of 4)
    PROCESSING STEP 2: CREATE FINAL BATHYMETRY SURFACE.
    Bathymetry surfaces were created for several separate areas (Leg1_5m_extract, Leg1_1.8X_cutoff_5m, Leg2, and then mosaicked into a single surface in CARIS 11.3. Two rounds of interpolation were applied to the mosaicked surface to fill small gaps.
    Date: May-2021 (process 3 of 4)
    PROCESSSING STEP 3: EXPORT AND TRANSFORM TO MLLW.
    The final CARIS HIPS SWATH surface was exported as a 5-m per pixel ASCII file referenced to UTM Zone 19N, WGS84 and ellipsoidal heights. The National Oceanic and Atmospheric Administration's Vertical Datum Transformation tool (VDatum v.4.1.2) was used to transform surfaces to Mean Lower Low Water (MLLW). The process required transformation of the horizontal and vertical reference frames from UTM Zone 19N, WGS84 (using ITRF2008) and ellipsoidal heights to UTM Zone 19N, North American Datum of 1983 (NAD 83) and MLLW using the default geoid model. The resulting ASCII raster was opened in Global Mapper (version 19.0) and converted into a 32-bit floating point GeoTIFF 2019-002-FA_T20P_Bathymetry_5m_MLLW.tif) using Export, Export Elevation Grid Format, GeoTIFF.
    Date: Aug-2022 (process 4 of 4)
    PROCESSSING STEP 4: POST-PUBLICATION DATA FIX.
    Three weeks after publication, it was noticed that additional, unintentional interpolation was done during the conversion from ASCII raster to 32-bit GeoTIFF in Global Mapper (see PROCESSING STEP 3 above). To fix the problem, the bathymetry surfaces: Leg2_V3_5m_Interp2, CCBayWest_Leg2_5m_Interp2, Leg1_5m_fbp_interp2, and PtownLine_5m_interp2, were combined in CARIS HIPS version 11.3 and re-exported as described above. The same process to transform the surface to MLLW was done using VDATUM version 4.4.2 and the same conversion to GeoTIFF was done using Global Mapper version 21.0. The new filename is named the same as the original filename.
  3. What similar or related data should the user be aware of?
    Pendleton, E.A., Baldwin, W.E., Barnhardt., W.A., Ackerman, S.D., Foster, D.S., Andrews, B.D., and Schwab, W.C., 2013, Shallow Geology, Sea-floor Texture, and Physiographic Zones of the Inner Continental Shelf from Nahant to Northern Cape Cod Bay, Massachusetts: Open-File Report 2012-1157, U.S. Geological Survey, Coastal and Marine Geology Program, Woods Hole Coastal and Marine Science Center, Woods Hole, MA.

    Online Links:

    Andrews, B.D., Ackerman, S.D., Baldwin, W.E., and Barnhardt, W.A., 2010, Geophysical and Sampling Data from the Inner Continental Shelf: Northern Cape Cod Bay, Massachusetts: Open-File Report 2010-1006, U.S. Geological Survey, Coastal and Marine Geology Program, Woods Hole Coastal and Marine Science Center, Woods Hole, MA.

    Online Links:

    Ackerman, Seth D., Foster, David S., Danforth, William W., and Huntley, Emily C., 2019, High-resolution geophysical and sampling data collected off Town Neck Beach in Sandwich, Massachusetts, 2016: data release DOI:10.5066/P9HZHXXV, U.S. Geological Survey, Reston, VA.

    Online Links:

    Other_Citation_Details:
    Suggested citation: Ackerman S.D., Foster D.S., Danforth W.W., and Huntley, E.C., 2019, High-resolution geophysical and sampling data collected off Town Neck Beach in Sandwich, Massachusetts, 2016: U.S. Geological Survey data release, https://doi.org/10.5066/P9HZHXXV.

How reliable are the data; what problems remain in the data set?

  1. How well have the observations been checked?
  2. How accurate are the geographic locations?
    Navigation data were acquired using the WGS 84 coordinate system with an Applanix POS MV Wavemaster (model 220, V5), which blends Global Navigation Satellite Systems (GNSS) with acceleration data from a Motion Reference Unit (MRU) and GPS azimuthal heading. The POS MV was configured with two AeroAntenna Technologies GPS antennas located at either end of a 2-m baseline, which was oriented fore and aft and mounted atop the MBES pole, approximately midships on the port side of vessel. DGPS positions are horizontally accurate to 0.5 - 2 meters, but accuracy improves to less than 10 cm after post-processing with Applanix POSPac (version 8.1).
  3. How accurate are the heights or depths?
    Vertical accuracy of the raw data based on system specifications may be approximately 1 percent of water depth (ranging from 0.06 to 0.45 meters based on the water depth range of approximately 6 to 45 meters within the survey area). The Applanix Wavemaster POS MV Attitude and Positioning system, used to correct for vessel roll, pitch, heave, and yaw, has a theoretical vertical accuracy of a few mm. Post-Processed Kinematic (PPK) GPS height corrections (from Applanix POSPac smoothed best estimate of trajectory (SBET) files) were used to reference soundings to the World Geodetic System 1984 (WGS 84) ellipsoid and remove water depth fluctuations in sea level during the survey. Four hundred thirty-nine sound speed profiles acquired with an AML MVP30 moving vessel profiler (MVP) or an AML Oceanographic MINOS X sound velocity profiler (SVP) were used during processing to minimize acoustic refraction artifacts in the bathymetry data. Changes in vessel draft due to water and fuel usage were not considered.
    Additionally, uncertainty associated with the vertical transformation of the bathymetric grid from WGS 84 (ITRF 2000) to mean lower low water (MLLW) using VDatum transformation tool (NOAA) is up to 7.1 cm as estimated by the VDatum in independent testing using data from Chesapeake Bay.
  4. Where are the gaps in the data? What is missing?
    Data were collected on the following dates: 20190801-20190829 (Julian day 213-241); bathymetry data from 20190801 (Julian day 213) and 20190827 (Julian day 239) includes data processed for performing the patch test to calibrate the multibeam sonar but these data were not incorporated into the final bathymetry dataset since the same area was re-occupied on subsequent survey days. Data collected during some turns and along lines that extend beyond the area of a continuous bathymetry data were also excluded.
  5. How consistent are the relationships among the observations, including topology?
    This grid represents processed dual-head Reson T20-P multibeam echo sounder (MBES) bathymetry data gridded at 5-m resolution. Quality control and data processing were conducted to remove spurious points and reduce sound speed artifacts (refraction) using Computer Aided Resource Information System (CARIS) Hydrographic Information Processing System (HIPS; version 11.3). Despite this processing, small areas of vessel motion and refraction artifacts remain in the data. Small "no data" gaps exist throughout the dataset. These are the result of editing the artifacts and, in some areas, eliminating low quality soundings. In addition, gaps exist in shallow areas where underwater obstructions created hazards for the safe navigation of the survey vessel.
    While navigation and attitude data in the bathymetry data and coincident backscatter data (see larger work citation https://doi.org/10.5066/P99DR4PN) are identical the extents of the processed bathymetry grid and backscatter mosaic differs slightly due to differences in processing. Cross lines, collected to check tide corrections in bathymetry data and to provide dip angle seismic profile data, were not added to this final bathymetry dataset.

How can someone get a copy of the data set?

Are there legal restrictions on access or use of the data?
Access_Constraints none
Use_Constraints Public domain data from the U.S. Government are freely distributable with proper metadata and source attribution. Please recognize the U.S. Geological Survey as the originator of the dataset. These data are not to be used for navigation.
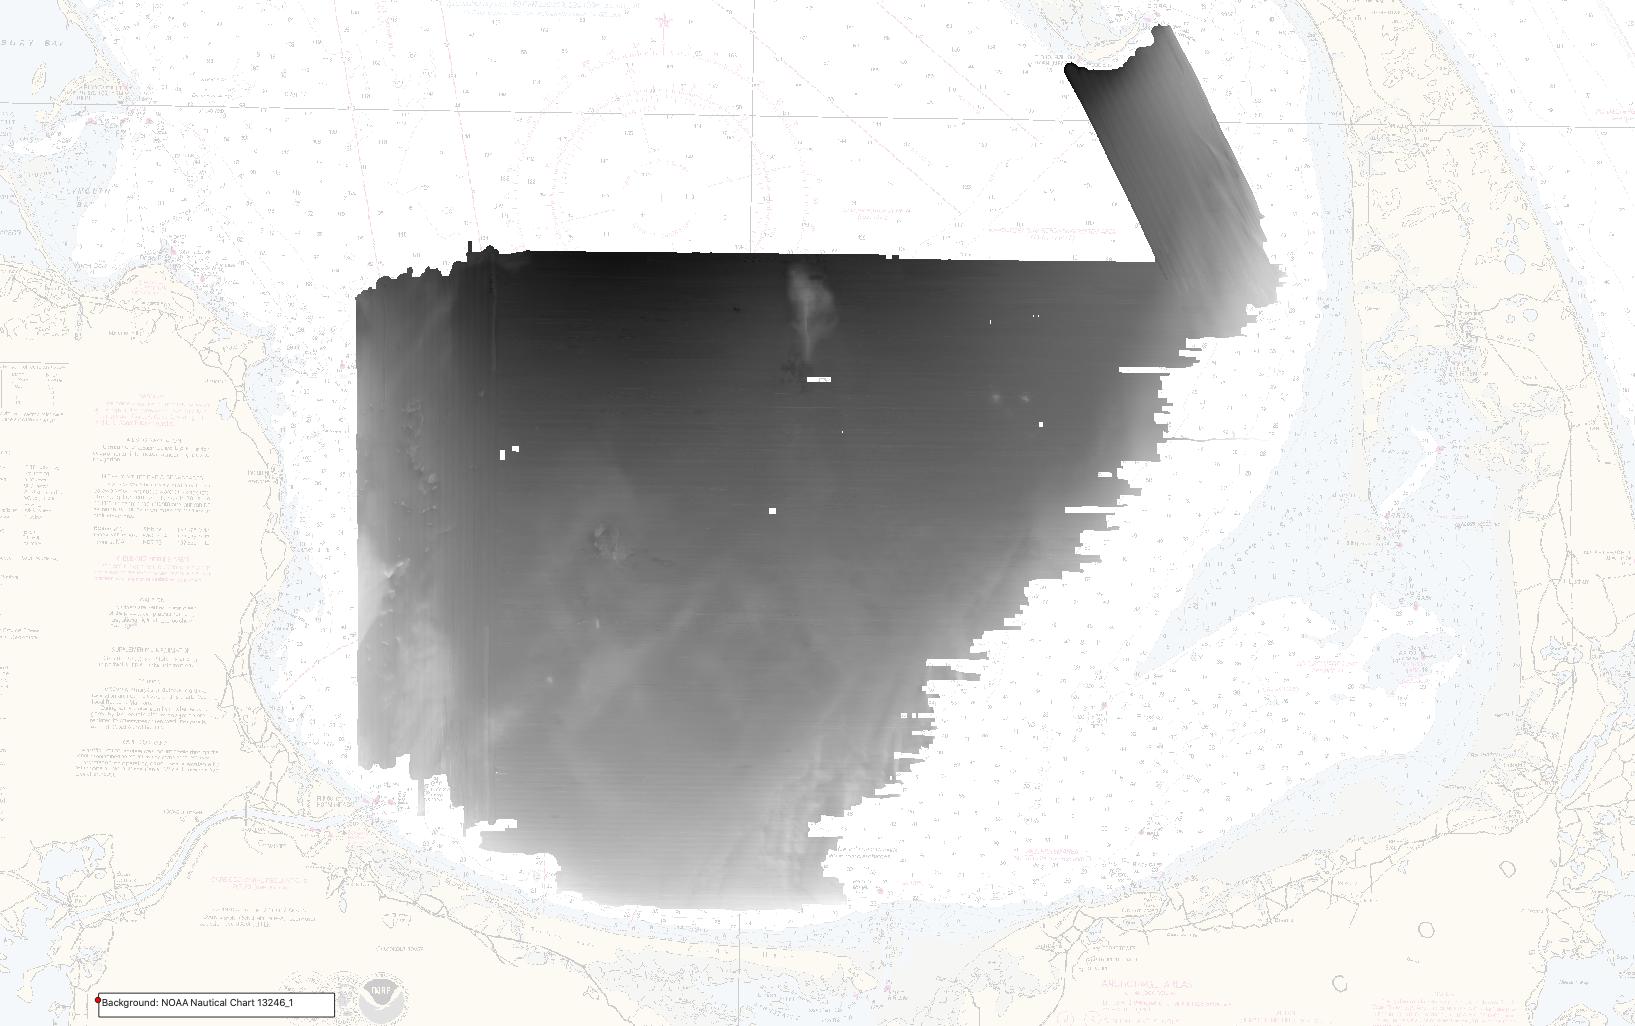
  1. Who distributes the data set? (Distributor 1 of 1)
    Seth Ackerman
    U.S. Geological Survey
    Geologist
    384 Woods Hole Rd.
    Woods Hole, MA
    USA

    508-548-8700 x2315 (voice)
    508-457-2310 (FAX)
    sackerman@usgs.gov
  2. What's the catalog number I need to order this data set? Multibeam echo sounder 5-m bathymetry data collected in Cape Cod Bay, Massachusetts during USGS Field Activity 2019-002-FA, using a dual-head Reson T20-P multibeam echo sounder: includes the GeoTIFF raster 2019-002-FA_T20P_Bathymetry_5m_MLLW.tif, world file 2019-002-FA_T20P_Bathymetry_5m_MLLW.tfw, the browse graphic 2019-002-FA_T20P_Bathymetry_5m_MLLW_browse.jpg, and Federal Geographic Data Committee (FGDC) Content Standards for Digital Geospatial Metadata (CSDGM) metadata files (2019-002-FA_T20P_Bathymetry_5m_MLLW_meta.xml).
  3. What legal disclaimers am I supposed to read?
    Neither the U.S. Government, the Department of the Interior, nor the USGS, nor any of their employees, contractors, or subcontractors, make any warranty, express or implied, nor assume any legal liability or responsibility for the accuracy, completeness, or usefulness of any information, apparatus, product, or process disclosed, nor represent that its use would not infringe on privately owned rights. The act of distribution shall not constitute any such warranty, and no responsibility is assumed by the USGS in the use of these data or related materials. Although these data and associated metadata have been reviewed for accuracy and completeness and approved for release by the U.S. Geological Survey (USGS), and have been processed successfully on a computer system at the USGS, no warranty expressed or implied is made regarding the display or utility of the data for other purposes, nor on all computer systems, nor shall the act of distribution constitute any such warranty. The USGS or the U.S. Government shall not be held liable for improper or incorrect use of the data described and/or contained herein. Any use of trade, firm, or product names is for descriptive purposes only and does not imply endorsement by the U.S. Government.
  4. How can I download or order the data?
  5. What hardware or software do I need in order to use the data set?
    To utilize these data, the user must have software capable of viewing GeoTIFF files.

Who wrote the metadata?

Dates:
Last modified: 16-Sep-2022
Metadata author:
Seth Ackerman
U.S. Geological Survey
Geologist
384 Woods Hole Rd.
Woods Hole, MA
USA

508-548-8700 x2315 (voice)
508-457-2310 (FAX)
sackerman@usgs.gov
Metadata standard:
Content Standards for Digital Geospatial Metadata (FGDC-STD-001-1998)

This page is <https://cmgds.marine.usgs.gov/catalog/whcmsc/DRB_data_release/DRB_P99DR4PN/2019-002-FA_T20P_Bathymetry_5m_MLLW_meta.faq.html>
Generated by mp version 2.9.51 on Mon Sep 19 09:45:24 2022