Online Links:
Online Links:
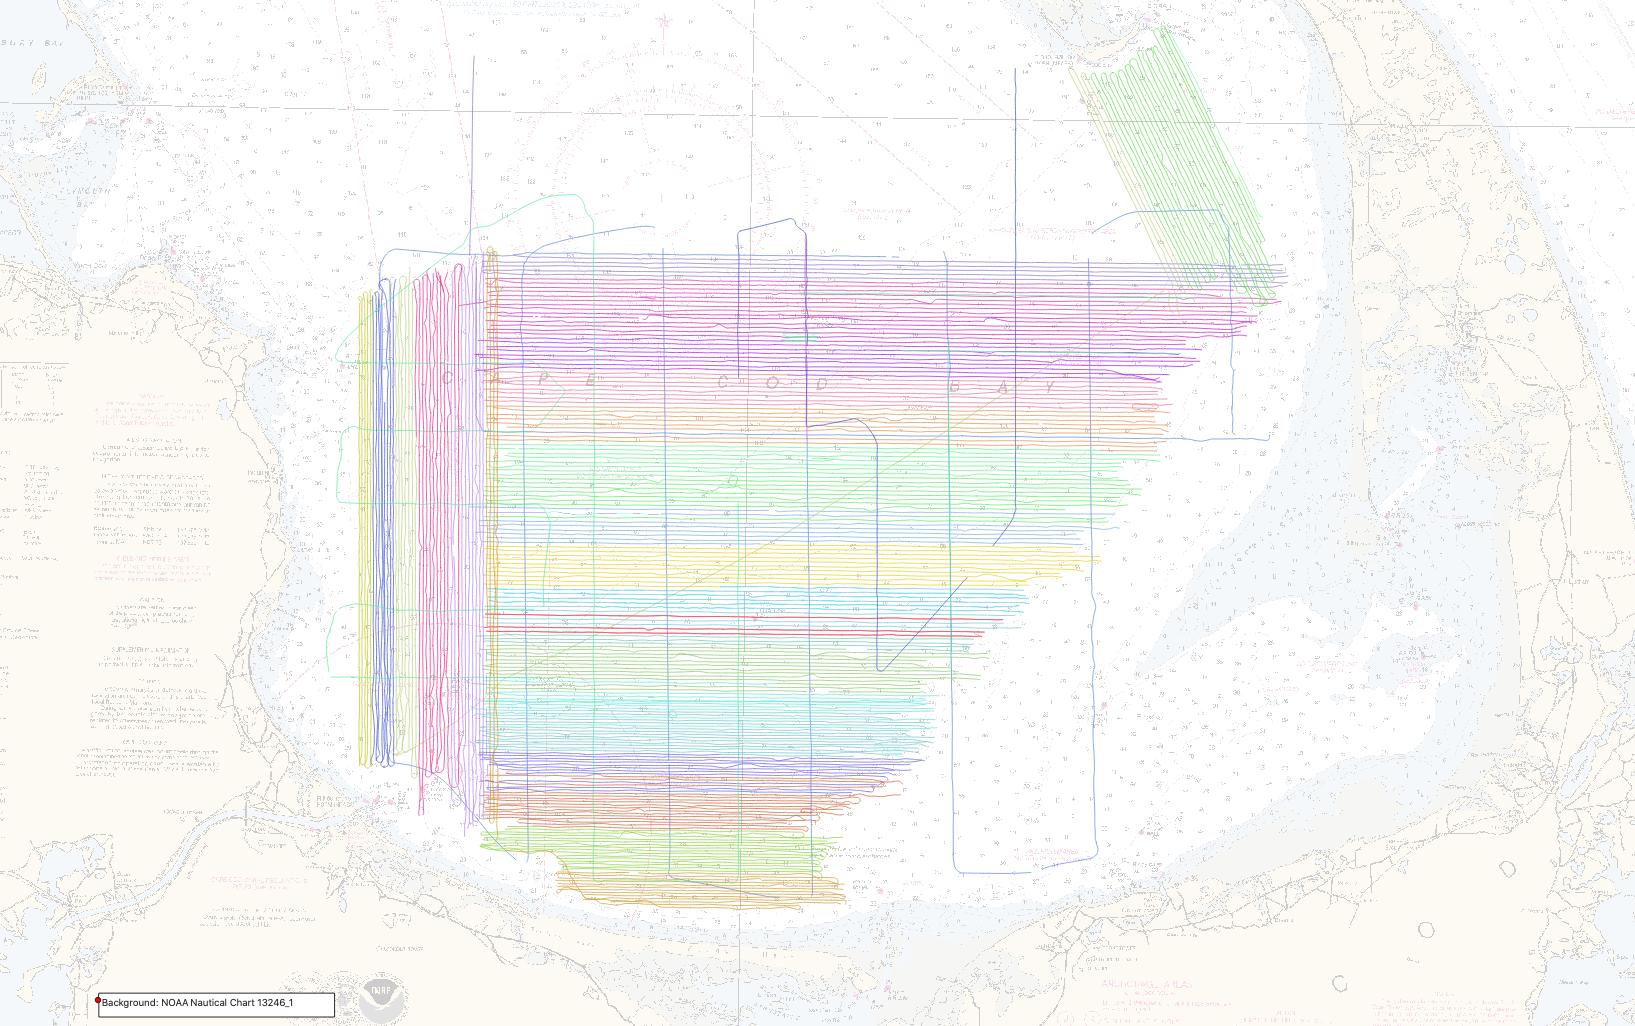
| Range of values | |
|---|---|
| Minimum: | 0.01 |
| Maximum: | 28.23 |
| Units: | kilometers |
| Resolution: | 0.01 |
Online Links:
Online Links:
Online Links:
| Access_Constraints | none |
|---|---|
| Use_Constraints | Public domain data from the U.S. Government are freely distributable with proper metadata and source attribution. Please recognize the U.S. Geological Survey as the originator of the dataset. |
| Data format: | Shapefile of MBES tracklines collected in Cape Cod Bay, Massachusetts during USGS Field Activity 2019-002-FA and the associated metadata. in format Shapefile (version QGIS (version 3.14)) Shapefile Size: 28 |
|---|---|
| Network links: |
https://cmgds.marine.usgs.gov/data-releases/media/2021/10.5066-P99DR4PN/e6da27c653284ada90de781ea52e5a10/2019-002-FA_T20P_Tracklines.zip https://cmgds.marine.usgs.gov/data-releases/datarelease/10.5066-P99DR4PN/ https://doi.org/10.5066/P99DR4PN |