Sea-floor videos and locations of bottom video tracklines collected in Cape Cod Bay, Massachusetts, in September 2019 by the U.S. Geological Survey during field activity 2019-034-FA (MP4 video files and polyline shapefile, GCS WGS 84)

Metadata also available as - [Outline] - [Parseable text] - [XML]

Frequently anticipated questions:


What does this data set describe?

Title:
Sea-floor videos and locations of bottom video tracklines collected in Cape Cod Bay, Massachusetts, in September 2019 by the U.S. Geological Survey during field activity 2019-034-FA (MP4 video files and polyline shapefile, GCS WGS 84)
Abstract:
Accurate data and maps of sea floor geology are important first steps toward protecting fish habitat, delineating marine resources, and assessing environmental changes due to natural or human impacts. To address these concerns the U.S. Geological Survey, in cooperation with the Massachusetts Office of Coastal Zone Management (CZM), comprehensively mapped the Cape Cod Bay sea floor to characterize the surface and shallow subsurface geologic framework. Geophysical data collected include swath bathymetry, backscatter, and seismic reflection profile data. Ground-truth data, including sediment samples, underwater video, and bottom photographs were also collected. This effort is part of a long-term collaboration between the USGS and the Commonwealth of Massachusetts to map the State's waters, support research on the Quaternary evolution of coastal Massachusetts, the influence of sea-level change and sediment supply on coastal evolution, and efforts to understand the type, distribution, and quality of subtidal marine habitats. This collaboration produces high-resolution geologic maps and Geographic Information System (GIS) data that serve the needs of research, management and the public. Data collected as part of this mapping cooperative continue to be released in a series of USGS Open-File Reports and Data Releases (https://www.usgs.gov/centers/whcmsc/science/geologic-mapping-massachusetts-seafloor). This data release provides the geophysical and geologic sampling data collected in Cape Cod Bay during USGS Field Activities 2019-002-FA and 2019-034-FA in 2019.
Supplemental_Information:
Support for 2019-034-FA was provided to the USGS from the Massachusetts Office of Coastal Zone Management. See the larger work citation to view the geotagged sea-floor images, locations of bottom images, and locations and grain-size analysis results of sediment samples collected during the survey, and to view the affiliated geophysical survey data collected during USGS field activity 2019-002-FA. For more information about the field activities associated with this project, see https://cmgds.marine.usgs.gov/fan_info.php?fan=2019-002-FA and https://cmgds.marine.usgs.gov/fan_info.php?fan=2019-034-FA.
  1. How might this data set be cited?
    Huntley, Emily C., 20220718, Sea-floor videos and locations of bottom video tracklines collected in Cape Cod Bay, Massachusetts, in September 2019 by the U.S. Geological Survey during field activity 2019-034-FA (MP4 video files and polyline shapefile, GCS WGS 84): data release DOI:10.5066/P99DR4PN, U.S. Geological Survey, Coastal and Marine Hazards and Resources Program, Woods Hole Coastal and Marine Science Center, Woods Hole, Massachusetts.

    Online Links:

    This is part of the following larger work.

    Ackerman, Seth D., Foster, David S., Andrews, Brian D., Danforth, William W., Baldwin, Wayne E., Huntley, Emily C., Worley, Charles R., and Brothers, Laura L., 2022, High-resolution geophysical and geological data collected in Cape Cod Bay, Massachusetts during USGS Field Activities 2019-002-FA and 2019-034-FA: data release DOI:10.5066/P99DR4PN, U.S. Geological Survey, Reston, VA.

    Online Links:

    Other_Citation_Details:
    Suggested citation: Ackerman, S.D., Foster, D.S., Andrews, B.D., Danforth, W.W., Baldwin, W.E., Huntley, E.C., Worley, C.R., and Brothers, L.L., 2022, High-resolution geophysical and geological data collected in Cape Cod Bay, Massachusetts during USGS Field Activities 2019-002-FA and 2019-034-FA: U.S. Geological Survey data release, https://doi.org/10.5066/P99DR4PN.
  2. What geographic area does the data set cover?
    West_Bounding_Coordinate: -70.493252
    East_Bounding_Coordinate: -70.135025
    North_Bounding_Coordinate: 42.012814
    South_Bounding_Coordinate: 41.752842
  3. What does it look like?
    https://cmgds.marine.usgs.gov/data-releases/media/2021/10.5066-P99DR4PN/a9c3c4ccf8194b7790f04e329f5ba551/2019-034-FA_videos_browse.jpg (JPEG)
    Map of sea-floor video tracklines in the survey area in Cape Cod Bay, Massachusetts.
  4. Does the data set describe conditions during a particular time period?
    Beginning_Date: 17-Sep-2019
    Ending_Date: 19-Sep-2019
    Currentness_Reference:
    Data were collected on the following dates: 20190917 and 20190919.
  5. What is the general form of this data set?
    Geospatial_Data_Presentation_Form: video and vector digital data
  6. How does the data set represent geographic features?
    1. How are geographic features stored in the data set?
      This is a Vector data set. It contains the following vector data types (SDTS terminology):
      • String (50)
    2. What coordinate system is used to represent geographic features?
      Horizontal positions are specified in geographic coordinates, that is, latitude and longitude. Latitudes are given to the nearest 0.000001. Longitudes are given to the nearest 0.000001. Latitude and longitude values are specified in Decimal degrees. The horizontal datum used is D_WGS_1984.
      The ellipsoid used is WGS_1984.
      The semi-major axis of the ellipsoid used is 6378137.000000.
      The flattening of the ellipsoid used is 1/298.257224.
  7. How does the data set describe geographic features?
    2019-034-FA_videos.shp
    Shapefile of tracklines for sea-floor videos collected in Cape Cod Bay, Massachusetts, in September 2019 during USGS field activity 2019-034-FA (50 polyline features). Bottom videos are also included in this dataset; see the Entity and Attribute Overview section for a description of the MP4 videos. (Source: U.S. Geological Survey)
    FID
    Internal feature number. (Source: Esri) Sequential unique whole numbers that are automatically generated.
    Shape
    Feature geometry. (Source: Esri) Coordinates defining the features.
    FIELD_NO
    Site number as assigned in the field. (Source: U.S. Geological Survey) String used to distinguish site numbers.
    LINENAME
    Name of bottom video used to uniquely identify between surveys, cameras, and video files: e.g., 2019034FA_SeaViewer_20190917T140258Z_CLIP0000287.mp4 where 2019034FA refers to the field activity identifier, SeaViewer refers to the camera, 20190917T140258Z refers to the date and start time in the ISO 8601 standard (YYYYMMDD T [time separator] HHMMSS Z [Zulu/UTC time]), and CLIP0000287 refers to the sequential video number assigned to the video by the camera. (Source: U.S. Geological Survey) String used to distinguish bottom videos.
    STARTTIME
    Start time of the bottom video drift in UTC in the format HH:MM:SS. (Source: U.S. Geological Survey) String used to distinguish UTC start times of the bottom video.
    ENDTIME
    End time of the bottom video drift in UTC in the format HH:MM:SS. (Source: U.S. Geological Survey) String used to distinguish UTC end times of the bottom video.
    JD
    Julian day that the bottom video was collected based on UTC time; Julian day is the integer number representing the interval of time in days since January 1 of the year. (Source: U.S. Geological Survey)
    Range of values
    Minimum:260
    Maximum:262
    Units:Julian days
    Resolution:1
    DATE
    Date based on UTC time that the bottom video was collected in the format YYYYMMDD. (Source: U.S. Geological Survey) String used to distinguish dates.
    YEAR
    Year that the bottom video was collected. (Source: U.S. Geological Survey)
    Range of values
    Minimum:2019
    Maximum:2019
    Units:years
    Resolution:1
    LENGTH_M
    Length in meters of the bottom video trackline. Length was calculated in WGS 84 UTM Zone 19N. (Source: U.S. Geological Survey)
    Range of values
    Minimum:4.8
    Maximum:191.8
    Units:meters
    Resolution:0.1
    CAMERA
    Camera used to collect bottom video. (Source: U.S. Geological Survey) String used to distinguish between different camera models mounted on the sampling system; however, for this survey, only one camera was used to collect bottom video.
    FA_ID
    Serial number assigned to the field activity during which the bottom video was collected. This value is in the format YYYY-XXX-FA where YYYY is the survey year, XXX is the number assigned to the activity within that year, and FA indicates Field Activity. (Source: U.S. Geological Survey) String used to distinguish field activities by year and ID number.
    DEVICE_ID
    Sampling device used to collect the bottom video. (Source: U.S. Geological Survey) String used to identify the sampling configuration used during the survey.
    VEHICLE_ID
    Vehicle (ship) used to collect data during the field activity. (Source: U.S. Geological Survey) String used to identify the survey vessel.
    2019-034-FA_videos
    Sea floor videos collected in Cape Cod Bay, Massachusetts, in September 2019 during USGS field activity 2019-034-FA (50 video files in mp4 format). See LINENAME definition above for description of the filenaming convention. (Source: U.S. Geological Survey)
    Entity_and_Attribute_Overview:
    This dataset contains 50 MP4 videos of the sea floor from a SeaViewer 6000 HD Sea-Drop video camera collected in Cape Cod Bay, Massachusetts, in September 2019 during USGS field activity 2019-034-FA and a shapefile of the bottom video trackline locations (see the Detailed Description section above for definitions of the shapefile attributes).
    Entity_and_Attribute_Detail_Citation: U.S. Geological Survey

Who produced the data set?

  1. Who are the originators of the data set? (may include formal authors, digital compilers, and editors)
    • Emily C. Huntley
  2. Who also contributed to the data set?
    The authors acknowledge our fellow participants of the Cape Cod Bay field activities 2019-002-FA (Walter Barnhardt, Luke Bennett, Eric Moore, Alex Nichols, Jake Fredericks, and Dan Kennedy) and 2019-034-FA (Dann Blackwood, Eric Moore, and Alex Nichols); the crew of the M/V Warren Jr and the R/V Tioga; and our sea floor mapping group onshore support team during these surveys (Jane Denny, PJ Bernard, Barry Irwin, and Emile Bergeron).
  3. To whom should users address questions about the data?
    Seth Ackerman
    U.S. Geological Survey
    Geologist
    384 Woods Hole Rd.
    Woods Hole, MA
    USA

    508-548-8700 x2315 (voice)
    508-457-2310 (FAX)
    sackerman@usgs.gov

Why was the data set created?

This dataset provides access to the sea-floor videos and their locations of bottom videos acquired with a SeaViewer 6000 HD Sea-Drop video camera on the Mini SEABed Observation and Sampling System (MiniSEABOSS) aboard the Research Vessel (R/V) Tioga during USGS field activity 2019-034-FA (September 17 and 19, 2019). These data were collected to characterize the sea floor by identifying sediment texture and to ground-truth acoustic data collected during USGS field activity 2019-002-FA. Bottom videos serve as a means to visually classify grain size and identify sea-floor habitats, and they are especially important for sample sites where no physical sediment sample was collected.

How was the data set created?

  1. From what previous works were the data drawn?
  2. How were the data generated, processed, and modified?
    Date: 19-Sep-2019 (process 1 of 6)
    Step 1: Collected data.
    A marine geological survey (field activity 2019-034-FA) was conducted in Cape Cod Bay, Massachusetts, in September 2019. The R/V Tioga occupied one of the target sites, and the MiniSEABOSS was deployed off the vessel's A-frame on the stern of the ship. The MiniSEABOSS was equipped with a modified Van Veen grab sampler, a GoPro HERO4 Black digital camera, an oblique downward-looking SeaViewer 6000 HD Sea-Drop video camera with a topside feed, a Paralenz DiveCamera+ recording backup video, and a dive light to illuminate the sea floor for video and photograph collection. The elements of this particular MiniSEABOSS were held within a stainless-steel frame that measured ~1 x 1 meter. The frame had a stabilizer fin that oriented the system as it drifted over the seabed. Two red lasers were set 20 centimeters apart (both as they were mounted on the MiniSEABOSS frame and as seen in photographs and video on the seabed) for scale measurements. The red laser dots can usually be seen in the sea-floor photos and videos depending on the bottom type and distance to the sea floor. The winch operator lowered the MiniSEABOSS until the sea floor was observed in the topside live video feed. Generally, the vessel and MiniSEABOSS drifted with wind and current for up to a few minutes to ensure a decent photo with a clear view of the sea floor was acquired. The GoPro camera was set to take photos every 2 seconds during a MiniSEABOSS deployment. Bottom video was also recorded during the drift from the oblique downward-looking SeaViewer 6000 HD Sea-Drop video camera directly to a solid-state drive using an Odyssey7 video recorder. Then, the winch operator lowered the Van Veen grab sampler until it rested on the sea floor. When the system was raised, the Van Veen grab sampler closed and collected a sample as it was lifted off the sea floor. The sampler was recovered to the deck of the survey vessel where a subsample was taken for grain-size analysis at the sediment laboratory at the USGS Woods Hole Coastal and Marine Science Center. During the survey, DGPS navigation from a Hemisphere R131 DGPS receiver was logged through a DataBridge data logger and QGIS (version 3.0.0) GPS Tools. The DGPS was set to receive fixes at a 1-second interval in geographic coordinates (WGS 84). Dates and times were recorded in Coordinated Universal Time (UTC). Log files were saved for each Julian day in NMEA text format. The GPS data were also overlaid onto the SeaViewer video using a Proteus-V Pro video overlay device. A total of 49 sites were occupied aboard the R/V Tioga with the MiniSEABOSS during field activity 2019-034-FA, and bottom videos were collected at all 49 sites. Person who carried out this activity:
    Seth Ackerman
    U.S. Geological Survey
    Geologist
    384 Woods Hole Rd.
    Woods Hole, MA
    USA

    508-548-8700 x2315 (voice)
    508-457-2310 (FAX)
    sackerman@usgs.gov
    Data sources produced in this process:
    • Original bottom videos
    • Raw navigation data
    Date: 23-Nov-2020 (process 2 of 6)
    Step 2: Processed video files.
    A shell script (do_concat.sda) was run on the original video files to concatenate the video clips for each site as needed (the Odyssey7 splits clips into less than 4 GB segments) and convert the video files to MP4 files using FFmpeg. The script also created a text file with the start time and duration of each video recording. Person who carried out this activity:
    Seth Ackerman
    U.S. Geological Survey
    Geologist
    384 Woods Hole Rd.
    Woods Hole, MA
    USA

    508-548-8700 x2315 (voice)
    508-457-2310 (FAX)
    sackerman@usgs.gov
    Data sources used in this process:
    • Original bottom videos
    Data sources produced in this process:
    • Concatenated MP4 bottom video files
    • Start times/durations text file
    Date: Dec-2020 (process 3 of 6)
    Step 3: Processed navigation.
    To process the NMEA navigation data, GPSBabel (version 1.7.0) was used to read the GPRMC navigation sentences from the NMEA log files, translate them to waypoints, and write the waypoints to a GPX XML file (nmea_nav_jd260_jd262.gpx). The GPX file was then converted to a shapefile in QGIS (version 3.10.9). New fields for the latitude and longitude were added to the shapefile and calculated to six decimal places. The shapefile was exported as a Comma Separated Values (CSV) text file, which was then formatted in Microsoft Excel for Mac (version 16.16), creating a processed NMEA navigation CSV file for the survey (nmea_nav_jd260_jd262.csv).
    Due to an issue with the data logger, the raw navigation data were recorded to NMEA files for only 22 of the 50 sampler deployments. For the remaining 28 deployments, the latitude and longitude recorded on the video overlay were used for the navigation data. To obtain the navigation data from the overlay, first, a command was run to extract a still-image frame grab every 1 second from the videos using FFmpeg (version 4.3.1). Next, a command was run to crop the latitude from each frame grab. The cropped image of the latitude was then converted to text using the optical character recognition engine Tesseract (version 4.1.1) and saved as a text file. These commands were repeated to crop the longitude from each frame grab and convert it to text, and then again to crop and convert the time to text. All the latitude, longitude, and time text files were concatenated and merged into a single text file. This text file was then imported and formatted in Microsoft Excel for Mac, creating a processed video overlay navigation CSV file for the survey (videocrop_coords_and_times.csv). The video overlay navigation data were checked to see if any times were missing. Occasionally, frame grabs were not extracted for the first or last second of the video. These missing frame grabs were identified, and the navigation data from the missing frame grabs were added to the video overlay navigation CSV file.
    Shapefiles of the NMEA and video overlay navigation CSV files were created in ArcGIS (version 10.7.1). The sites with no NMEA navigation were identified, and the video overlay navigation data for those sites were exported as a table. The exported table was added to the NMEA navigation in Microsoft Excel for Mac and saved as a CSV file, creating a final navigation file for the survey (nmea_and_videocrop_nav.csv). This process step and the subsequent process steps were performed by the same person, Emily Huntley. Person who carried out this activity:
    Emily Huntley
    U.S. Geological Survey
    Geographer/Database Specialist
    384 Woods Hole Rd.
    Woods Hole, MA
    USA

    508-548-8700 (voice)
    508-457-2310 (FAX)
    ehuntley@contractor.usgs.gov
    Data sources used in this process:
    • Raw navigation data
    • Concatenated MP4 bottom video files
    Data sources produced in this process:
    • Final navigation file
    Date: Dec-2020 (process 4 of 6)
    Step 4: Trimmed and renamed video files.
    The videos were prepared for publication. First, videos used for camera calibration or less than 1 second were removed. Next, the bottom videos were trimmed as needed using FFmpeg (version 4.3.1). For the first survey day (Julian day 260), the videos were trimmed to the duration that the camera was within view of the sea floor if more than about 20 seconds of sampler retrieval was originally recorded. For the second survey day (Julian day 262), both the sampler deployment and retrieval were recorded, so all the videos were trimmed to the duration that the camera was within view of the sea floor. One site (site 2019-034-FA-034) had one continuous video of two separate deployments, so the video was split into two videos and trimmed to the duration that the camera was within view of the sea floor. Finally, the videos were renamed using a shell script to include the field activity identifier, camera, and date and start time in the ISO 8601 standard (YYYYMMDD T [time separator] HHMMSS Z [Zulu/UTC time]) in the filename. Data sources used in this process:
    • Concatenated MP4 bottom video files
    Data sources produced in this process:
    • Final MP4 bottom video files
    Date: Dec-2020 (process 5 of 6)
    Step 5: Created a CSV file of the bottom video trackline points.
    The text file with the start time and duration of each video recording and the final navigation data were prepared for the video trackline script. Since the videos were trimmed, the start time and duration of each video was checked and corrected as needed in the start times/durations text file. Then, the fields in the final navigation CSV text file were reordered and formatted to be used with the video trackline script. Finally, a Jupyter Notebook Python script (Video_trackline_prep_WORKING_v2.ipynb) was run to create a CSV file of the bottom video trackline points by extracting the navigation data for each video drift using information from the start times/durations text file. The script reads the video start time and duration from the text file, calculates the video end time, extracts the navigation points that fall within those start and end times, and exports the navigation points to a CSV file. Data sources used in this process:
    • Start times/durations text file
    • Final navigation file
    Data sources produced in this process:
    • Bottom video trackline points CSV file
    Date: Dec-2020 (process 6 of 6)
    Step 6: Created the final bottom video tracklines shapefile.
    A point shapefile was created using the bottom video trackline points CSV files in Esri ArcGIS Pro (version 2.4.1). The Points to Line tool was then run with the video trackline points as the input features and the video filenames as the line field to create a polyline shapefile of the video tracklines. New fields were added to the polyline shapefile, including an attribute for the site number of the video trackline (FIELD_NO), bottom video filename (LINENAME), start time of the bottom video drift in UTC (STARTTIME), end time of the video drift in UTC (ENDTIME), Julian day of collection (JD), date of collection (DATE), year of collection (YEAR), trackline length in meters (LENGTH_M), camera used (CAMERA), field activity identifier (FA_ID), sampling device used to collect the video (DEVICE_ID), and survey vessel (VEHICLE_ID). The bottom video tracklines shapefile was joined with the trackline points shapefile to add the start and end times of the video drifts (STARTTIME and ENDTIME, respectively), Julian day of collection (JD), and date of collection (DATE). The tracklines shapefile was joined with the survey log to assign the site number (FIELD_NO) of each video trackline. The trackline length (LENGTH_M) was calculated using the Calculate Geometry Attributes tool (Property=Length; Length Unit=Meters; Coordinate System=WGS 1984 UTM Zone 19N). Data sources used in this process:
    • Bottom video trackline points CSV file
    • Survey log
    Data sources produced in this process:
    • Final bottom video tracklines shapefile
  3. What similar or related data should the user be aware of?
    Pendleton, E.A., Baldwin, W.E., Barnhardt., W.A., Ackerman, S.D., Foster, D.S., Andrews, B.D., and Schwab, W.C., 2013, Shallow Geology, Sea-floor Texture, and Physiographic Zones of the Inner Continental Shelf from Nahant to Northern Cape Cod Bay, Massachusetts: Open-File Report 2012-1157, U.S. Geological Survey, Coastal and Marine Geology Program, Woods Hole Coastal and Marine Science Center, Woods Hole, MA.

    Online Links:

    Andrews, B.D., Ackerman, S.D., Baldwin, W.E., and Barnhardt, W.A., 2010, Geophysical and Sampling Data from the Inner Continental Shelf: Northern Cape Cod Bay, Massachusetts: Open-File Report 2010-1006, U.S. Geological Survey, Coastal and Marine Geology Program, Woods Hole Coastal and Marine Science Center, Woods Hole, MA.

    Online Links:

    Ackerman, Seth D., Foster, David S., Danforth, William W., and Huntley, Emily C., 2019, High-resolution geophysical and sampling data collected off Town Neck Beach in Sandwich, Massachusetts, 2016: data release DOI:10.5066/P9HZHXXV, U.S. Geological Survey, Reston, VA.

    Online Links:

    Other_Citation_Details:
    Suggested citation: Ackerman S.D., Foster D.S., Danforth W.W., and Huntley, E.C., 2019, High-resolution geophysical and sampling data collected off Town Neck Beach in Sandwich, Massachusetts, 2016: U.S. Geological Survey data release, https://doi.org/10.5066/P9HZHXXV.

How reliable are the data; what problems remain in the data set?

  1. How well have the observations been checked?
    The videos have an overlay of the latitude, longitude, Global Positioning System (GPS) time, date, and site number. The site number is only included for sites 2019-034-FA-006 through 2019-034-FA-049, so the first five videos (clips 287 through 293) do not have the site number in the overlay. The site number on the video overlay does not include "-FA" (e.g., site 2019-034-FA-006 is shown as 2019-034-006). For the second survey day, the site number on the video overlay has underscores instead of dashes (clips 309 through 340). One video, clip 307 (2019034FA_SeaViewer_20190917T205140Z_CLIP0000307.mp4), has the incorrect site number on the overlay for the first 23 seconds before it was corrected (it should be 2019-034-018). The end time of the video drift used to map the bottom video tracklines (field ENDTIME in the shapefile) was originally calculated using the video start time and duration. The end time was assessed for accuracy by comparing it with the GPS time overlay on the video's last frame. Two videos (clips 290 and 303) were 1 second longer than the video trackline and trimmed, and one video (clip 322) was 1 second shorter than the video trackline, so the trackline was edited and shortened to match the video end time.
  2. How accurate are the geographic locations?
    Differential Global Positioning System (DGPS) navigation was used during field activity 2019-034-FA. The DGPS was set to receive fixes at a 1-second interval in geographic coordinates (Geographic Coordinate System [GCS] World Geodetic System of 1984 [WGS 84]). Due to an issue with the data logger, the raw navigation data were recorded to National Marine Electronics Association (NMEA) files for only 22 of the 50 sampler deployments (sites 2019-034-FA-009 through 2019-034-FA-018 and 2019-034-FA-023 through the first deployment at 2019-034-FA-034). For the remaining 28 deployments (sites 2019-034-FA-001 through 2019-034-FA-008, 2019-034-FA-019 through 2019-034-FA-022, and the second deployment at 2019-034-FA-034 through 2019-034-FA-049), the latitude and longitude recorded on the video overlay were used for the navigation data. Due to rounding differences, the navigation recorded to the NMEA files and the video overlay may differ by up to 1 meter. The recorded position of each point along the video trackline is the position of the DGPS antenna on the survey vessel, located on the aft port side of the R/V Tioga on the rail near the A-frame, not the location of the MiniSEABOSS. The antenna was located approximately 4 meters from the MiniSEABOSS deployment location. No layback or offset was applied to the recorded position. In addition, the MiniSEABOSS may drift away from the survey vessel when deployed to the sea floor. Based on the various sources of horizontal offsets, a conservative estimate of the horizontal accuracy of the video trackline locations is 5-7 meters. At times the ship was moving so slowly that the resolution of the DGPS makes a trackline appear to double back on itself.
  3. How accurate are the heights or depths?
  4. Where are the gaps in the data? What is missing?
    This dataset includes bottom videos in MP4 format and a trackline shapefile of the location of the ship for the duration of the video collected during field activity 2019-034-FA. Forty-nine sites were occupied within the study area, and bottom videos were acquired at all 49 sites. Five videos acquired are not included in this publication: one of these videos was less than 1 second (clip 296) and four were used for camera calibration (clips 288, 289, 308, and 310). For the first survey day (Julian day 260), the videos were trimmed to the duration that the camera was within view of the sea floor if more than about 20 seconds of sampler retrieval was originally recorded. For the second survey day (Julian day 262), both the sampler deployment and retrieval were recorded, so all the videos were trimmed to the duration that the camera was within view of the sea floor. One site (site 2019-034-FA-034) had two separate deployments because a sediment grab was not successfully collected during the first deployment; one continuous video of both deployments (clip 325) was split into two videos and trimmed to the duration that the camera was within view of the sea floor. This dataset includes 50 videos with a total duration of 1 hour 31 minutes and 50 video tracklines with a total length of 2.1 kilometers.
  5. How consistent are the relationships among the observations, including topology?
    All bottom videos were acquired using a SeaViewer 6000 HD Sea-Drop video camera on the MiniSEABOSS. Each site usually had only one deployment of the sampler; however, one site (site 2019-034-FA-034) had two separate deployments because a sediment grab was not successfully collected during the first deployment. One continuous video of both deployments (clip 325) was taken at site 2019-034-FA-034; it was split into two videos and trimmed to the duration that the camera was within view of the sea floor. Gaps in sequential clip numbers exist because test videos were not mapped. The tracklines may self-intersect or self-overlap; at times the ship was moving so slowly that the resolution of the GPS makes a trackline appear to double back on itself.

How can someone get a copy of the data set?

Are there legal restrictions on access or use of the data?
Access_Constraints None
Use_Constraints Public domain data from the U.S. Government are freely redistributable with proper metadata and source attribution. Please recognize the U.S. Geological Survey as the originator of the dataset.
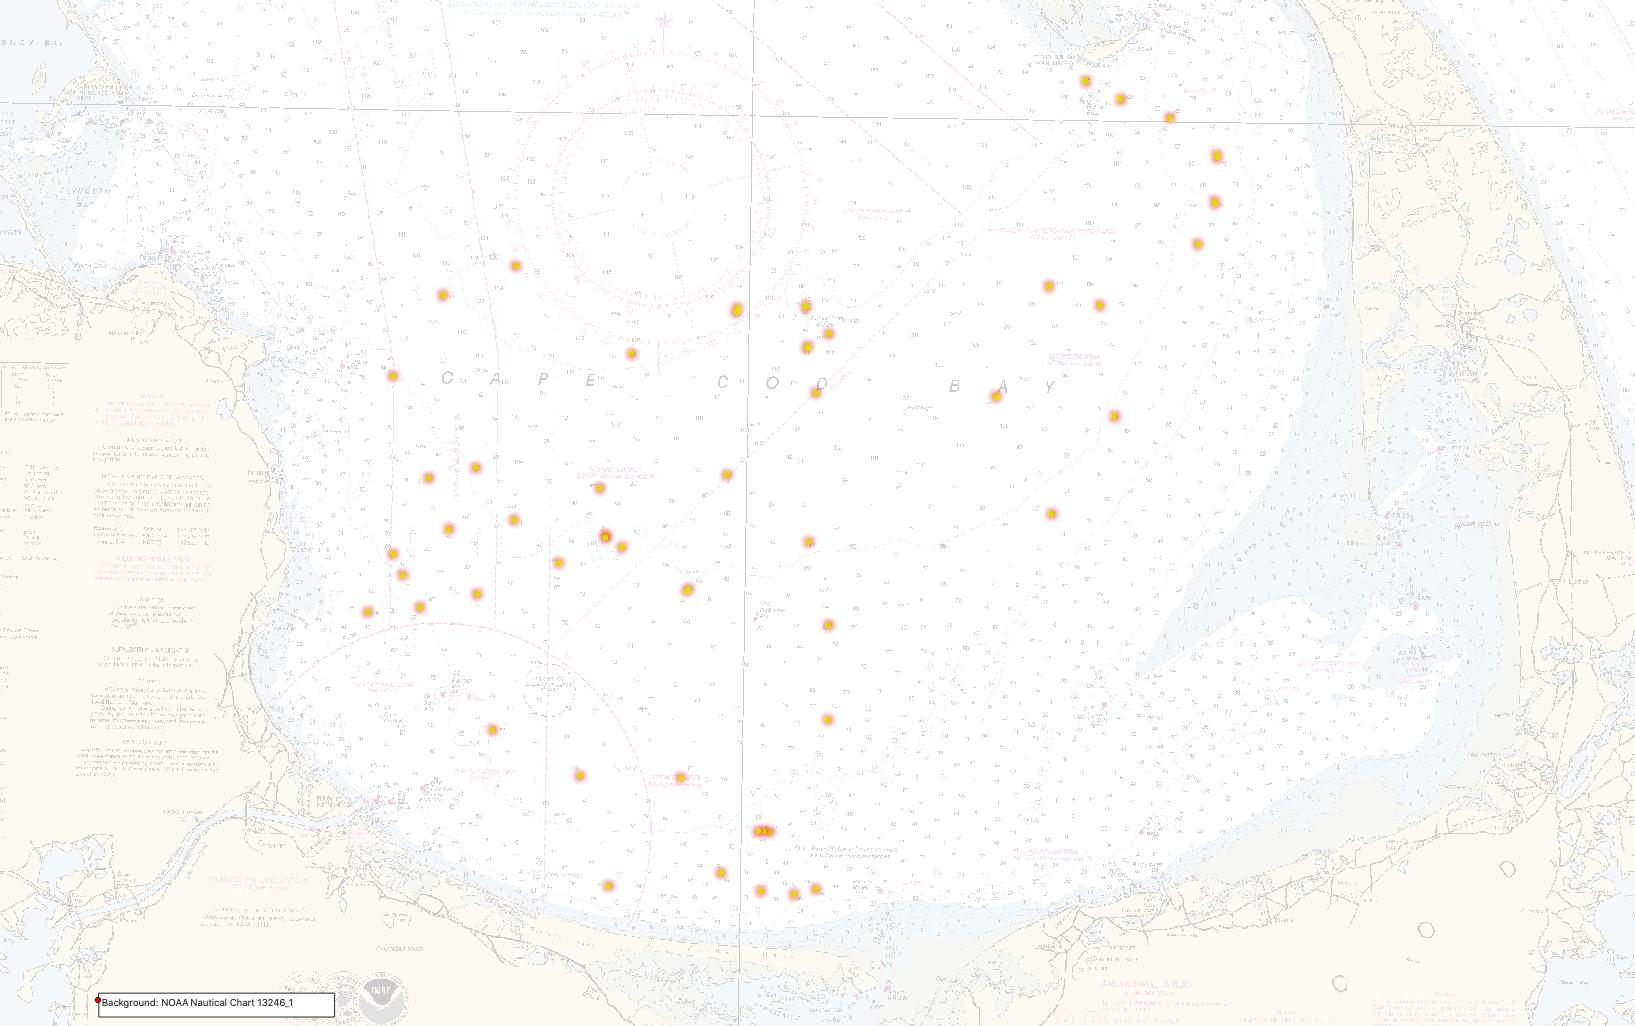
  1. Who distributes the data set? (Distributor 1 of 1)
    Seth Ackerman
    U.S. Geological Survey
    Geologist
    384 Woods Hole Rd.
    Woods Hole, MA
    USA

    508-548-8700 x2315 (voice)
    508-457-2310 (FAX)
    sackerman@usgs.gov
  2. What's the catalog number I need to order this data set? Sea-floor videos and locations of bottom video tracklines collected in Cape Cod Bay, Massachusetts, in September 2019 by the U.S. Geological Survey during field activity 2019-034-FA. This dataset contains the following files: a shapefile of the bottom video trackline locations (2019-034-FA_videos.shp); 50 sea floor videos in mp4 format from the SeaViewer 6000 HD Sea-Drop video camera; a browse graphic of bottom video trackline locations (2019-034-FA_videos_browse.jpg); and Federal Geographic Data Committee (FGDC) Content Standard for Digital Geospatial Metadata (CSDGM) metadata files in two standard formats (2019-034-FA_videos_meta.txt and 2019-034-FA_videos_meta.xml).
  3. What legal disclaimers am I supposed to read?
    Neither the U.S. Government, the Department of the Interior, nor the USGS, nor any of their employees, contractors, or subcontractors, make any warranty, express or implied, nor assume any legal liability or responsibility for the accuracy, completeness, or usefulness of any information, apparatus, product, or process disclosed, nor represent that its use would not infringe on privately owned rights. The act of distribution shall not constitute any such warranty, and no responsibility is assumed by the USGS in the use of these data or related materials. Any use of trade, product, or firm names is for descriptive purposes only and does not imply endorsement by the U.S. Government.
  4. How can I download or order the data?
  5. What hardware or software do I need in order to use the data set?
    This dataset contains data available as a polyline shapefile and MP4 video files. The user must have software capable of reading shapefile format to use the polyline shapefile. A video viewer can be used to see the MP4 video files.

Who wrote the metadata?

Dates:
Last modified: 18-Jul-2022
Metadata author:
Emily Huntley
U.S. Geological Survey
Geographer/Database Specialist
384 Woods Hole Rd.
Woods Hole, MA
USA

508-548-8700 (voice)
508-457-2310 (FAX)
ehuntley@contractor.usgs.gov
Metadata standard:
Content Standard for Digital Geospatial Metadata (FGDC-STD-001-1998)

This page is <https://cmgds.marine.usgs.gov/catalog/whcmsc/DRB_data_release/DRB_P99DR4PN/2019-034-FA_videos_meta.faq.html>
Generated by mp version 2.9.51 on Mon Sep 19 09:45:25 2022