Multibeam backscatter data collected during USGS Field Activity 2021-004-FA, using a dual-head Teledyne SeaBat T20-P multibeam echo sounder (8-bit GeoTIFF, UTM Zone 19N, WGS84, 1-m resolution)

Metadata also available as - [Outline] - [Parseable text] - [XML]

Frequently anticipated questions:


What does this data set describe?

Title:
Multibeam backscatter data collected during USGS Field Activity 2021-004-FA, using a dual-head Teledyne SeaBat T20-P multibeam echo sounder (8-bit GeoTIFF, UTM Zone 19N, WGS84, 1-m resolution)
Abstract:
The U.S. Geological Survey (USGS) Woods Hole Coastal and Marine Science Center (WHCMSC) completed a bathymetric and shallow seismic-reflection survey during the period of June 9, 2021 to June 24, 2021 in water depths from 2 m to 30 m for a portion of the outer Cape Cod nearshore environment between Marconi and Nauset Beaches. The products from this survey will help to support white shark research on their shallow-water behavior in the dynamic nearshore environment at Cape Cod National Seashore (CACO). CACO visitors’ safety is threatened by interactions between the public and white sharks. This project provides CACO with baseline data and information on nearshore white shark habitat, specifically in the nearshore shoreface, bathymetric trough, and longshore bar. This data release provides the geophysical data collected from outer Cape Cod during USGS Field Activities 2021-002-FA in 2021.
Supplemental_Information:
Support for 2021-004-FA was provided to the USGS from the National Park Service, Cape Cod National Seashore. Additional information on the field activities associated with this project are available at https://cmgds.marine.usgs.gov/fan_info.php?fan=2021-004-FA
  1. How might this data set be cited?
    Ackerman, Seth D., 20231114, Multibeam backscatter data collected during USGS Field Activity 2021-004-FA, using a dual-head Teledyne SeaBat T20-P multibeam echo sounder (8-bit GeoTIFF, UTM Zone 19N, WGS84, 1-m resolution): data release DOI:10.5066/P9GO90TI, U.S. Geological Survey, Coastal and Marine Hazards and Resources Program, Woods Hole Coastal and Marine Science Center, Woods Hole, Massachusetts.

    Online Links:

    This is part of the following larger work.

    Ackerman, Seth D., Foster, David S., Worley, Charles R., and Nichols, Alexander R., 2023, High-resolution geophysical and geological data collected from outer Cape Cod, Massachusetts during USGS Field Activity 2021-004-FA: data release DOI:10.5066/P9GO90TI, U.S. Geological Survey, Reston, VA.

    Online Links:

    Other_Citation_Details:
    Suggested citation: Ackerman, S.D., Foster, D.S., Worley, C.R., and Nichols, A.R., 2023, High-resolution geophysical and geological data collected from outer Cape Cod, Massachusetts during USGS Field Activity 2021-004-FA: U.S. Geological Survey data release, https://doi.org/10.5066/P9GO90TI.
  2. What geographic area does the data set cover?
    West_Bounding_Coordinate: -69.98096
    East_Bounding_Coordinate: -69.91185
    North_Bounding_Coordinate: 41.94450
    South_Bounding_Coordinate: 41.78170
  3. What does it look like?
    https://cmgds.marine.usgs.gov/data-releases/media/2022/10.5066-P9GO90TI/f156c9410ccc491faa58b6233574f861/2021-004-FA_T20P_Backscatter_1m_browse.jpg (JPEG)
    Thumbnail image of 1-m multibeam echo sounder backscatter data collected from outer Cape Cod, Massachusetts.
  4. Does the data set describe conditions during a particular time period?
    Beginning_Date: 09-Jun-2021
    Ending_Date: 24-Jun-2021
    Currentness_Reference:
    ground condition
  5. What is the general form of this data set?
    Geospatial_Data_Presentation_Form: raster digital data
  6. How does the data set represent geographic features?
    1. How are geographic features stored in the data set?
      This is a Raster data set. It contains the following raster data types:
      • Dimensions 18014 x 5538 x 1, type Grid Cell
    2. What coordinate system is used to represent geographic features?
      Grid_Coordinate_System_Name: Universal Transverse Mercator
      Universal_Transverse_Mercator:
      UTM_Zone_Number: 19
      Transverse_Mercator:
      Scale_Factor_at_Central_Meridian: 0.9996
      Longitude_of_Central_Meridian: -69
      Latitude_of_Projection_Origin: 0
      False_Easting: 500000
      False_Northing: 0
      Planar coordinates are encoded using row and column
      Abscissae (x-coordinates) are specified to the nearest 1.0
      Ordinates (y-coordinates) are specified to the nearest 1.0
      Planar coordinates are specified in meters
      The horizontal datum used is WGS_1984.
      The ellipsoid used is WGS_84.
      The semi-major axis of the ellipsoid used is 6378137.0.
      The flattening of the ellipsoid used is 1/298.257223563.
  7. How does the data set describe geographic features?
    Entity_and_Attribute_Overview:
    Acoustic reflectance values of the nearshore sea floor from outer Cape Cod, Massachusetts.
    Entity_and_Attribute_Detail_Citation: U.S. Geological Survey

Who produced the data set?

  1. Who are the originators of the data set? (may include formal authors, digital compilers, and editors)
    • Seth D. Ackerman
  2. Who also contributed to the data set?
  3. To whom should users address questions about the data?
    Seth Ackerman
    U.S. Geological Survey
    Geologist
    384 Woods Hole Rd.
    Woods Hole, MA
    USA

    508-548-8700 x2315 (voice)
    508-457-2310 (FAX)
    sackerman@usgs.gov

Why was the data set created?

This dataset provides a high-resolution multibeam backscatter mosaic of the seabed created from sonar data collected by the U.S. Geological Survey during survey 2021-004-FA from outer Cape Cod, Massachusetts. The multibeam backscatter mosaic will be used in conjunction with other geophysical and sample data to investigate the morphology and geologic framework of the sea floor and coastal environment of Massachusetts.

How was the data set created?

  1. From what previous works were the data drawn?
    Teledyne SeaBat T20P multibeam echo sounder raw bathymetry and backscatter (source 1 of 1)
    U.S. Geological Survey, Unpublished Material, raw MBES data in s7k format.

    Type_of_Source_Media: disc
    Source_Contribution:
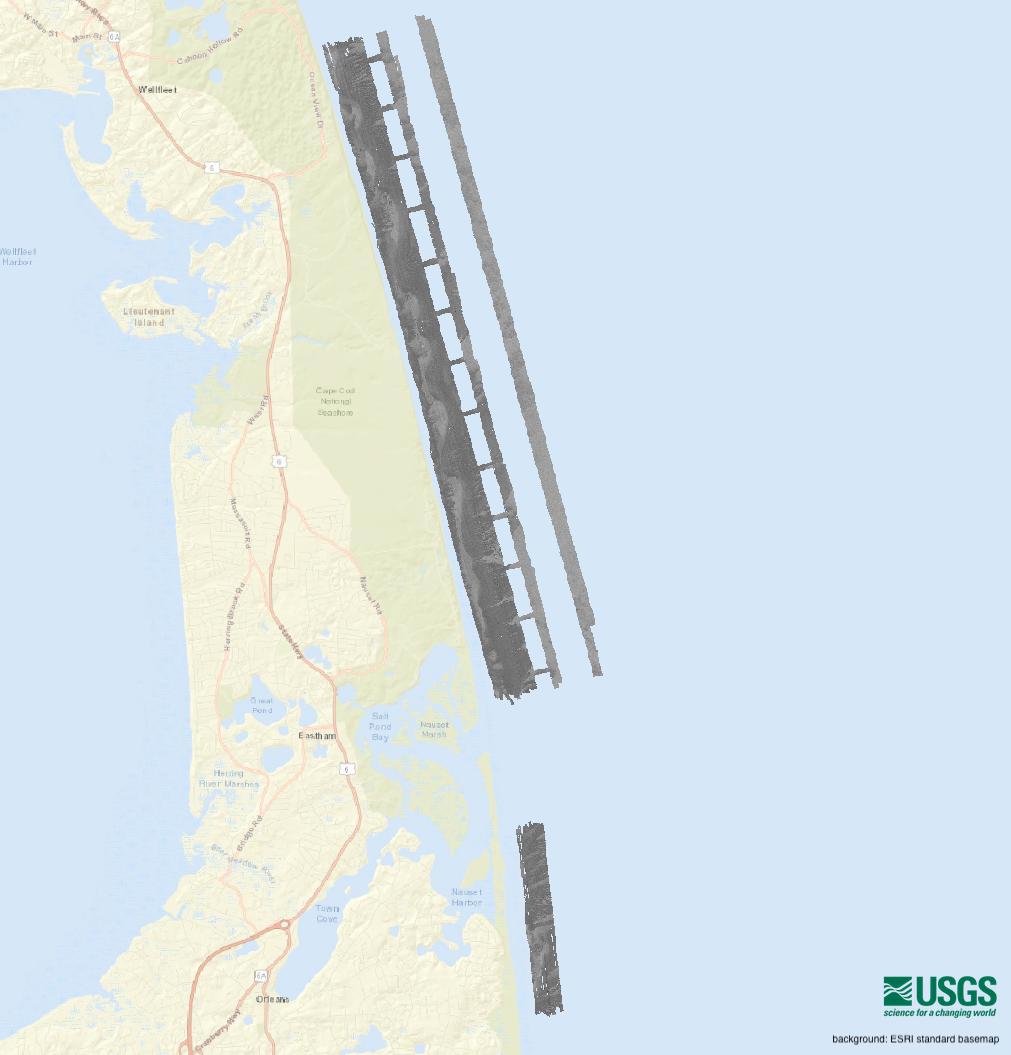
    Multibeam echosounder (MBES) bathymetry and backscatter data were collected using dual-head Teledyne SeaBat T20-P sonars. The pair of mills cross transmit and receive arrays were mounted side-by-side within a bracket that oriented them at opposing 30-degree angles (relative to horizontal). The bracket was pole-mounted on the starboard side of the R/V Rafael so that the sonar arrays were oriented athwart ships (primary and secondary arrays facing outward and down to port and starboard, respectively) and located approximately 1.235 m below the waterline when deployed. Vessel navigation and attitude data were acquired using an Applanix POS MV Wavemaster (model 220, V5) configured with two AeroAntenna Technologies GPS antennas located at either end of a 2-m baseline, which was oriented athwartship and mounted atop the aft end of cabin, and the wetpod MRU mounted atop the sonar bracket just aft of the pole. An AML Micro X SV mounted on the sonar bracket monitored sound speed near the sonars during acquisition, and an AML Minos X SVPT was used to collect water column sound speed profiles 1 to 3 times each survey day. The Teledyne SeaBat User Interface (version 5.0.0.18) was used to control the sonars, which were operated in intermediate mode at full power (220 dB), with frequency-modulated pulses centered at 400 kHz. The range of across track beams (2048 for JD 160, 1024 for the rest of the survey) formed by the sonars were adjusted manually depending on water depth, and resulted in combined swath widths of 50 to 250 meters or typically 3 to 6 times the water depth. Data were monitored and recorded using the Teledyne SeaBat User Interface (UI) (version 5.0.0.18) and Hypack Hysweep (version 2021, 21.1.3.0). The SeaBat User Interface logged the navigation, attitude, bathymetry, time-series backscatter, and water column data to s7k format files for each sonar. The s7k line files were created by the Teledyne SeaBat UI using the following naming convention: M/S_YYYYMMDD_HHMMSS. The line files were appended with an "M" and "S" prefix to denote the port (or main/primary) "M" and "S" starboard (or secondary) sonar heads, respectively. Hypack Hysweep 2021 also was used to log the navigation, attitude, and bathymetry data for both sonars to a single HSX format file. Hypack Hysweep filenames have the format 'LLL_HHMM', where LLL indicates the three digit planned line number and HHMM is the UTC time. The Teledyne SeaBat User Interface s7k data were used to produce the final processed backscatter mosaic.
  2. How were the data generated, processed, and modified?
    Date: Jun-2021 (process 1 of 3)
    PROCESSING STEP 1: CARIS HIPS DATA PROCESSING. Multibeam bathymetry processing within CARIS HIPS (version 11.3) during the survey consisted of the following flow:
    1) Vessel configuration files were created in CARIS for the Main and Secondary s7k sonar files (Rafael_DualT20P_s7k_M.hvf and Rafael_DualT20P_s7k_S.hvf, respectively) which includes, linear and angular installation offsets for each T20-P unit as well as vendor specified uncertainty values for each of the survey sensors.
    2) A CARIS HIPS project (version 11.3) was created with projection information set to Universal Transverse Mercator (UTM) Zone 19N, WGS84 using the vessel configuration file from step 1.1.
    3) Each s7k file was imported to the new CARIS project using the Import/Conversion Wizard.
    4) Delayed heave data from raw POS MV files (.000) were used to update HIPS survey lines using the import auxiliary data function.
    5) Georeference Bathymetry was done to apply the sound velocity corrections from the final SVP files containing all the sound velocity profiles collected for each survey day, specifying the nearest in time method, 'delayed' heave source, and use surface sound speed. SVP files for each survey day were created as part of the sound velocity profile processing workflow, see SVP dataset in the larger work citation.
    6) Each survey line was exported in GSF format for pairing with the corresponding raw s7k files in QPS FMGT (see next step).
    The contact person for this and all subsequent processing steps below is Seth Ackerman. Person who carried out this activity:
    Seth Ackerman
    U.S. Geological Survey
    Geologist
    384 Woods Hole Rd.
    Woods Hole, MA
    USA

    508-548-8700 x2315 (voice)
    508-457-2310 (FAX)
    sackerman@usgs.gov
    Date: 23-Dec-2022 (process 2 of 3)
    PROCESSING STEP 2: QPS FMGT PROCESSING
    Backscatter mosaics were created using QPS FMGT (v. 7.10.0) processing software. Raw s7k files containing the time series values, were paired with the GSF data exported from each survey line file containing the depth data to create a 1-meter resolution time series backscatter mosaic that followed the steps below.
    1) Create new FMGT project for the Outer Cape survey are using UTM 19N, WGS 84 coordinate system.
    2) Set processing parameters for T20-P Sonar (defaults)
    3) Set filter method to flat 300
    4) Add source/paired files using the T20P s7k files for the backscatter files, and GSF files exported from CARIS HIPS. All the s7k and GSF files were added by Julian day. Once the line files were added to the project a 1-meter draft mosaic was created using the "time-series" as the backscatter source for each Julian day for review.
    5) Final 1-meter mosaics were created for each survey area (off Marconi and Nauset beach) and visually reviewed for inconsistencies or anomalies. Gaps in the main survey lines were filled with gap-fill data if available. Individual line files were moved up or down in the mosaic order to increase quality if needed. The "Backscatter Adjustment" tool was used to increase or decrease intensity of individual lines as required to visually match adjacent lines.
    6) The resulting mosaics were exported out of QPS FMGT as 8-bit gray-scale GeoTIFFs.
    Date: 23-Dec-2022 (process 3 of 3)
    PROCESSING STEP 3: MERGING GEOTIFF MOSAICS
    Using Global Mapper (version 24.0), the individual GeoTIFFs were exported as a single 8-bit unsigned integer GeoTIFF. The NODATA value for this GeoTIFF is 255.
  3. What similar or related data should the user be aware of?

How reliable are the data; what problems remain in the data set?

  1. How well have the observations been checked?
  2. How accurate are the geographic locations?
    Navigation data were acquired using the WGS 84 coordinate system with an Applanix POS MV Wavemaster (model 220, V5), which blends Global Navigation Satellite Systems (GNSS) data, acceleration data from a Motion Reference Unit (MRU) and GPS azimuthal heading. The POS MV was configured with two AeroAntenna Technologies GPS antennas located at either end of a 2-m baseline, which was oriented athwartship and mounted atop the aft end of cabin. DGPS positions were obtained from the primary antenna located on the forward end of the baseline, and the positional offsets between the antenna and the navigational reference point (the POS MV IMU) were accounted for in the Applanix POSView (version 11.00) acquisition software. DGPS positions are horizontally accurate to 0.5 - 2 meters, but accuracy can increase to less than 10 cm after post-processing with Applanix POSPac (version 8.7).
  3. How accurate are the heights or depths?
  4. Where are the gaps in the data? What is missing?
    Data were collected on the following dates: 20210609 and 20210615-20210624 (Julian day 160 and 166-175); several lines of bathymetry data was collected on 20210609 (Julian day 160) while the survey team was out testing the seismic system before the formal start of the survey. Data collected during some turns and along lines that extend beyond the area of a continuous bathymetry data were excluded.
  5. How consistent are the relationships among the observations, including topology?
    This backscatter mosaic represents processed dual-head Teledyne SeaBat T20-P multibeam echo sounder (MBES) time series data gridded at 1-m resolution. Quality control and data processing were conducted to remove spurious points and reduce sound speed artifacts (refraction) using CARIS HIPS (version 11.3) and QPS FMGT (version 7.10.0). Despite this processing, small areas of vessel motion and refraction artifacts remain in the data. Small "no data" gaps exist throughout the dataset. These are the result of editing the artifacts and, in some areas, eliminating low quality soundings. In addition, gaps exist in shallow areas where underwater obstructions created hazards for the safe navigation of the survey vessel.
    While navigation and attitude data in the backscatter data and coincident bathymetry data (see larger work citation https://doi.org/10.5066/P9GO90TI) are identical the extents of the processed bathymetry grid and backscatter mosaic differs slightly due to differences in processing. Cross lines, collected to check tide corrections in bathymetry data and to provide dip angle seismic profile data, were not added to this backscatter imagery.

How can someone get a copy of the data set?

Are there legal restrictions on access or use of the data?
Access_Constraints none
Use_Constraints Public domain data from the U.S. Government are freely distributable with proper metadata and source attribution. Please recognize the U.S. Geological Survey as the originator of the dataset.
  1. Who distributes the data set? (Distributor 1 of 1)
    U.S. Geological Survey
    Attn: Coastal and Marine Hazards and Resources Program
    Geologist
    384 Woods Hole Rd.
    Woods Hole, MA
    USA

    508-548-8700 x2315 (voice)
    508-457-2310 (FAX)
    whsc_data_contact@usgs.gov
  2. What's the catalog number I need to order this data set? Multibeam backscatter data collected from outer Cape Cod, Massachusetts during USGS Field Activity 2021-004-FA, using a dual-head Teledyne SeaBat T20-P multibeam echo sounder: includes the GeoTIFF image 2021-004-FA_T20P_Backscatter_1m.tif, world file 2021-004-FA_T20P_Backscatter_1m.tfw, browse graphic 2021-004-FA_T20P_Backscatter_1m_browse.jpg, and Federal Geographic Data Committee (FGDC) Content Standards for Digital Geospatial Metadata (CSDGM) metadata files (2021-004-FA_T20P_Backscatter_1m_meta.xml)
  3. What legal disclaimers am I supposed to read?
    Unless otherwise stated, all data, metadata and related materials are considered to satisfy the quality standards relative to the purpose for which the data were collected. Although these data and associated metadata have been reviewed for accuracy and completeness and approved for release by the U.S. Geological Survey (USGS), no warranty expressed or implied is made regarding the display or utility of the data for other purposes, nor on all computer systems, nor shall the act of distribution constitute any such warranty.
  4. How can I download or order the data?
  5. What hardware or software do I need in order to use the data set?
    To utilize these data, the user must have software capable of viewing GeoTIFF files.

Who wrote the metadata?

Dates:
Last modified: 14-Nov-2023
Metadata author:
Seth Ackerman
U.S. Geological Survey
Geologist
384 Woods Hole Rd.
Woods Hole, MA
USA

508-548-8700 x2315 (voice)
508-457-2310 (FAX)
whsc_data_contact@usgs.gov
Contact_Instructions:
The metadata contact email address is a generic address in the event the person is no longer with the USGS.
Metadata standard:
Content Standards for Digital Geospatial Metadata (FGDC-STD-001-1998)

This page is <https://cmgds.marine.usgs.gov/catalog/whcmsc/DRB_data_release/DRB_P9GO90TI/2021-004-FA_T20P_Backscatter_1m_meta.faq.html>
Generated by mp version 2.9.51 on Wed Nov 15 10:11:10 2023