Online Links:
Online Links:
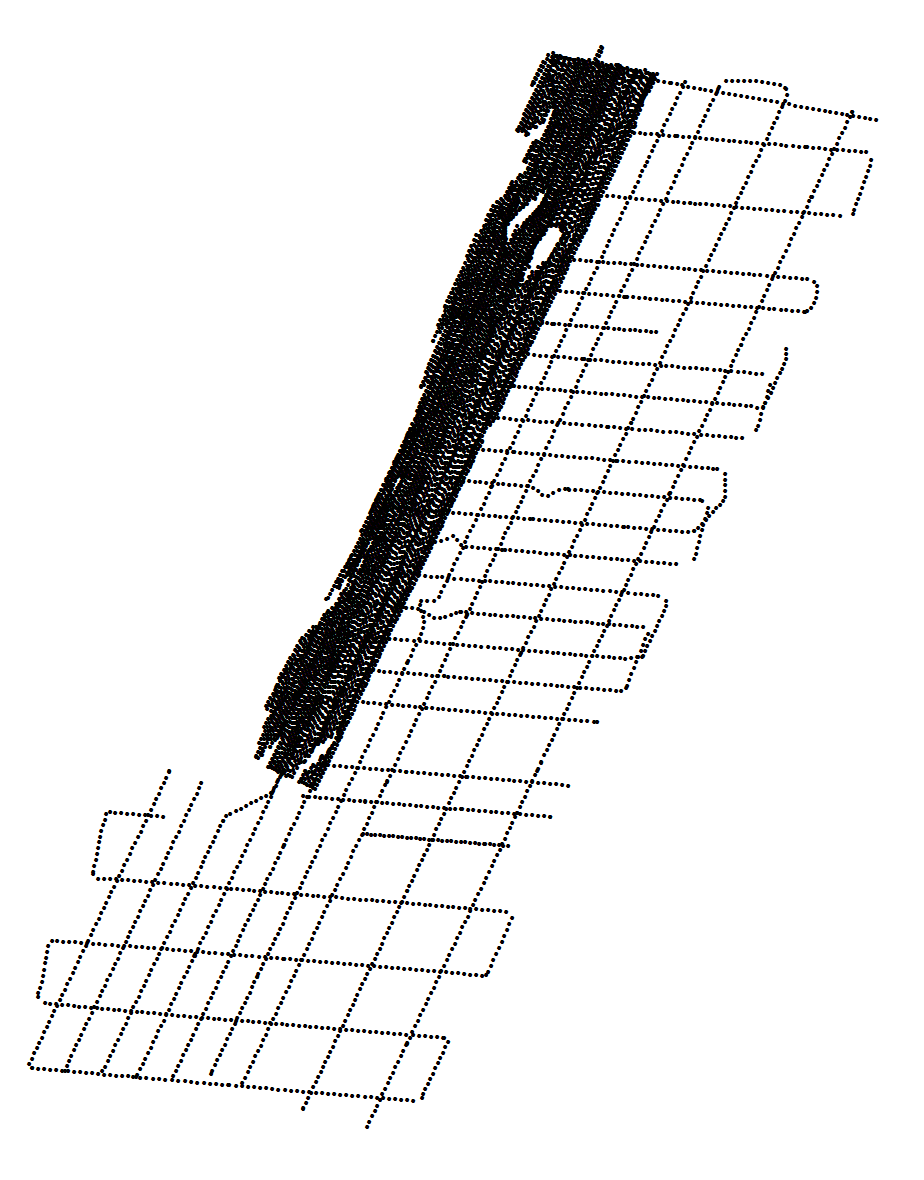
| Range of values | |
|---|---|
| Minimum: | 449880.7 |
| Maximum: | 527500.22 |
| Units: | meters |
| Resolution: | .01 |
| Range of values | |
|---|---|
| Minimum: | 4154602.47 |
| Maximum: | 4253571.17 |
| Units: | meters |
| Resolution: | .01 |
| Range of values | |
|---|---|
| Minimum: | -75.567695 |
| Maximum: | -74.685191 |
| Units: | degrees |
| Resolution: | .000001 |
| Range of values | |
|---|---|
| Minimum: | 37.538209 |
| Maximum: | 38.430403 |
| Units: | degrees |
| Resolution: | .000001 |
| Range of values | |
|---|---|
| Minimum: | 1 |
| Maximum: | 40509 |
| Units: | shot |
| Resolution: | 1 |
| Range of values | |
|---|---|
| Minimum: | 2014 |
| Maximum: | 2014 |
| Units: | year |
| Resolution: | 1 |
| Access_Constraints | None |
|---|---|
| Use_Constraints | Public domain data from the U.S. Government are freely redistributable with proper metadata and source attribution. Please recognize the U.S. Geological Survey as the originator of the dataset. |
| Data format: | WinZip (v 14.5) file containsa shapefile of 512i 500-interval shot points and a CSV file of the unique shot navigation collected by the U.S. Geological Survey - Woods Hole Coastal and Marine Science Center along the Delmarva Peninsula, MD and VA and the associated metadata. in format Shapefile (version ArcGIS 10.2.2) Shapefile Size: 52 |
|---|---|
| Network links: |
https://cmgds.marine.usgs.gov/data/field-activity-data/2014-002-FA/data/seismics/tracks/2014-002-FA_512shots.zip https://cmgds.marine.usgs.gov/data/field-activity-data/2014-002-FA/ https://doi.org/10.5066/F7MW2F60 |
| Data format: | WinZip (v 14.5) file containsa shapefile of 512i 500-interval shot points and a CSV file of the unique shot navigation collected by the U.S. Geological Survey - Woods Hole Coastal and Marine Science Center along the Delmarva Peninsula, MD and VA and the associated metadata. in format Comma Seperated Values (CSV) (version Excel Version 2010) Comma Seperated Values (CSV) Size: 52 |
|---|---|
| Network links: |
https://cmgds.marine.usgs.gov/data/field-activity-data/2014-002-FA/data/seismics/tracks/2014-002-FA_512shots.zip https://cmgds.marine.usgs.gov/data/field-activity-data/2014-002-FA/ https://doi.org/10.5066/F7MW2F60 |