Online Links:
Online Links:
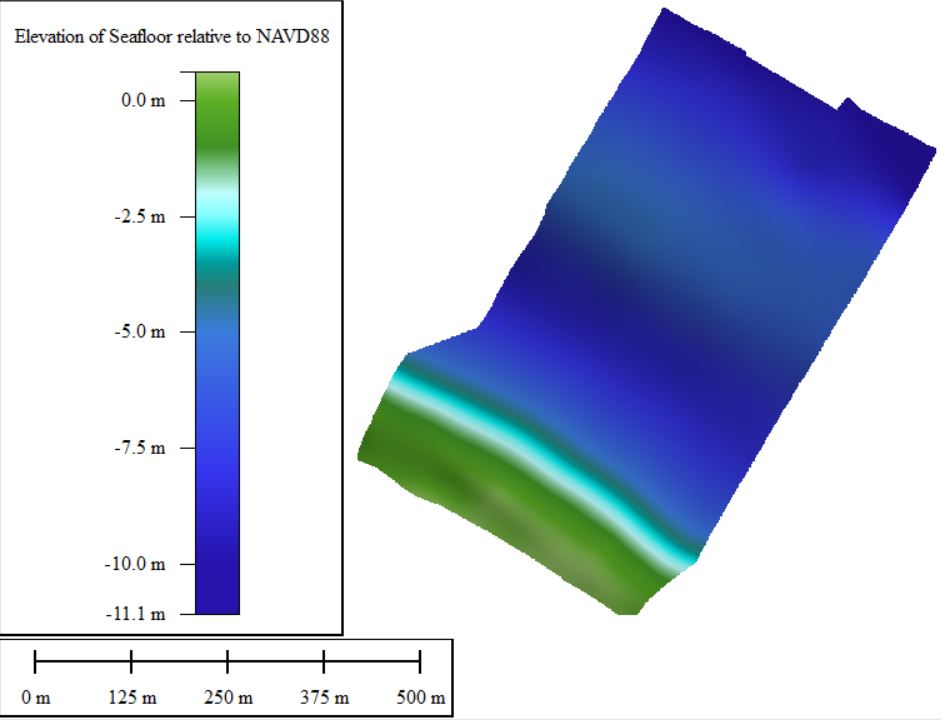
| Range of values | |
|---|---|
| Minimum: | -11.09 |
| Maximum: | 0.622 |
| Units: | meters |
| Value | Definition |
|---|---|
| 2021-014-FA | Year, ID, and Field Activity abbreviation |
| Range of values | |
|---|---|
| Minimum: | 2021-02-11 |
| Maximum: | 2021-02-11 |
| Range of values | |
|---|---|
| Minimum: | 14:59:18 |
| Maximum: | 16:31:37 |
| Units: | meters |
| Range of values | |
|---|---|
| Minimum: | 42.05138646 |
| Maximum: | 42.05847962 |
| Units: | Decimal degrees |
| Range of values | |
|---|---|
| Minimum: | -70.07978519 |
| Maximum: | -70.07078047 |
| Units: | Decimal degrees |
| Range of values | |
|---|---|
| Minimum: | -26.433 |
| Maximum: | -23.53 |
| Units: | meters |
| Range of values | |
|---|---|
| Minimum: | 410648.715 |
| Maximum: | 411398.961 |
| Units: | meters |
| Range of values | |
|---|---|
| Minimum: | 4656041.051 |
| Maximum: | 4656828.271 |
| Units: | meters |
| Range of values | |
|---|---|
| Minimum: | 1.149 |
| Maximum: | 4.054 |
| Units: | meters |
| Value | Definition |
|---|---|
| 2021-014-FA | Year, ID, and Field Activity abbreviation |
| Range of values | |
|---|---|
| Minimum: | 2021-02-11 |
| Maximum: | 2021-02-11 |
| Range of values | |
|---|---|
| Minimum: | 15:05:11 |
| Maximum: | 15:50:58 |
| Value | Definition |
|---|---|
| NaN | Null value |
| Range of values | |
|---|---|
| Minimum: | -6.948 |
| Maximum: | 1.028 |
| Units: | meters |
| Value | Definition |
|---|---|
| NaN | Null value |
| Range of values | |
|---|---|
| Minimum: | -11.528 |
| Maximum: | 1.372 |
| Units: | meters |
Online Links:
| Access_Constraints | None |
|---|---|
| Use_Constraints | Public domain data from the U.S. Government are freely redistributable with proper metadata and source attribution. Although these data have been processed successfully on a computer system at the U.S. Geological Survey (USGS), no warranty expressed or implied is made regarding the display or utility of the data for other purposes, nor on all computer systems, nor shall the act of distribution constitute any such warranty. The USGS or the U.S. Government shall not be held liable for improper or incorrect use of the data described and/or contained herein. Not for navigational use. Please recognize the U.S. Geological Survey (USGS) as the source of this information. |
| Data format: | Windows 10 zip folder containis a 32-bit floating point GeoTIFF representing a grid of single beam bathymetric data collected by Peter Traykovski (WHOI) during field activity 2021-014-FA offshore of Head of the Meadow Beach, Truro MA on February 11, 2021. in format GeoTIFF (version 1.0.0) 32-bit floating point GeoTIFF format Size: 3.69 |
|---|---|
| Network links: |
https://cmgds.marine.usgs.gov/data/field-activity-data/2021-014-FA/data/Topobathy/Bathymetry/2021014FA_Truro_Bathymetry.zip https://cmgds.marine.usgs.gov/data/field-activity-data/2021-014-FA https://doi.org/10.5066/P9D94NZ3 |
| Data format: | The CSV files contains trackline and echosounder data. in format CSV (version Exported from Excel Office 365 16.01) Size: 1 |
|---|---|
| Network links: |
https://cmgds.marine.usgs.gov/data/field-activity-data/2021-014-FA/data/Topobathy/Bathymetry/2021014FA_Truro_Bathymetry.zip https://cmgds.marine.usgs.gov/data/field-activity-data/2021-014-FA https://doi.org/10.5066/P9D94NZ3 |