High-resolution geophysical and geological data collected in Cape Cod Bay, Massachusetts during USGS Field Activities 2019-002-FA and 2019-034-FA (ver. 2.0, September 2022)
By Seth D. Ackerman, David S. Foster, Brian D. Andrews, William W. Danforth, Wayne E. Baldwin, Emily C. Huntley, Charles R. Worley, and Laura L. Brothers
https://doi.org/10.5066/P99DR4PN
Dates
Published: July 18, 2022
Last Revised: Sept. 16, 2022 (ver. 2.0)
Data Collected: Aug. 1, 2019 – Sept. 19, 2019
Summary
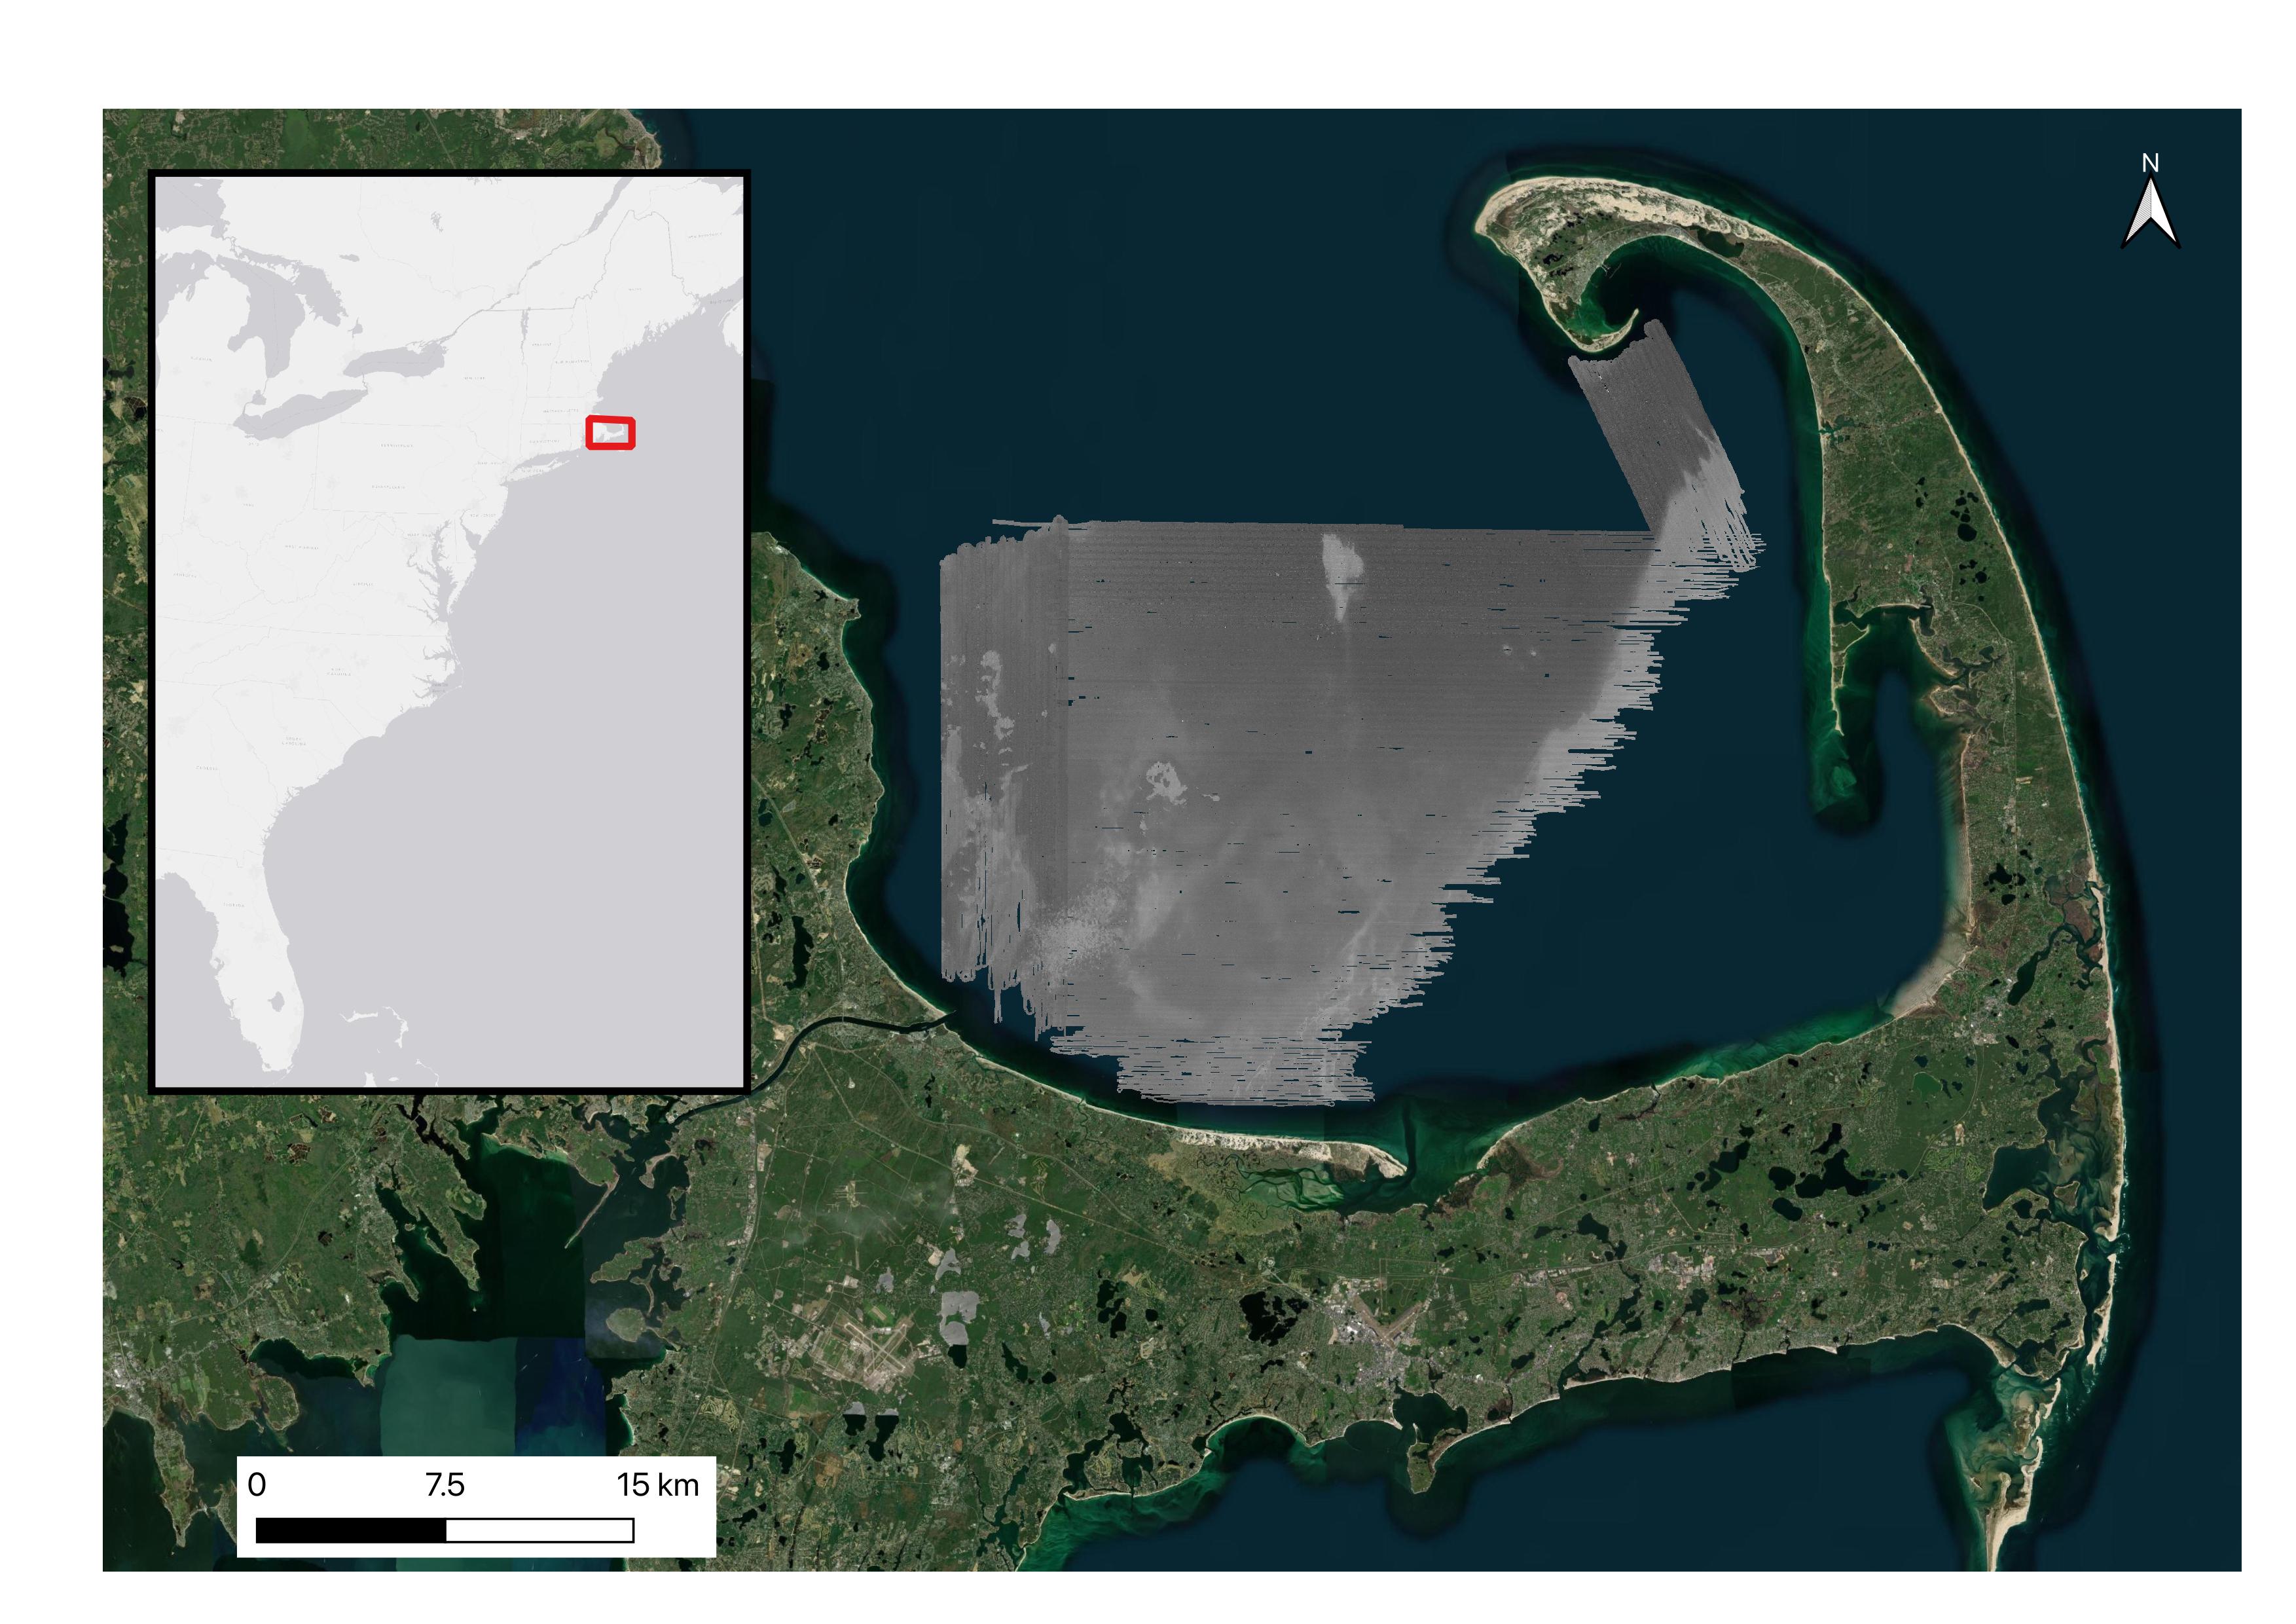
Accurate data and maps of sea floor geology are important first steps toward protecting fish habitat, delineating marine resources, and assessing environmental changes due to natural or human impacts. To address these concerns the U.S. Geological Survey, in cooperation with the Massachusetts Office of Coastal Zone Management (CZM), comprehensively mapped the Cape Cod Bay sea floor to characterize the surface and shallow subsurface geologic framework. Geophysical data collected include swath bathymetry, backscatter, and seismic reflection profile data. Ground-truth data, including sediment samples, underwater video, and bottom photographs were also collected. This effort is part of a long-term collaboration between the USGS and the Commonwealth of Massachusetts to map the State's waters, support research on the Quaternary evolution of coastal Massachusetts, the influence of sea-level change and sediment supply on coastal evolution, and efforts to understand the type, distribution, and quality of subtidal marine habitats. This collaboration produces high-resolution geologic maps and Geographic Information System (GIS) data that serve the needs of research, management and the public. Data collected as part of this mapping cooperative continue to be released in a series of USGS Open-File Reports and Data Releases
Sonar Data
-
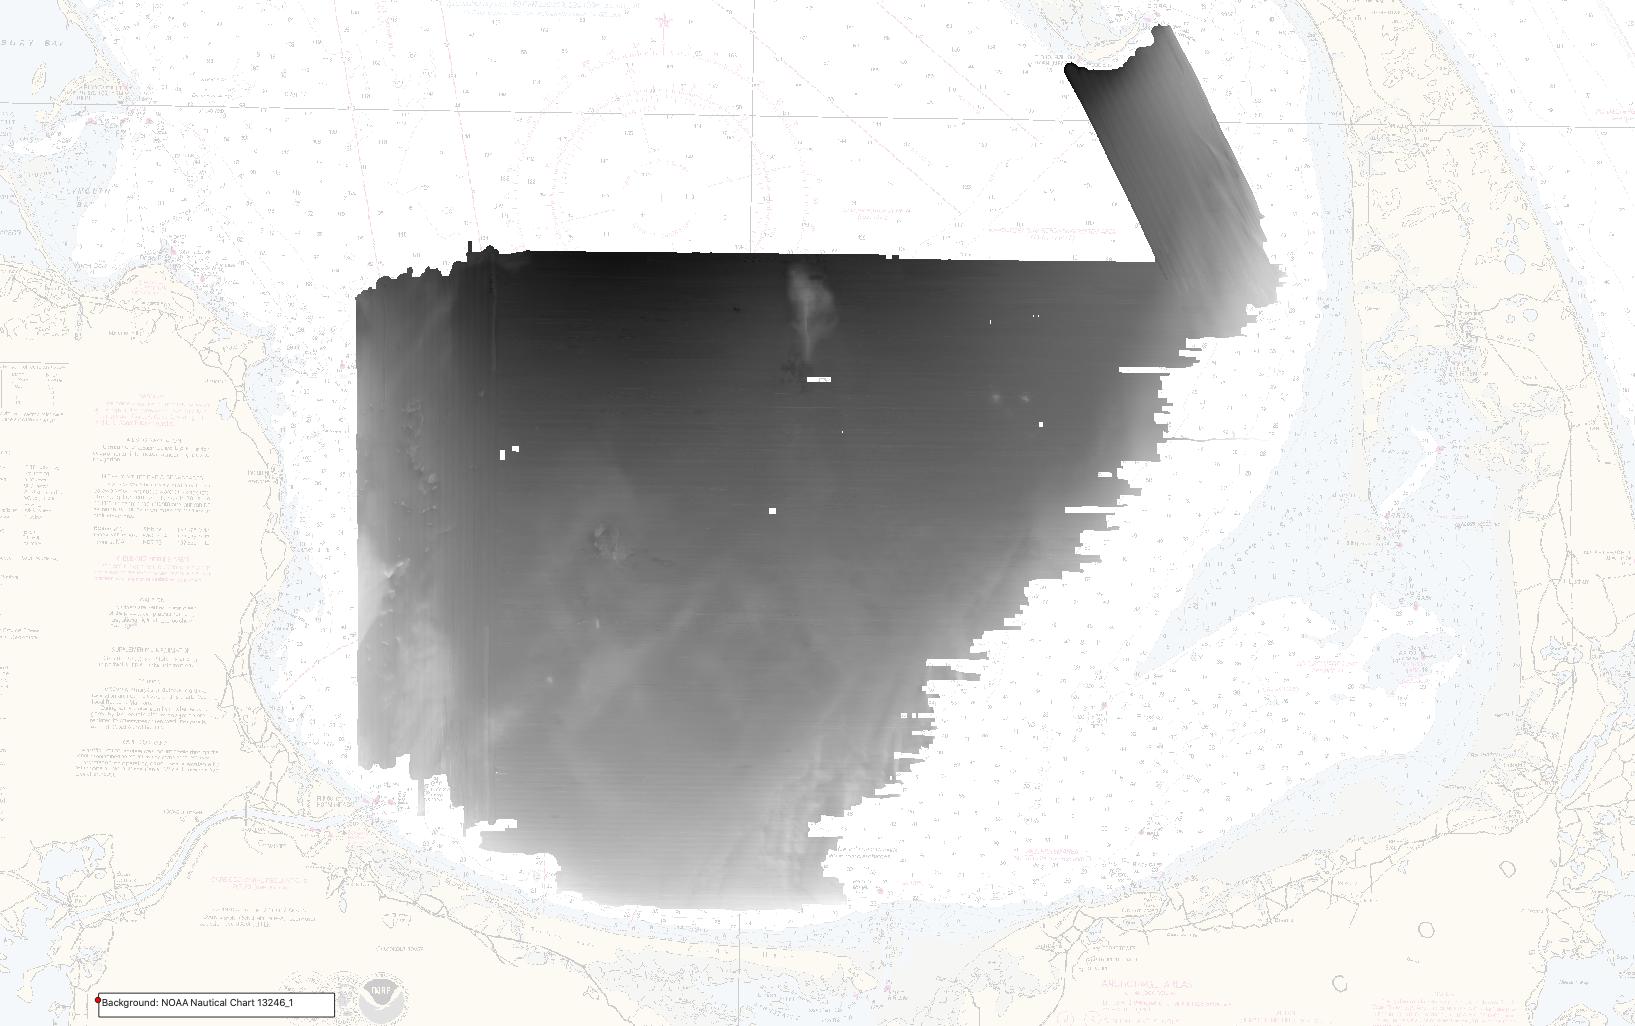
Multibeam bathymetric data collected in Cape Cod Bay, Massachusetts during USGS Field Activity 2019-002-FA, using a dual-head Reson T20-P multibeam echo sounder (32-bit GeoTIFF, UTM Zone 19N, NAD 83, MLLW Vertical Datum, 5-m resolution)
This dataset provides a high-resolution digital elevation model (DEM) of the seabed created from bathymetric sonar data collected by the U.S. Geological Survey during survey 2019-002-FA in Cape Cod Bay, Massachusetts. The final dataset is referenced to the Mean Lower Low Water (MLLW) tidal datum. In conjunction with other geophysical and sample data, this bathymetry dataset will be used to investigate the morphology and geologic framework of the sea floor and coastal environment.
Data Files
2019-002-FA_T20P_Bathymetry_5m_MLLW.zip - 49.5 MB
Metadata Files

-
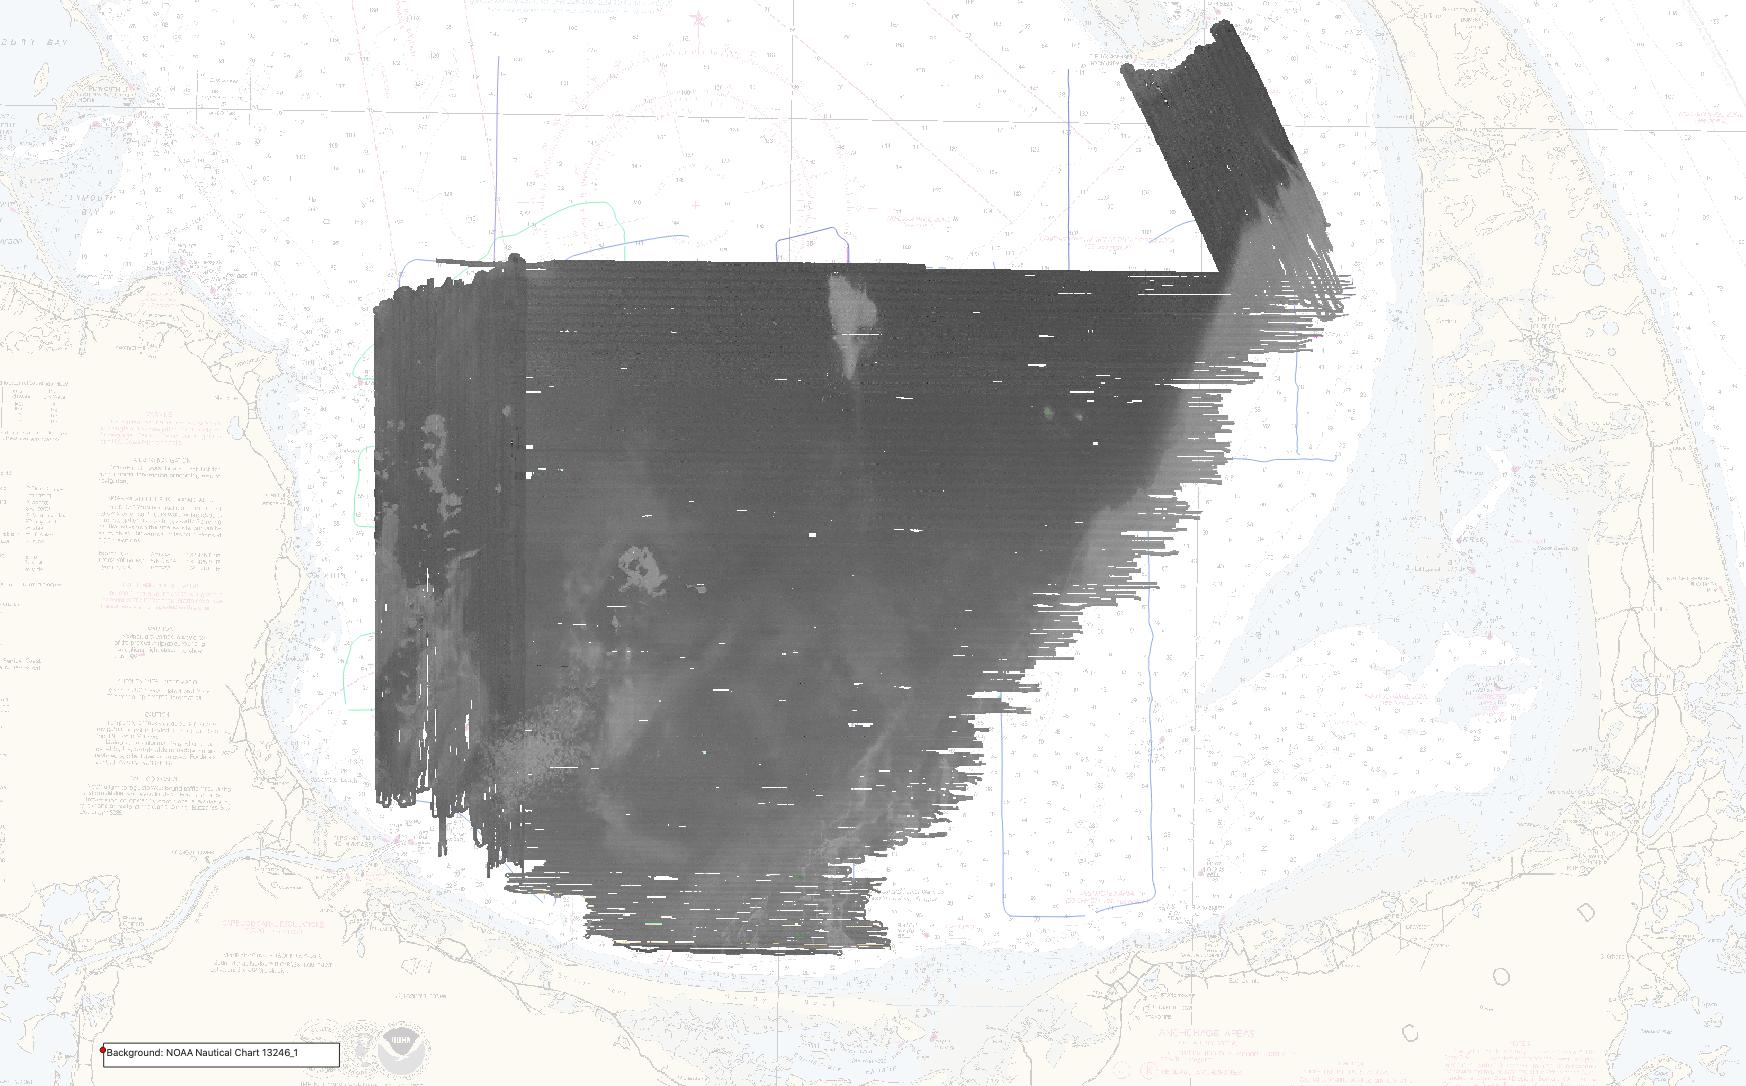
Multibeam backscatter data collected in Cape Cod Bay, Massachusetts during USGS Field Activity 2019-002-FA, using a dual-head Reson T20-P multibeam echo sounder (8-bit GeoTIFF, UTM Zone 19N, WGS84, 1-m resolution)
This dataset provides a high-resolution multibeam backscatter mosaic of the seabed created from sonar data collected by the U.S. Geological Survey during survey 2019-002-FA in Cape Cod Bay, Massachusetts. The multibeam backscatter mosaic will be used in conjunction with other geophysical and sample data to investigate the morphology and geologic framework of the sea floor and coastal environment in Cape Cod Bay Massachusetts.
Data Files
2019-002-FA_T20P_Backscatter_1m.zip - 296.7 MB
Metadata Files
2019-002-FA_T20P_Backscatter_1m_meta.xml - 27.2 KB
2019-002-FA_T20P_Backscatter_1m_meta.txt - 26.6 KB

-
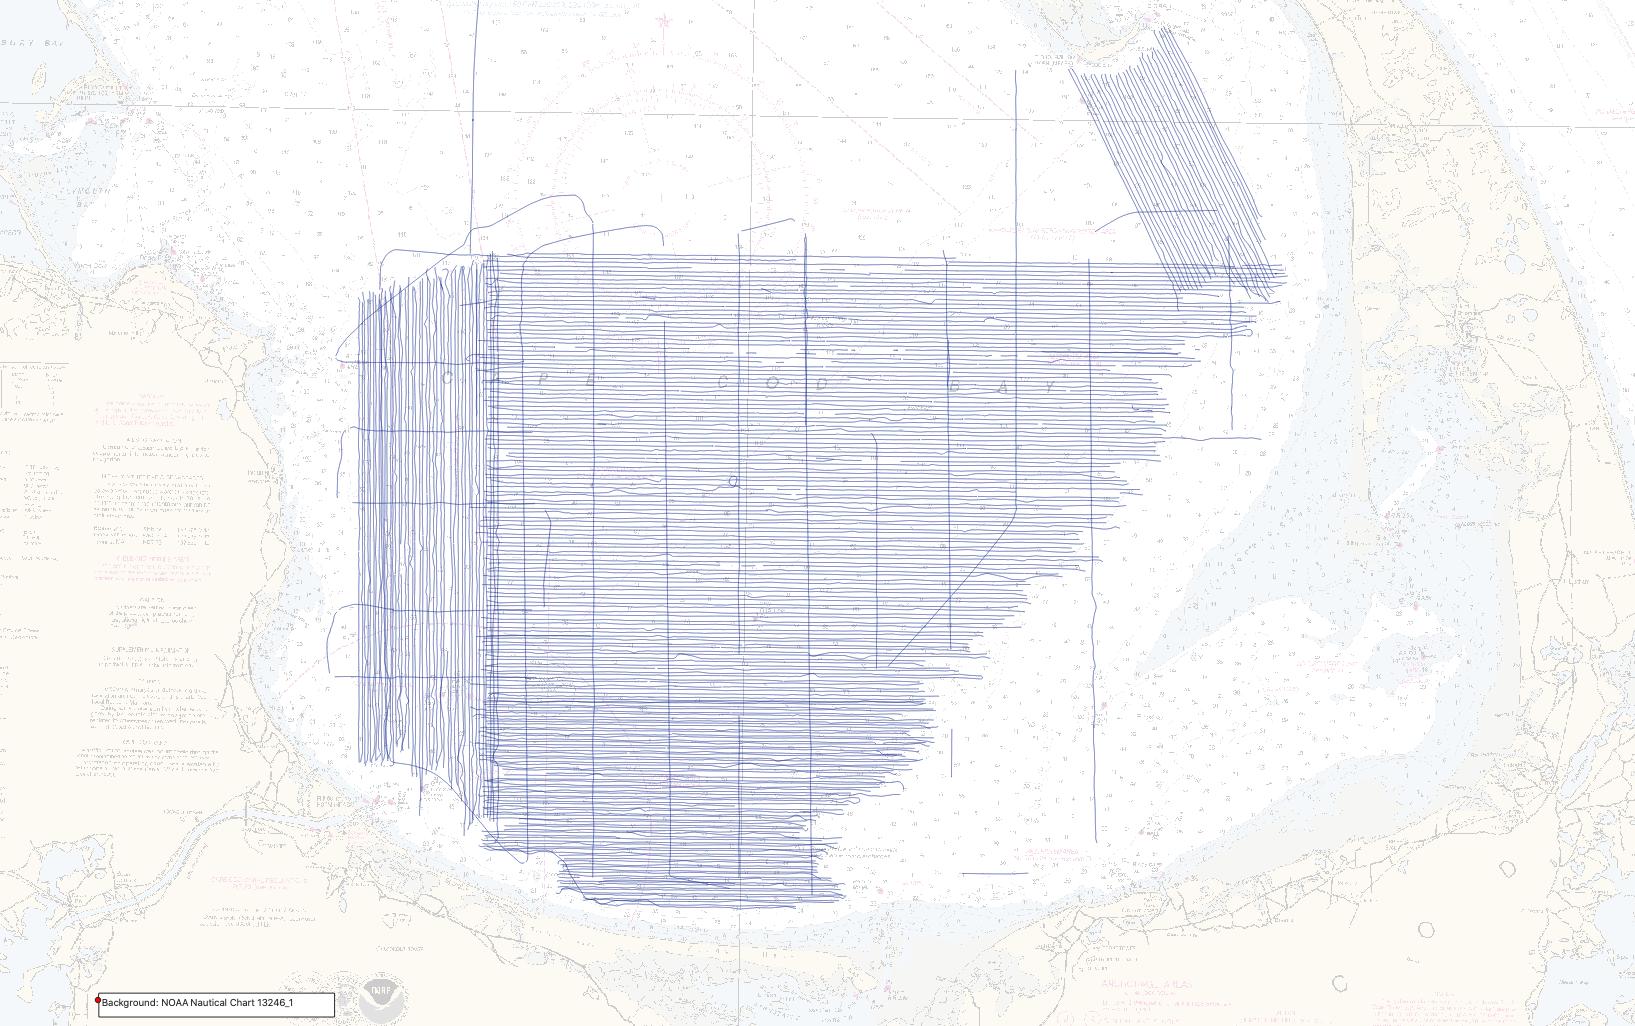
Multibeam sonar tracklines collected in Cape Cod Bay, Massachusetts with a Reson T-20P during USGS Field Activity 2019-002-FA (Esri polyline shapefile, GCS WGS 84)
This dataset contains a polyline shapefile representing the trackline navigation for approximately 4912 kilometers of multibeam echo sounder bathymetry and backscatter data collected by the U.S. Geological Survey during survey 2019-002-FA in Cape Cod Bay, Massachusetts. This information can help spatially correlate the bathymetry and backscatter data with other geophysical data.
Data Files
2019-002-FA_T20P_Tracklines.zip - 26.5 MB
Metadata Files
2019-002-FA_T20P_Tracklines_meta.xml - 30.6 KB
2019-002-FA_T20P_Tracklines_meta.txt - 29.9 KB
-
Sound velocity profile data from an AML Oceanographic MVP30 and Minos X collected in Cape Cod Bay, Massachusetts during USGS Field Activity 2019-002-FA (PNG images, SVP text, and point shapefile, GCS WGS 84)
This dataset is used to display the locations of sound velocity profiles collected with an AML MVP30 (moving vessel profiler) and an AML Minos X SVP (sound velocity profiler) during survey 2019-002-FA in Cape Cod Bay, Massachusetts. The information contained within the sound velocity profiles is needed to account for refraction artifacts that may be present within raw swath bathymetric data. This dataset contains graphs of the sound velocity profile at each station location, as well as location in Geographic Coordinate System (GCS) WGS 84 latitude and longitude, time of day and date of collection.
Data Files
2019-002-FA_MVPSVP_data.zip - 18.9 MB
Metadata Files
2019-002-FA_MVPSVP_data_meta.xml - 34.9 KB
2019-002-FA_MVPSVP_data_meta.txt - 33.8 KB

Seismic Data
-
Multichannel seismic-reflection and navigation data collected using an Applied Acoustics S-Boom and a Geometrics GeoEel digital 32-channel streamer during USGS field activity 2019-002-FA (point and polyline shapefiles, CSV text, PNG Images, and SEG-Y data, GCS WGS 84).
This dataset contains common mid-point (CMP) and trackline navigation, profile images, and raw SEG-Y trace data for approximately 580 km of multichannel seismic-reflection data collected by the U.S. Geological Survey during USGS field activity 2019-002-FA in Cape Cod Bay. Images of each seismic profile were generated in order to provide portable and easily viewable alternatives to the SEG-Y versions of the data. Each profile image can be hyperlinked to its corresponding trackline navigation contained within the Esri polyline shapefile '2019-002-FA_MCS_cmpTracklines.shp'. CMP and tick marks along the top of the PNG images correlate to the positions of 500 shot intervals within the Esri point shapefile '2019-002-FA_MCS_cmp500.shp'. This information allows for spatial correlation of MCS seismic-reflection profiles images with other geophysical and sample data for investigating sea-floor morphology and stratigraphy in the area. An additional single MCS profile from a pre-cruise equipment testing survey (2019-014-FA) is also included with this dataset.
Data Files
2019-002-FA_MCS_cmpnav.zip - 7.5 MB
2019-002-FA_MCS_Images.zip - 1.4 GB
2019-002-FA_MCS_psmig_segy.zip - 10.0 GB
2019-002-FA_MCS_Shapefiles.zip - 4.5 MB
2019-002-FA_MCS_shotnav.zip - 3.0 MB
Metadata Files
2019-002-FA_MCS_meta.xml - 63.4 KB
2019-002-FA_MCS_meta.txt - 62.7 KB

-
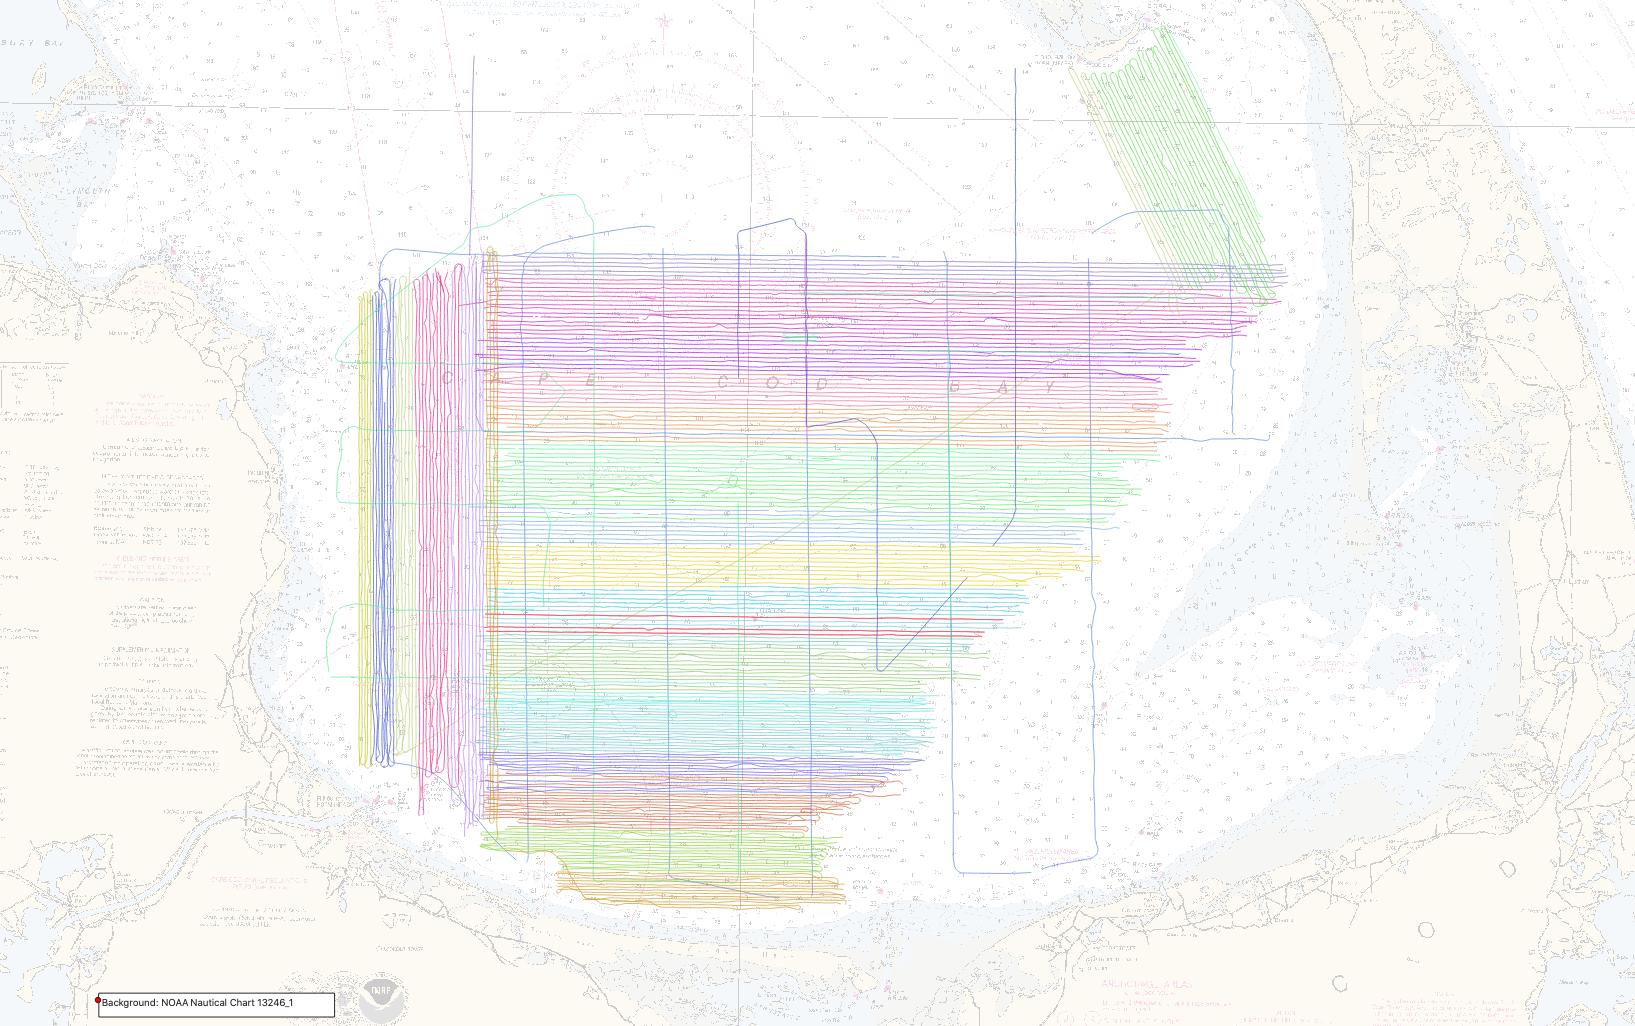
Chirp seismic reflection - shotpoints, tracklines, profile images, and SEG-Y traces for EdgeTech SB-512i chirp data collected during USGS field activity 2019-002-FA (point and polyline shapefiles, CSV text, PNG Images, and SEGY data, GCS WGS 84)
This dataset contains shotpoint and trackline navigation, profile images, and raw SEG-Y trace data for approximately 4585 km of EdgeTech SB512i chirp seismic-reflection data collected by the U.S. Geological Survey during USGS field activity 2019-002-FA in Cape Cod Bay. Images of each seismic profile were generated in order to provide portable and easily viewable alternatives to the SEG-Y versions of the data. Each profile image can be hyperlinked to its corresponding trackline navigation contained within the Esri polyline shapefile '2019-002-FA_SB512iTracklines.shp'. Shotpoint index and tick marks along the top of the PNG images correlate to the positions of 500 shot intervals within the Esri point shapefile '2019-002-FA_SB512i_sht500.shp'. This information allows for spatial correlation of chirp seismic-reflection profiles images with other geophysical and sample data for investigating sea-floor morphology and stratigraphy in the area.
Data Files
2019-002-FA_SB512i_Images.zip - 6.1 GB
2019-002-FA_SB512i_SegyData_L100-149.zip - 8.4 GB
2019-002-FA_SB512i_SegyData_L1-49.zip - 12.9 GB
2019-002-FA_SB512i_SegyData_L150-209.zip - 8.2 GB
2019-002-FA_SB512i_SegyData_L210-281_transits.zip - 9.5 GB
2019-002-FA_SB512i_SegyData_L50-99.zip - 11.3 GB
2019-002-FA_SB512i_Shapefiles.zip - 43.3 MB
2019-002-FA_SB512i_shtnav.zip - 26.0 MB
Metadata Files
2019-002-FA_SB512i_meta.xml - 48.5 KB
2019-002-FA_SB512i_meta.txt - 47.7 KB

Imagery Data
-
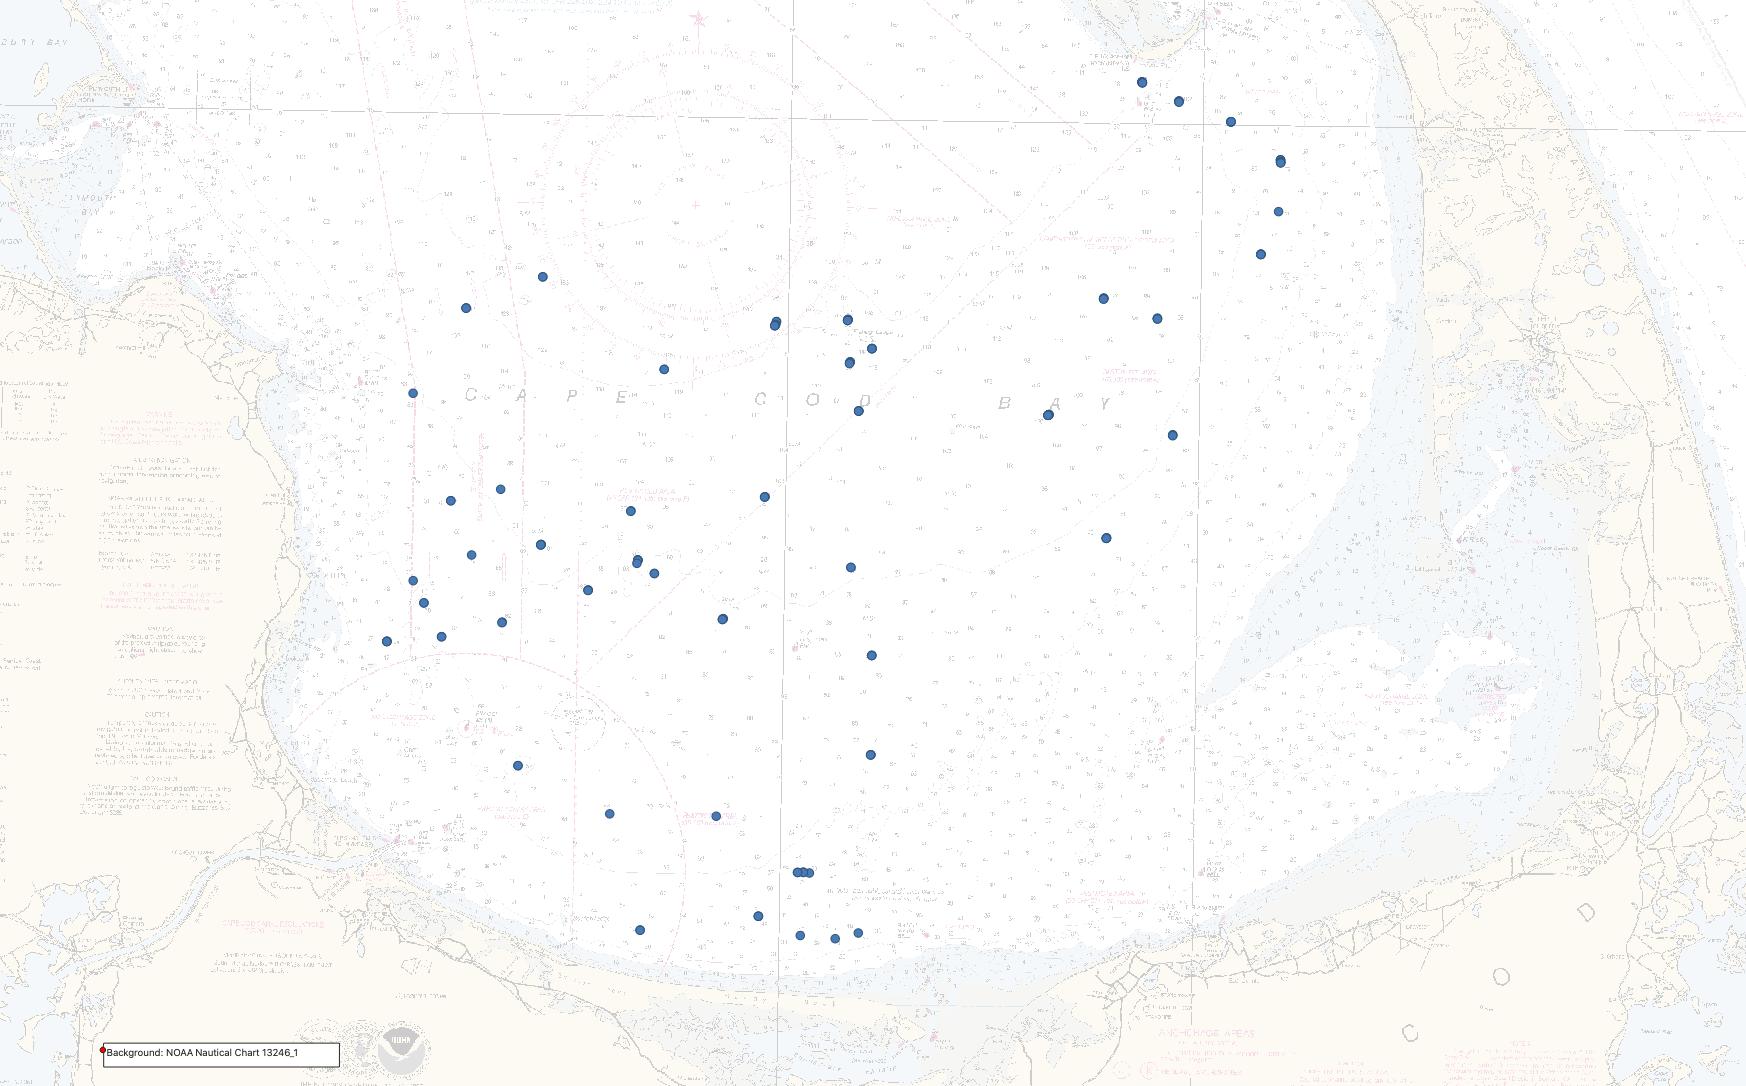
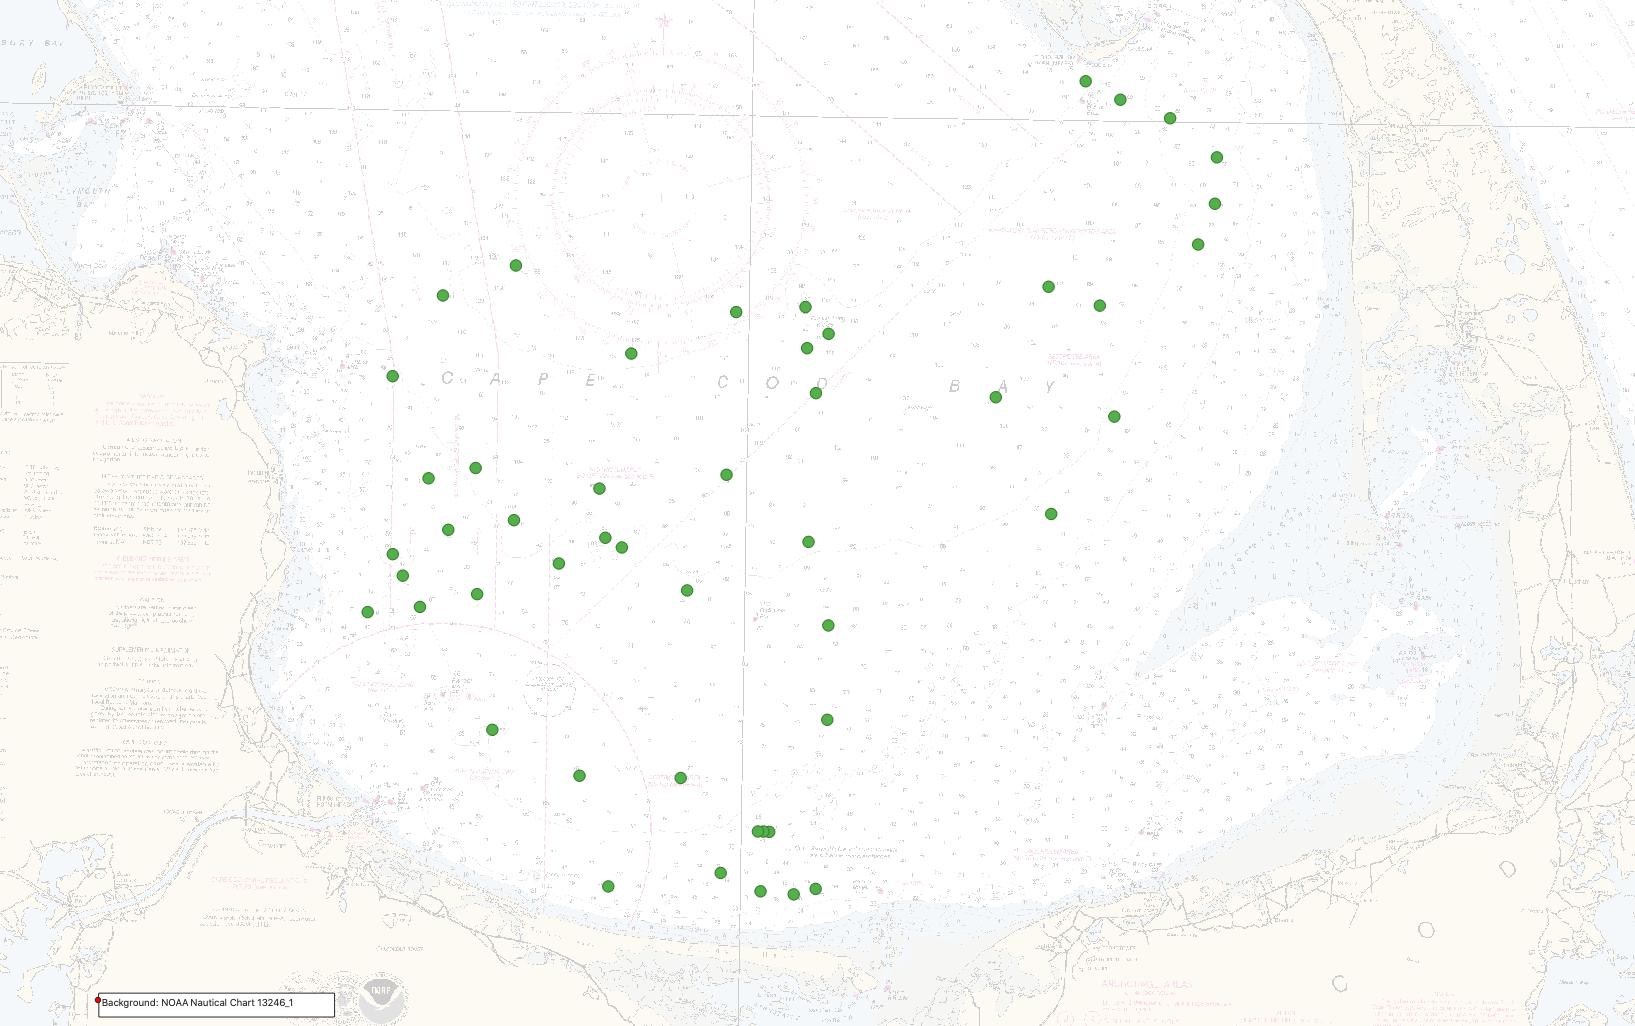
Geotagged sea-floor images and locations of bottom images collected in Cape Cod Bay, Massachusetts, in September 2019 by the U.S. Geological Survey during field activity 2019-034-FA (JPEG images, point shapefile, and CSV file; GCS WGS 84)
This dataset provides the geotagged sea-floor images as well as the location of those images acquired with a GoPro HERO4 Black camera and SeaViewer 6000 HD Sea-Drop video camera on the Mini SEABed Observation and Sampling System (MiniSEABOSS) aboard the Research Vessel (R/V) Tioga during USGS field activity 2019-034-FA (September 17 and 19, 2019). These data were collected to characterize the sea floor by identifying sediment texture and to ground-truth acoustic data collected during USGS field activity 2019-002-FA. Bottom images serve as a means to visually classify grain size and identify sea-floor habitats, and they are especially important for sample sites where no physical sediment sample was collected.
Data Files
2019-034-FA_photolocations.zip - 14.2 KB
2019-034-FA_photos (via the CMHRP Imagery Data System)
Metadata Files
2019-034-FA_photos_meta.xml - 64.3 KB
2019-034-FA_photos_meta.txt - 64.3 KB
-
Sea-floor videos and locations of bottom video tracklines collected in Cape Cod Bay, Massachusetts, in September 2019 by the U.S. Geological Survey during field activity 2019-034-FA (MP4 video files and polyline shapefile, GCS WGS 84)
This dataset provides access to the sea-floor videos and their locations of bottom videos acquired with a SeaViewer 6000 HD Sea-Drop video camera on the Mini SEABed Observation and Sampling System (MiniSEABOSS) aboard the Research Vessel (R/V) Tioga during USGS field activity 2019-034-FA (September 17 and 19, 2019). These data were collected to characterize the sea floor by identifying sediment texture and to ground-truth acoustic data collected during USGS field activity 2019-002-FA. Bottom videos serve as a means to visually classify grain size and identify sea-floor habitats, and they are especially important for sample sites where no physical sediment sample was collected.
Data Files
2019-034-FA_videos.zip - 1.1 GB
Metadata Files
2019-034-FA_videos_meta.xml - 44.6 KB
2019-034-FA_videos_meta.txt - 43.9 KB

Environmental Data
-
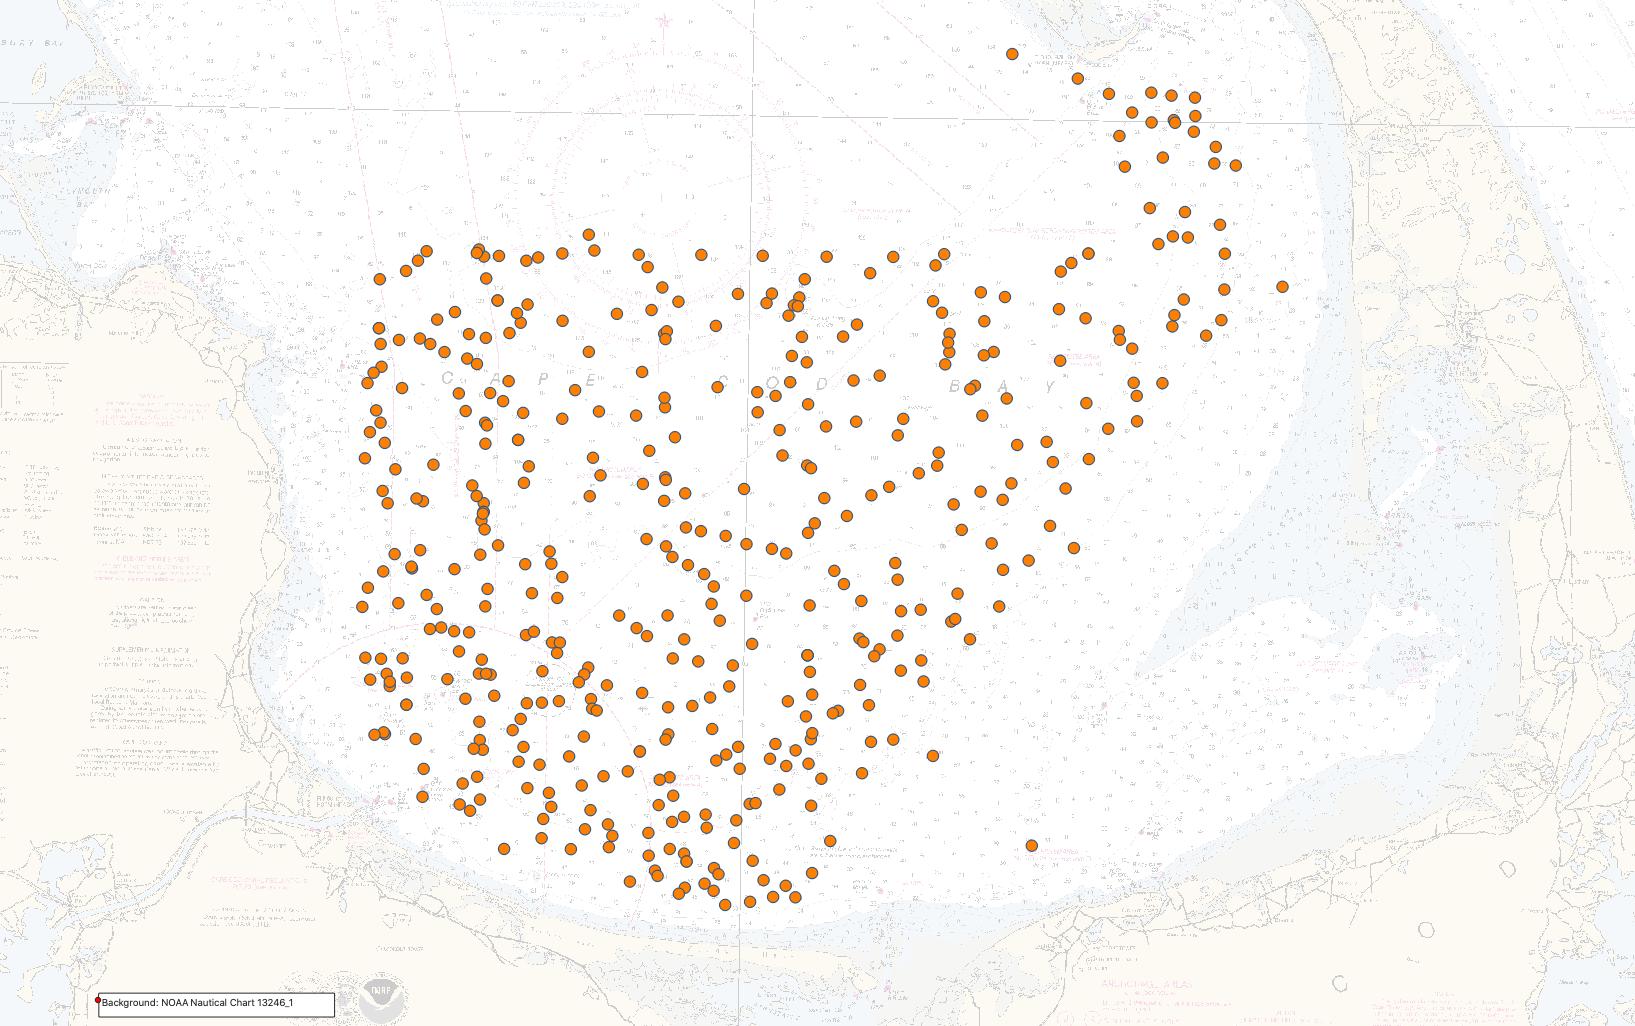
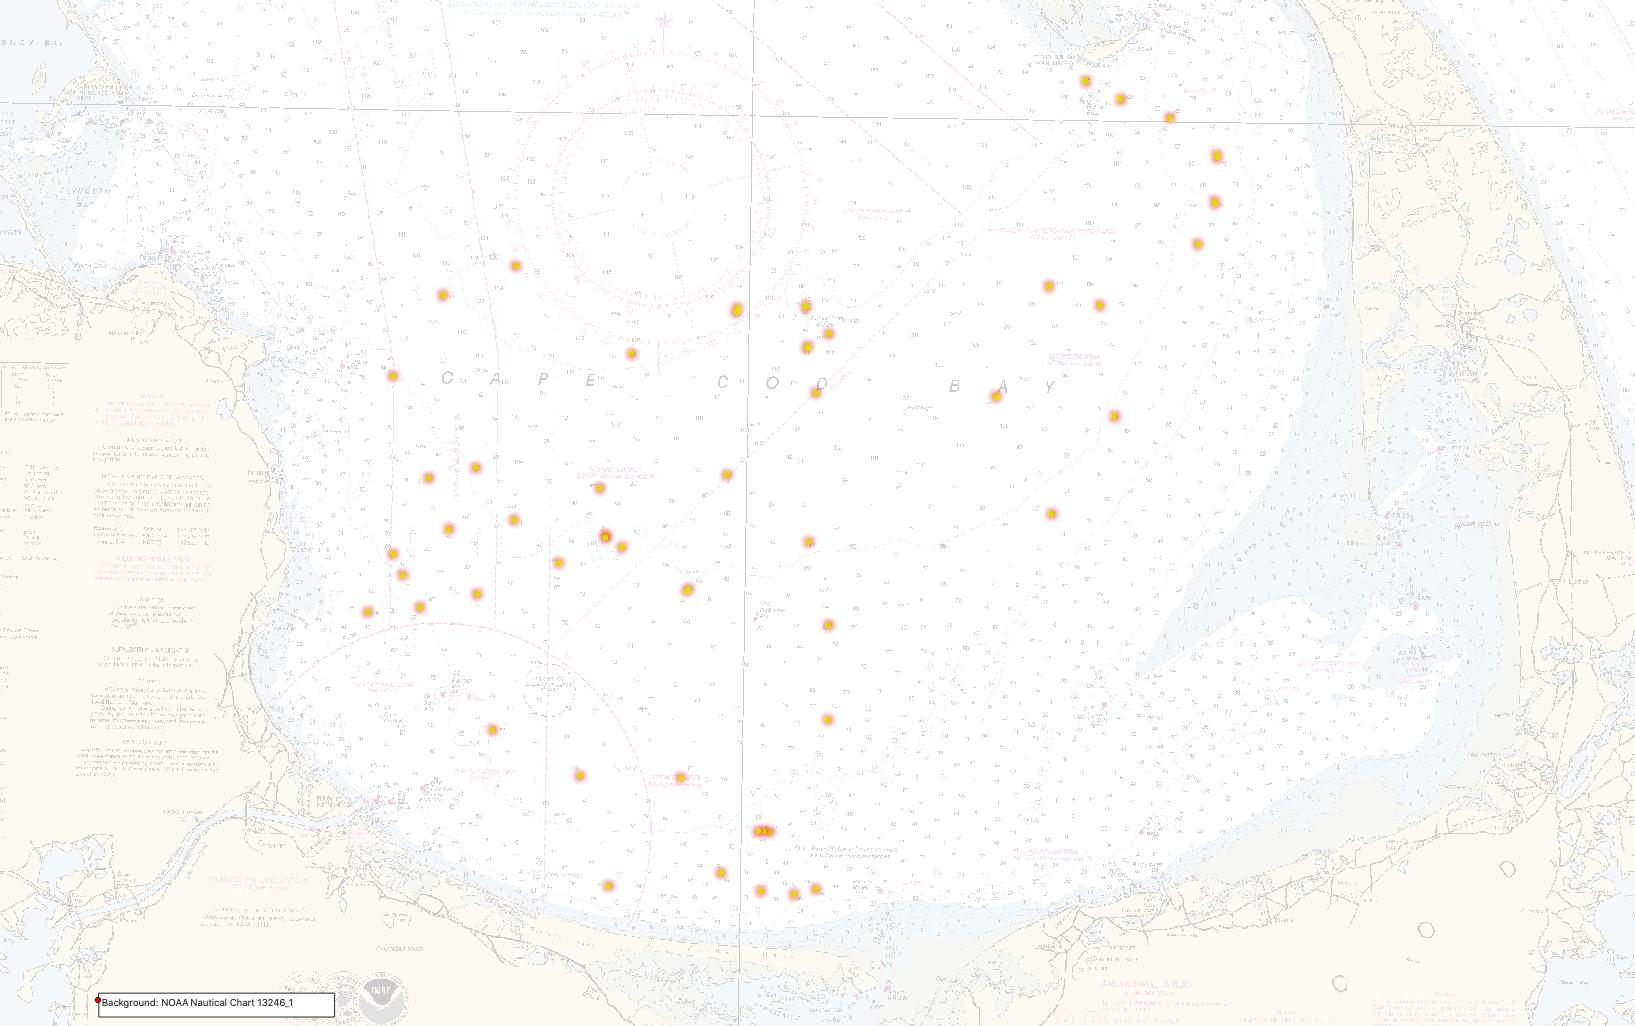
Locations and grain-size analysis results of sediment samples collected in Cape Cod Bay, Massachusetts, in September 2019 by the U.S. Geological Survey during field activity 2019-034-FA (point shapefile and CSV file, GCS WGS 84, MLLW vertical datum)
This dataset provides access to the locations and grain-size analysis results of surficial sediments collected with a modified Van Veen grab sampler on the Mini SEABed Observation and Sampling System (MiniSEABOSS) aboard the Research Vessel (R/V) Tioga during USGS field activity 2019-034-FA (September 17 and 19, 2019). The sediments were analyzed using the Beckman Coulter Multisizer 3 and sieving of the >= 4-phi fraction. These data were collected to characterize the sea floor by identifying sediment texture and to ground-truth acoustic data collected during USGS field activity 2019-002-FA.
Data Files
2019-034-FA_samples.zip - 11.9 KB
Metadata Files
2019-034-FA_samples_meta.xml - 75.5 KB
2019-034-FA_samples_meta.txt - 75.3 KB
Supplemental Files
-
Links_to_previous_USGS_reports.txt
- 1.0 KB
Link to previous USGS-MassCZM Open-File Reports and data release adjacent to the 2019 survey area
- revision_history.txt - 1.4 KB
- 2019-002-FA - View Details
- 2019-014-FA - View Details
- 2019-034-FA - View Details
Related Field Activities
Suggested Citation
Ackerman, S.D., Foster, D.S., Andrews, B.D., Danforth, W.W., Baldwin, W.E., Huntley, E.C., Worley, C.R., and Brothers, L.L., 2022, High-resolution geophysical and geological data collected in Cape Cod Bay, Massachusetts during USGS Field Activities 2019-002-FA and 2019-034-FA (ver. 2.0, September 2022): U.S. Geological Survey data release, https://doi.org/10.5066/P99DR4PN.
Revision History
First release: 2022
Revised: September 2022 (ver. 2.0)
Changes in Version 2.0
1) An existing dataset was modified: "Multibeam bathymetric data collected in Cape Cod Bay, Massachusetts during USGS Field Activity 2019-002-FA, using a dual-head Reson T20-P multibeam echo sounder (32-bit GeoTIFF, UTM Zone 19N, NAD 83, MLLW Vertical Datum, 5-m resolution)" had erroneous interpolation applied to the final bathymetry raster. These data were corrected and an additional process step was added to the metadata file to describe the change as well as document the revision and update the larger work citation. The revised GeoTIFF and associated metadata file have the same filenames as the originally published dataset.
Overview Image