Liquefaction Potential of Native Ground in West Kobe, Japan by the Spectral Analysis of Surface Waves (SASW) MethodRobert Kayen,1 Yasuo Tanaka,2 Tadahiro Kishida3 and Shigetoshi Sugimoto41 [email protected],, United States Geological Survey, MS-999, 345 Middlefield Road, Menlo Park, CA 94025, USA & Visiting Professor, Kobe University, RCUSS, Kobe, Japan, 2001-2002.2 [email protected],, Professor, Kobe University, RCUSS, 1-1 Rokko Dai, Nada Ku, Kobe, 657-8501 Japan. 3[email protected], Graduate Student, University of California, Department of Civil and Environmental Engineering, One Shields Avenue, Davis, CA 95616-5294 USA. 4Graduate Student, Kobe University, RCUSS, Kobe, 657-8501 Japan. 8TH US-Japan Workshop on Earthquake-Resistant Design of Lifeline Facilities and Countermeasures Against Soil Liquefaction, December 16-18, 2002, Tokyo, Japan CONTENTS: Abstract This paper presents the results of a shear wave velocity investigation of native ground liquefaction test sites in West Kobe, Japan using a relatively new form of the Spectral Analysis of Surface Waves (SASW) method. This method uses a frequency-controlled swept-sine source rather than the traditional random noise source consisting of a dropped weight or impact-hammer. This small study was a collaborative effort between the Japan Railway-West (JR), Kobe University, and the United States Geological Survey (USGS) to evaluate the characteristics of ground failure sites along the JR right-of-way in the Wadamisaki District of Kobe. The testing and analysis presented here part of a much larger ongoing liquefaction assessment study using SASW, for which we have already investigated approximately 200 sites in Japan, Taiwan, and the USA. In the Wadamisaki District, the native beach soil deposit which suffered liquefaction damage during the 1995 Kobe Earthquake is part of the distal end of a suite of narrow distributary alluvial fans that emanate from the south slope of the Rokko Mountains. The native alluvial zone stretches through the city approximately 20 km in the east-west direction and is about 2 km wide on average. In the Wadamisaki district, the south and north ends of the JR right-of way suffered liquefaction and related settlements, whereas the central portion of the district near the railroad alignment was not affected. From November 2001 until March 2002, we investigated 11 sites in the Wadamisaki District, along the JR-West right of way. We found that the liquefied areas in the southern portion of the right-of-way corresponded to a gravely-sand alluvium that is slightly lower in shear wave velocity than the central and northern portion of the right-of-way. These data from liquefied sites plot very close to the current recommended NCEER boundary curves. With the larger shear wave velocity data set from Japan, Taiwan, China and the USA, our objective is to gather enough data from high-ground-motion-intensity sites to fully characterize the upper cyclic-stress-ratio region of the liquefaction-resistance boundary During the Japanese 2001-2002 academic year, we began a field investigation to gather shear wave velocities at sites that previously experienced liquefaction in Asia and the USA with the goal of significantly expanding the worldwide catalog of velocity profiles for liquefaction resistance correlation. Of the many noteworthy observations of Andrus and Stokoe [1], in their assessment of the available data set, was the paucity of shear wave velocity data in the cyclic stress ratio (CSR) region above 0.3. This is especially the case at high shear wave velocities near the area where the liquefaction resistance boundary likely resides. Historically, liquefaction events of high CSR are concentrated in Japan and Taiwan, especially in the Tohoku region; the island of Hokkaido; Fukui City; Kobe City; and the Central Taiwan cities of Wufeng and Nantou, proximal to the Chi Chi fault. Most of these sites have not been comprehensively evaluated by shear wave velocity methods.
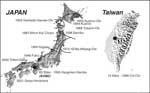
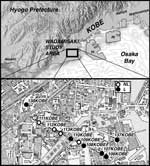
To expand the existing shear-wave-velocity data set to include these high-ground-motion-intensity sites, we are using the Spectral Analysis of Surface Waves (SASW) method which is a relatively new, non-invasive field approach for evaluating the shear-wave-velocity characteristics of soil [2]. SASW is particularly useful for rapid, lightweight, high-resolution surveys of the near surface, as well as for profiling difficult materials such as gravely deposits and stiff soil where conventional truck-based penetration methods are not practical. SASW apparatus can be deployed at locations impossible to reach by vehicle or truck. The equipment easily fits in an automobile, is deployed by hand, and can be operated by just one person. Using this method it is possible to routinely produce detailed shear wave velocity profiles of the upper 30 meters of the soil column. In 2001-2002, while the first author was visiting Kobe University on sabbatical, we profiled 182 sites that experienced liquefaction or have not experienced liquefaction in Japan and Taiwan by SASW (Figure 1). Nearly all of well-documented liquefaction sites in Japan and Taiwan, originally evaluated by conventional penetration apparatus, were re-evaluated using SASW in our study. Earthquake-induced liquefaction events in our study date from the most recent large damaging events in Japan and Taiwan (2001 Geiyo and 1999 Chi Chi, respectively), back to the disastrous 1948 Fukui earthquake. These liquefaction events, and the sites tested, represent the majority of the world’s well-documented case histories of liquefaction occurrence in modern times. An important focus of our study is to test sites that straddle the liquefaction resistance boundary, and especially seek out relatively stiff native soil sites exposed to high intensity motion (e.g. Hyogoken-Nambu 1995; Hokkaido Nansei-Oki 1993; Chi Chi, 1999; Fukui 1948; Kushiro-Oki 1993). The data from this study will allow us to reevaluate the shear wave velocity-based liquefaction resistance curve in light of a global data set. PILOT STUDY: WADAMISAKI DISTRICT of WEST KOBE, JAPAN In this paper, we present a pilot study that helped refine our field and data processing procedures for the acquisition of the larger data set. The West Kobe study data represent about 5% of the field sites visited in 2001-2001. The Wadamisaki district is in the Hyogo Ward of Kobe City, an area badly affected by the Mw=6.8 Hyogo-Nambu (South Hyogo Prefecture) earthquake that struck in the early morning of January 17, 1995 [3, 4]. The fault rupture occurred on a northeast trending structure extending from Awaji Island to the south west, through the Cities of Kobe, Ashiya and Nishinomiya to the Northeast on the main island of Honshu. The surface expression of the fault is several kilometers to the north of our study area. The seismic intensity maximum was JMA-VII (equivalent to MMI = X~XII) in a near source zone approximately 2 to 3 km in width, and centered approximately 2 km south of the fault trace. This zone stretched 40 km or so, fault parallel, along the margins of Osaka Bay. Our study area is located on the southern side of the high intensity zone, in a densely populated neighborhood comprised of shoreline industrial and port facilities, multi-storey apartment structures and one- and two-storey residential housing (Figure 2). In the north end of the Wadamisaki District along the Hanshin Expressway, the strong-motion intensity is estimated to have been approximately 0.6g, based on the recorded motion of 0.64g at the JR Takatori Station [3,4]. The district is situated on an alluvial fan distributing eroded granitic soil from the south slope of the Rokko Mountains. The Holocene fan thickness in the study area is typically 6-10 meters and overlies Pleistocene Osaka Bay mud and alluvium. Due to the steeply dipping granite of the coastal mountains, the soil depth above bedrock is unknown and estimated to be in the range of 1000 to 1500 meters beneath our study area [5]. Man-made coastline and islands, south of our study area, have extended the southern reaches of the city into Osaka bay. These deposits are generally highly liquefiable soil-fills. Our study is focused on the Holocene alluvial deposits in the uppermost 10 meters of the soil column, above the most recent Pleistocene marine unit. Native soil beneath the southern portion of the district near the JR Wadamisaki Station (site 106KOBE and 107KOBE) and later-built Kobe Wing-Dome (near and south of 108KOBE) and northern portion near and north of the Hanshin Expressway (138KOBE) suffered marginal liquefaction damage and minor settlements. Lateral deformations along the survey line were negligible. The central portion of the district, in the area immediately north and south of the Hyogo Canal (the canal is between 113KOBE and 110KOBE), was not affected by liquefaction with the exception of very small and localized sand venting. The general geotechnical characteristic of the upper 10 meters is of native alluvium that varies in liquefaction susceptibility and straddles the liquefaction resistance boundary at very high levels of earthquake loading.
The Spectral-Analysis-of-Surface-Waves (SASW) method is a relatively new seismic tool to evaluate the stiffness characteristics of soil deposits. SASW is especially useful for profiling gravelly deposits where sampling is difficult and penetration tests fail to characterize or quantify soil properties [6, 7, and 8]. Surface wave methods are perhaps among the most efficient field tests for profiling the near surface, principally because all measurements are made at the ground surface, are non-invasive; and result in a highly detailed-shear wave model of the ground. Unlike drilling and probing methods, SASW apparatus is lightweight, portable, easily deployable by one or two people, and typically requires no permitting to perform. Under vertical excitation of the ground, surface waves carry 2/3 of the total radiated energy, and thus carry the highest particle motion amplitudes.
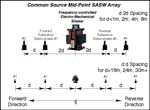
Dispersive surface waves are waves that vary in velocity with respect to frequency. The dispersive nature of surface waves forms the basis of the SASW method, as the dispersion is a direct result of heterogeneity of the sub-surface velocity structure. During the SASW test, field measurements of surface wave dispersion are recorded using multiple arrays of seismometers. Our field configuration for SASW uses a computer-controlled electromechanical shaker as the mid-point of the array (i.e., Common-Source Midpoint), and four seismometers arrayed in pairs of two and aligned in opposite directions of the source (Figure 3). We use an APS-Dynamics shaker that can produce sinusoidal waves from to 1-1000 Hz (note: any use of trade names or products does not imply endorsement by the U.S. Government). Using a low frequency shaker-source allows for deeper penetration of surface waves and elevated signal-to-noise ratio as compared with a conventional random-noise hammer source. We use the shaker to produce controlled vertical vibrations between 1-150Hz. The 1-Hz Kinemetrics receivers we use are designed for capturing vertical motions and cover the frequency range of interest in the active-source surface-wave test. For each source-receiver configuration, surface waves are generated by the shaker, whose motion is controlled by an output waveform from the spectral analyzer. An amplifier boosts the analyzer signal in order to drive the electromechanical motor in the shaker. The receivers measure the waves and a fast Fourier transform (FFT) is performed on each of the four receiver signals. In near-real-time, the linear spectra, cross power spectra, and coherence are computed. The ability to perform near real-time frequency domain calculations and monitor the progress and quality of the test allows us to adjust various aspects of the test to optimize the capture of the phase data. These aspects include the source-wave generation, frequency step-size between each sine-wave burst, number of cycles-per-frequency, total frequency range of all the steps, and receiver spacing. The common receiver midpoint geometry of Nazarian and Stokoe [2] was not used here, given the weight of the electromechanical shaker. Rather, we adopted common source-midpoint geometry. That is, we placed the source at the centerline of the survey so that the forward and reverse direction dispersion curves were equidistant from the source for each given array spacing. Several different spacings of receivers are used in the field, and the dispersion curves for each spacing, both in forward and reverse directions, are merged to build a site-dispersion plot. Spacing of receivers used at the Wadamisaki sites stepped geometrically from 1 meter to 24 or 32 meters. The two seismometers are separated by a given distance, d, and the source is usually placed at a distance of 2d from the first [9] seismometer. As the test progresses from capturing high frequency data to lower frequency data, the array separation increases until the d:2d spacing becomes impractical either due to space limitations or the attenuation of longer period surface waves. Typically at source distances equal or greater than 16m, the array spacing was changed to d:d. Sanchez-Salinero et al. (1987) investigated the variations in the measured dispersion curves given various ratios of d:nd and found that n-values between 1 and 2 were a good compromise between problems associated with near-field effects and wave attenuation. Given the array separation, the phase of the cross power spectrum is used to calculate the relation between Rayleigh-wavelength and frequency (lambda spectra), and the wavelength and frequency are, in turn, used to compute the phase velocity curve. A simple empirically based method is used in the field to make an initial approximation of the shear wave velocity profile, where one-third the wavelength, LIQUEFACTION ASSESSMENT and VELOCITY DETERMINATION Preparing data for the liquefaction analysis involved normalizing the shear wave velocity following the standard procedure outline in NCEER-Workshop guidelines [14], and selecting critical layers based on SPT data. The objective of the overall project is to expand the shear-wave-velocity data-set for liquefaction sites. Thus, it is important to independently estimate the thickness of the liquefied layer and fines contents using penetration data so that there are external controls on the selection of representative shear wave velocities. At the Wadamisaki district sites, we used a large suite of SPT logs cataloged and available in the KOBE JIBANKUN Geographic Information System (GIS) [15] to independently evaluate stratigraphy, liquefaction potential, and target the depth-range of the representative shear-wave velocity of the liquefaction layer. These logs were also processed using the NCEER-Workshop guidelines [14]. Grain-size distributions for the critical layer were surprisingly uniform along the alignment and had a mean fines-content (<0.074mm) of 8.3% and a standard deviation of 2.8%. We found the association between locations predicted to liquefy using the NCEER-Workshop guidelines for SPT and the actual surface observations presented in the maps of Hamada et al. [16] to be excellent. That is, based on surface observations, the Workshop-SPT guidelines correctly predicted liquefaction potential.
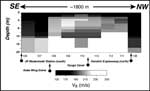
Shear wave velocities along the JR Wadamisaki corridor are plotted as a GIS image in Figure 4. The survey station numbers extend from the south-east end of the line at Wadamisaki Station (Site 106KOBE), to the railroad curve just north of the Hanshin expressway, a distance of 1800 meters (site 138KOBE). The profiles typically show an increase in shear wave velocity to a depth of approximately 3-to-5 meters, and beneath it a somewhat uniform velocity zone within the Holocene sand deposit to a depth of approximately 7-9 meters. Below the Holocene sand is a lower velocity estuarine mud deposit and a deeper and higher velocity Pleistocene alluvium. The shear wave velocities do indicate that the southern portion of the transect has lower velocities in the Holocene sand deposit than does the northern portion. The velocities are consistent with observations that the southern part of the railway right-of way had surface evidence for liquefaction, whereas the portion north of the Hyogo canal and south of the Hanshin Expressway largely did not [16]. Thus velocities of the non-liquefied and liquefied ground along the corridor, thus, seem to have straddled the liquefaction-triggering boundary during the Hyogo-Nambu event. The effective stress-normalized velocities of the critical layers identified using the SPT approach are presented in figure 5. The velocities of the sites are presented as solid (liquefied) and open (non-liquefied) circles, along with 1 standard deviation ellipses. CSR values are based on the peak ground acceleration recorded at the JR Takatori Station (0.64g) and attenuated for increasing source distance using the model of Boore, et al. [17]. For the Wadamisaki sites, data points transition into the liquefied zone at approximately 215-220 m/s. This velocity range is very close to the range proposed by Andrus and Stokoe [1] for soils having fines contents at or below 5 % (215 m/s).
This paper presents procedures we are using to expand the world-wide data set of shear wave velocities measured at liquefaction test sites. The elements of the method are to catalog the locations of reported liquefaction test sites and gather available conventional penetration resistance profiles; identify critical layers and their textural characteristics; re-test sites by SASW; and, finally, apply the penetration data-based critical layer range to the SASW velocity profiles to select representative shear wave velocities. The primary objective of our data collection phase is to expand the data set for shear wave velocities at high CSR sites. Combining the 182 sites in Japan and Taiwan with our USA sites, and prior case histories [1], we will re-evaluate the shear wave-based liquefaction resistance curves within both a deterministic and Bayesian probabilistic framework. Here, we present an example data set, approximately five-percent of our tested sites, and describe how the data are collected and processed. The Wadamisaki sites are typical of many of the locations we tested in Japan and Taiwan that bridge the liquefaction resistance boundary at high CSR in the low two hundred meter-per-second range. In this study we found that the SASW field and data processing approach worked well to characterize the shear-wave-velocity of the ground, and that the use of an independent data set of penetration logs allowed us to select critical layers in an unbiased manner. It is our hope that with the entire data set of 200+ locations evaluated this way, we will be able to populate enough data points in the region of high CSR and high shear wave velocity to constrain the boundary curve in this important region of the liquefaction resistance curve. Components of this work were supported by the United States Geological Survey; the Pacific Earthquake Engineering Research Center (PEER); Pacific Gas and Electric Company (PG&E); and a USGS Cooperative Research and Development Agreement with Kobe University, Japan. Prof. Ken Stokoe II and Leo Brown provided the USGS with considerable field and data processing advice, as well as SASW hardware recommendations, during Brown’s visit to Menlo Park. The thoughtful reviews of Homa Lee and Stephanie Ross are appreciated. [1] Andrus, R.D. and Stokoe, K.H., II, Liquefaction Resistance of Soils From Shear-Wave Velocity, Journal of Geotechnical and Geoenvironmental Engineering, American Society of Civil Engineers, Vol. 126, No. 11, November 2000, pp. 1015-1025. [2] Nazarian, S. and Stokoe, K. (1984) In Situ Shear Wave Velocities from Spectral Analysis of Surface Waves, Proceedings, Eighth World Conference on Earthquake Engineering, San Francisco, California, Vol. III, pp. 31-39, 1984 [3] Ejiri, J., Sawada, S., Goto, Y., and Toki, K. (1996) Peak Ground Motion Characteristics. Special Issue on Geotechnical Aspects of the January 17, 1995 Hyogoken-Nambu Earthquake, Soils and Foundations, p. 7-13. [4] Oka, F., Sugito, M., Yashima, A. Taguchi, Y. and Sekiguchi, K. (1996) Analysis of strong motion records from the South Hyogo earthquake of January 17, 1995. Engineering Geology, V. 43, 85-106. [5] Fujita, K. and Maeda, Y. (1984) Geology of the Suma district. Geological Survey of Japan (in Japanese). [6] Stokoe, K. and Nazarian, S. (1985) Use of Rayleigh Waves in liquefaction Studies, in, R.D. Woods, ed., Measurement and use of Shear Wave Velocity for Evaluating Dynamic Soil Properties. ASCE, New York, 1-17. [7] Stokoe, K., Nazarian, S., Rix, G.J., Sanchez-Salinero, I. Sheu, J.-C., Mok, Y.J. (1988) In situ Seismic Testing of Hard-to-Sample Soils by Surface Wave Method. Earthquake Engineering and Soil Dynamics II - Recent Advances in Ground-Motion Evaluation, Geotech. Spec. Pub. No. 20, J.L. Von Thun, ed., ASCE, New York, 264-289. [8] Tokimatsu, K. (1997) Geotechnical site characterization using surface waves. K. Ishihara, ed. Earthquake Geotechnical Engineering, Balkema Press, Rotterdam, p. 1333-1367. [9] Sanchez-Salinero, I., Roesset, J.M., Shao, K-Y., Stokoe, K.H., Ii, Rix, G.J. (1987) Analytical Evaluation Of Variables Affecting Surface Wave Testing Of Pavements, Transportation Research Record No.1136, Pp.86-95. [10] Gazetas, G. and Yegian, M.K. (1979) Shear and Rayleigh Waves in Soil Dynamics, Journal of the Geotechnical Engineering Division, ASCE,105(12), 1455-1470. [11] Haskell, N.A. (1953) The Dispersion Of Surface Waves On Multilayered Media, Bulletin Of The Seismological Society Of America, Vol.43, Pp.17-34. [12] Thomson, W.T. (1950) Transmission Of Elastic Waves Through A Stratified Solid Medium, Journal Of Applied Physics, Vol.21, Pp.89-93. [13] Heukelom, W., Foster, C.R. (1962) Dynamic Testing Of Pavements Transactions A.S.C.E., Vol.127, Part 1, p.425-451. Discussion, p.451-457. [14] Youd, T.L., Idriss, I.M. Andrus, R.D. Arango, I., Castro, G., Christian, J.T., Dobry, R., Liam Finn, W.D.L., Harder, L.F., Jr., Hynes, M.E., Ishihara, K., Koester, J.P., Liao, S.S.C., Marcuson, W.F., III, Martin, G.R., Mitchell, J.K., Moriwaki, Y., Power, M.S., Robertson, P.K., Seed, R.B., Stokoe, K.H., II, 2001, Liquefaction Resistance of Soils: Summary Report from the 1996 NCEER and 1998 NCEER/NSF Workshops on Evaluation of Liquefaction Resistance of Soils, ASCE, Journal of Geotechnical and Geoenvironmental Engineering, V. 127, No. 10, p 817-833 [15] Tanaka, Y. And Okimura, T. (2001) In-Depth Geotechincal Data Base: Kobe Jibankun For Seismic Hazard Study. Workshop on Archiving and Web Dissemination of Geotechnical Data, Consortium of Organizations for Strong Motion Operating Systems, Pacific Earthquake Engineering Research Center, PEER, October 4-5, 2001. [16] Hamada M., Isoyama, R., and Wakamatsu, K. (1995) The 1995 Hyogoken-Nambu (Kobe) Earthquake: Liquefaction, Ground Displacement and Soil Condition in the Hanshin Area. Assoc. for Development of Earthquake Prediction, Tokyo, 194 p. [17] Boore, D. M. Joyner, W.B. and Fumal, T.E. (1997) Equations for Estimating Horizontal Response Spectra and Peak Acceleration from Western North American Earthquakes: A Summary of Recent Work, Seismological Research Letters, 68, January/February. |
geotech/liquefaction/index.html
contact Robert Kayen
last modified 2003