
The Loma Prieta, California, Earthquake of October 17, 1989--LiquefactionSOIL LIQUEFACTION IN THE EAST BAY DURING THE EARTHQUAKEBy Robert E. Kayen, U.S. Geological Survey;
|
| Figure 1: San Francisco east-bay shoreline, showing locations of sites where liquefaction-induced damage occurred from 1989 Loma Prieta earthquake and of study sites where soil investigations were performed. Click on figure for larger image (60K). |  |
Peak horizontal accelerations at sites underlain by rock and stiff alluvium in the east bay generally ranged from 0.08 to 0.12 g, but amplification due to the presence of soft, deep cohesive-soil deposits underlying artificial fills produced peak accelerations from 0.11 to 0.29 g at strong-motion-recording stations located on these fills. Peak accelerations near most of our study sites (see fig. 1) can be estimated from strong-motion records obtained near the east-bay shoreline. On the basis of available strong-motion data (Shakal and others, 1989; Kayen and others, 1992), the peak horizontal accelerations on bayshore fills in the vicinity of Oakland International Airport and Bay Farm Island were apparently about 0.27 g, and at the San Francisco- Oakland Bay Bridge Toll Plaza and the Port of Oakland's Marine Container Terminal at Seventh Street probably about 0.28 to 0.29 g. Arias intensities, integrated from the strong-motion records, ranged from 0.8 m/s at Oakland International Airport, Bay Farm Island, and Alameda Naval Air Station to 1.71 m/s at the Port of Oakland's Marine Container Terminal at Seventh Street and the San Francisco-Oakland Bay Bridge Toll Plaza.
At the Port of Richmond, the most northerly study site, no nearby strong-motion recordings were obtained for sites with similar soil conditions. Approximately 2 km to the north, however, a peak horizontal acceleration of 0.13 g on the south component was recorded at Richmond's City Hall. We used this record, from California Division of Mines and Geology's California Strong Motion Instrumentation Program (CSMIP) strong-motion-recording station 58505, to model the site response at the Port of Richmond study site, where soft, deep cohesive-soil deposits underlie artificial fill, by means of one-dimensional equivalent-linear seismic site-response analyses, using the computer program SHAKE90 (a modified version of the computer program SHAKE; Schnabel and others, 1972). These results indicate that peak horizontal accelerations at the Port of Richmond were probably about 0. 18 g. Synthetic seismograms from the SHAKE90 analysis were integrated, and we estimate the Arias intensity at the Port of Richmond site to be approximately 0.6 to 0.7 m/s.
Standard penetration tests (SPT) were performed in shallow 10-cm (4 in.)-diameter uncased rotary-wash boreholes drilled with CME model 450 and 750 drill rigs, following the guidelines of the American Society for Testing and Materials (1984). SPT-energy calibrations, using the stresswave method (Farrar, 1991), were made on a CME model 450 drill rig to adjust the field-measured standard penetration resistance, N, to a normalized 60-percent-hammer-efficiency blowcount, (N1)60.
The electronic cone-penetration tests (CPT's) followed the procedures of the American Society for Testing and Materials (1986a). Liquefaction analyses were made by using the methods of Robertson and Campanella (1985), Robertson (1986, 1990), Shibata and Teparaksa (1988), and Mitchell and Tseng (1990). The cone apparatus used has a standard cross-sectional area of 10 cm2 and a standard 60º apex tip. A pore-pressure transducer and a porous stone were mounted directly behind the cone, followed by a standard 150-cm2-area friction sleeve. Mounted above the sleeve is a single-component accelerometer that was used to measure the velocities of shear waves (Vs) propagating vertically from the ground surface down to the cone tip. Shear-wave measurements were made by using the seismic-CPT method of Robertson and others (1986).
The friction ratio, FR, is calculated as the measured sleeve friction, fs normalized by the overburden-stress-corrected tip resistance, (qc- 'vo) (Wroth, 1984),
 |
(1) |
and the pore-pressure ratio, Bq, is calculated as the measured deviation of pore pressure from hydrostatic normalized by the overburden-stress-corrected cone-tip resistance (Wroth, 1984),
 |
(2) |
where qc is the cone penetration tip resistance, vo is the total overburden stress, u is the measured pore-water pressure, and uo is the hydrostatic pressure at the same depth.
Soil liquefaction occurred at a study site in the western part of Richmond Inner Harbor, as shown in figure 2. The area that liquefied is a zone approximately 75 m wide and 300 m long at the foot of Harbor Way Road (10th Street). Approximately 85 km north of the Loma Prieta rupture zone, this site represents the most distant point from the zone of energy release to undergo soil liquefaction sufficient to damage structures. Much of the land at the edges of the Richmond Inner Harbor had been created by placement of uncompacted sandy hydraulic fill. The liquefaction zone overlies deposits of soft bay mud, which are underlain, in turn, by deeper deposits of stiffer, overconsolidated noncohesive and cohesive soils that naturally fill a deep fluvial channel at the west end of the harbor. Thus, the deposits at this site are thicker than those of the Richmond Inner Harbor to the east, and these thicker deposits amplified the level of ground motion at this site and so contributed to the observed soil liquefaction (Seed and others, 1990). The study site runs along the west wall of the former Ford Motor Co. Plant (now closed) and westward across an undeveloped field. Four large and a dozen smaller sand boils vented fine sand and silty sand from the underlying fill (fig. 3). In addition, minor settlements of approximately 2 to 8 cm and lateral spreading of similar magnitude occurred at the edge of the harbor adjacent to a small pile-supported dock at the Tweed Towing/Maas Boats facility. Ground settlement and minor lateral spreading, both of as much as 8 to 10 cm, were observed at the dock of Tweed Towing. The abandoned warehouse adjacent to the study site, an unreinforced-masonry structure, was considerably damaged during the earthquake. The absence of damage to several other similar masonry structures in the Richmond Inner Harbor area may indicate that the Ford Plant area sustained unusually high localized levels of ground shaking, owing to the underlying alluvial-channel deposits.
| Figure 2: Port of Richmond and Inner Harbor Basin, showing locations of boreholes (dots). Click on figure for larger image (64K). |  |
| Figure 3: Sand boils on undeveloped land at end of Harbor Way Road in the Port of Richmond. Click on figure for larger image (52K). | 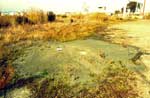 |
Near the end of the main shock, Liela Tweed, proprietor of Tweed Towing, exited the structure adjacent to the dock and observed, first, the collapse of the south wall of the Ford Motor Co. Plant and the shattering of windows along the west wall, and then the active issuing of water and sand from the ground in the places shown in figure 4. She noted that active seepage from these sand boils continued for as long as 24 hours. SPT and CPT data from the site indicate that a surficial deposit of tan-brown silty clay, 1.8 to 4.1 m thick, that overlies the liquefiable sandy hydraulic fill at this site probably served as a drainage barrier preventing more rapid venting of excess pore pressures.
The locations of three boreholes (POR-2 through POR-4) drilled in the open space north of the Tweed Towing building are shown in figure 2. The first borehole, POR-1, was abandoned after a computer malfunction. SPT's were performed in shallow boreholes adjacent to each CPT. The logs of the boreholes drilled at the Port of Richmond study site (figs. 2) are similar and are characterized in the upper part of the section by an oxidized, tan-brown crusted silty sand to 0.8-m depth; oxidized tan-brown silty sand to 1.8-m depth; and oxidized, tan-brown sandy clay to reduced sandy clay to 4.1-m depth (fig. 4). The water table was approximately at a depth of 2.5-m during sampling. This section has low qc values (approx 1-3 MPa), FR values greater than 3 percent, minor pore-pressure generation, and N values ranging from 1 to 6 blows/ft.
| Figure 4.--Log of borehole POR-2 in fill deposits at Port of Richmond study site (see fig. 2 for locations). Click on figure for larger image (56K). |  |
Below this section, at 4.1- to 7.8-m depth, is a hydraulic-fill layer of olive-gray fine-silty sand containing shell fragments. This layer almost certainly was responsible for the observed liquefaction at the surface, and surface sandboil material is identical to SPT samples of this layer. This layer has extremely low qc values (1-3 MPa), average FR values of 0.3 to 1.0 percent, and minor porepressure generation during cone penetration, and N values of 2 to 11 blows/ft but typically 2 to 5 blows/ft when evaluating all three borehole logs. Vs values in this layer typically range from 140 to 170 m/s. Below this layer is a thin deposit of soft bay mud to 9.5-m depth, underlain by dense sand deposits. Detailed descriptions of the borehole logs from all the study sites, including those, discussed herein, were presented by Kayen and others (1992), Kayen (1993), and Mitchell and others (1994).
The San Francisco- Oakland Bay Bridge mole (peninsula-approach fill), immediately south of Emeryville (figs. 1, 5), was extensively damaged by soil liquefaction.
| Figure 5.--Emeryville-Oakland shoreline, showing locations of boreholes (dots) near San Francisco-Oakland Bay Bridge Toll Plaza and Port of Oakland's Marine Container Terminal at Seventh Street. Click on figure for larger image (88K). |  |
Appreciable settlement (max 40 cm) occurred over most of the mole. In some places, differential settlements produced an uneven, hummocky surface with permanent "waves" as large as 15 cm. in amplitude. Lateral spreading also was significant along most of the fill, causing numerous longitudinal fissures in the pavement parallel to the fill edges. Many of these fissures exuded fine sand and silty sand, and numerous additional sand boils erupted along the median strip of the roadway, as well as off the shoulders of the roadway in undeveloped land at the bay's edge. The fissures-opened to widths of approximately 7 to 8 cm and exhibited maximum differential vertical offsets of 3 to 5 cm (fig. 6). Liquefaction-induced settlement adjacent to the east side of the Toll Plaza administration building is shown in figure 7. The building itself, which is pile supported, was not seriously damaged by liquefaction, although settlement of the surrounding fill hindered access to the building and affected buried utilities.
| Figure 6.--Fissure in pavement caused by settlement in rightmost eastbound lane of Interstate Highway 80 west of San Francisco-Oakland Bay Bridge Toll Plaza administration building (visible in distance). Click on figure for larger image (28K). | 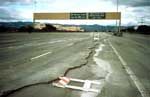 |
| Figure 7.--Settlement at the east side of the San Francisco-Oakland Bay Bridge Toll Plaza administration building. Click on figure for larger image (28K). |  |
Settlements of the mole and the elevated structures of Interstate Highway 580 and West Grand Avenue were severe, resulting, at each site, in pavement collapse and open fissures, as much as 0.3 m wide, at the soil-structure interface. The approach mole also settled below the bridgeand ramp-structure road level by as much a 0.5 m. The fissures and uneven pavement surface interrupted ground transportation in the interchange areas after the earthquake. Soil liquefaction was also observed adjacent to the piers of elevated-highway distribution structures (fig. 8).
| Figure 8.--Sand boils beneath elevated West Grand Avenue distribution structure adjacent to Interstate Highway 80 east of San Francisco-Oakland Bay Bridge Toll Plaza. Click on figure for larger image (28K). | 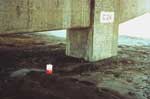 |
The logs of five boreholes drilled at the San FranciscoOakland Bay Bridge Toll Plaza study site suggest a more complex stratigraphy than at the Richmond testing site. Five sets of logs were taken at places along the median strip and open space between the eastbound and westbound lanes of Interstate Highway 80, as shown in figure 5. Sand boils, lateral spreading, or settlement was observed in each place, as discussed below.
The log of borehole SFOBB-1 (fig. 9) was taken at the easternmost end of the Toll Plaza parking lot. This log indicates essentially no piezocone pore-pressure generation during cone penetration until bay mud was reached at 15-m depth. The log is marked by a moderately dense surface crust between 0- and 2.8-m depth, followed by an apparently interbedded sequence of cohesionless silty sand and cohesive clay to 4.5-m depth, as noted by the local variations in FR and qc values. The water table during sampling was in the upper part of the section at approximately 2-m depth. Between 4.5- and 7.5-m lies cohesionless material with low qc values averaging 5 MPa and N values of typically 5 to 17 blows/ft, with a maximum N value of 28 blows/ft at 5.2-m and a minimum N value of 0 blows/ft (drill rod and hammer sank under their own weight) at 6.6-m depth. This layer appears to have been responsible for the observed liquefaction, on the basis of both inplace testing and correlation with surface sand-boil material.
| Figure 9.--Log of borehole SFOBB-1 on east shoreline of San Francisco-Oakland Bay Bridge mole (see fig. 5 for location). Click on figure for larger image (64K). |  |
The logs of two boreholes, SFOBB-3 and SFOBB-4 (see Mitchell and others, 1994), drilled in the central part of the median strip directly south of the Toll Plaza and maintenance buildings, show similar soil profiles. The upper 4-m sections of these two logs suggest moderately loose sand (qc=5-15 MPa) interbedded with finer materials. Below, there is a somewhat-uniform, more sand rich deposit to 8-m, with qc values of typically 4 to 15 MPa. This layer appears to be the principal liquefied layer. No SPT measurements were made at boreholes SFOBB-3 and SFOBB-4.
The logs of two boreholes, SFOBB-2 and SFOBB-5 (log of SFOBB-5 is shown in fig. 10), in a wooded area at the west end of the median strip show gravelly sand to 6-m depth beneath a dense crust. From 6- to 8.5-m depth is a layer of silty and sandy soil, with qc values of 5 to 10 MPa and N values of 7 to 19 blows/ft, within which liquefaction apparently occurred.
| Figure 10.--Log of borehole SFOBB-5 on east shoreline of San Francisco-Oakland Bay Bridge mole (see fig. 5 for location). Click on figure for larger image (60K). |  |
Immediately south of the San Francisco-Oakland Bay Bridge, soil liquefaction caused considerable damage to marine-container facilities at several places in the Port of Oakland, adjacent to the Oakland Outer Harbor, as shown in figure 1. Much of the extreme western part of the area near the Oakland shoreline, south of the mole, is filled land underlain by a relatively thin layer of soft, normally consolidated Holocene marine clay (bay mud). These shallow surficial units are, in turn, underlain by upwards of 180 m of stiffer Pleistocene glacial and interglacial deposits.
Most of the surface fills at the Port of Oakland were hydraulically placed to sea level, above which a combination of hydraulic and dumped fill was placed. After placement of the unimproved hydraulic fill, a relatively thick asphalt-cement pavement was laid in many of the terminal areas to support heavy vehicles and shipping containers. As shown in figure 1, three general areas encompassing four major terminals owned by the Port of Oakland were significantly damaged by soil liquefaction during the earthquake: (1) the Marine Container Terminal at Seventh Street; (2) the Matson Terminal, directly east of the Marine Container Terminal at Seventh Street; (3) the American Presidents Line (APL) Terminal at Middle Harbor; and (4) the Howard Terminal, farther east along the Oakland Inner Harbor, north of the Alameda (figs. 1, 5).
All of these terminals have pile-supported concrete wharves at the loading-dock edge of the terminal fill. At the Howard Terminal, these piles extend through a rock dike that serves as the perimeter containment for hydraulic fill inboard of the wharves. At the Marine Container Terminal at Seventh Street and at the Matson Terminal, the piles extend through rock fill that overlies a base of hydraulic sand fill. The hydraulic fills consist primarily of fine dredged sand and silty sand.
The most severe liquefaction- induced damage to port facilities occurred at the Marine Container Terminal. Liquefaction of the hydraulic fill resulted in settlement, lateral spreading, and cracking of the pavement over large areas of the terminal. Maximum settlements of the paved container yards inboard of the wharves were about 0.3 m. Several large cranes along the edge of the fill traverse laterally along the wharves on heavy rails. The outboard pile supported rail did not settle appreciably. The inboard crane rail, however, which was supported on fill throughout the entire terminal, underwent differential settlement, making several of the loading cranes and, thus, the dock facility inoperable after the earthquake. The Matson Terminal was able to continue limited operations because both its outboard and inboard crane rails were founded on a pile-supported concrete wharf deck.
Two of the large cranes operating along the north edge of the Marine Container Terminal at Berths 35 and 36 are shown in figure 11. A closeup of the pavement damage and approximately 0.15 m of settlement beneath the crane nearest to the camera in figure 11 is shown in figure 12. The observed settlement, which occurred in the vicinity of the inboard crane rail (fig. 16), resulted in severe distress to the crane system. In fact, one crane jumped the inboard rail at this site. Similar cracks and fissures occurred along much of the terminal. A 10-m-diameter, 0.3m-high sand boil in the paved container yard south of the C.F.S. Building (now removed) near Berth 38 is shown in figure 13.
| Figure 11.--Wharf of Port of Oakland's marine container Terminal at Seventh Street (viewed from Berth 37), showing shipping-container cranes, damaged pavement, and extruded sand. Click on figure for larger image (28K). | 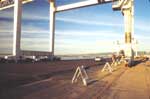 |
| Figure 12.--Closeup of damaged pavement near boreholes POO7-5 and POO7-6 at Port of Oakland Berths 36 and 37 (see fig.5 for locations), showing differential settlement, open fissures, and lateral spreading. Click on figure for larger image (32K). | 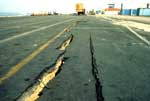 |
| Figure 13.--Sand boil near borehole POO7-1 at Port of Oakland Berth 38 and Port View Park (see fig.5 for locations). Click on figure for larger image (28K). | 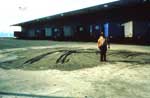 |
| Figure 14.--Log of borehole POO7-2 in fill deposits at Port of Oakland (see fig. 5 for location). Click on figure for larger image (60K). |  |
| Figure 15.--Log of borehole POO7-3 in fill deposits at Port of Oakland (see fig. 5 for location). Click on figure for larger image (64K). |  |
In addition to settlement and lateral spreading, as well as associated pavement damage and related mobility problems for the large cranes, damage occurred at the tops of several piles supporting the wharves in this area, as shown in figure 18. A cross section through the north edge of the Marine Container Terminal is shown in figure 19. Damage to battered piles, which occurred at the tops of a single row of inboard and outboard batters, consisted primarily of tensile failures.
| Figure 16.--Liquefaction-induced damage to taxiway pavement at Alameda Naval Air Station. Click on figure for larger image (52K). | 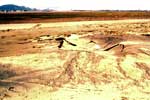 |
| Figure 17.--Minor settlement and buckling of pavement at southwest edge of the Alameda (fig.1). Click on figure for larger image (40K). | 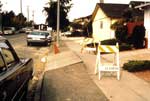 |
| Figure 18.--Northern part of Oakland International Airport and Bay Farm Island, showing locations of boreholes (dots). Click on figure for larger image (68K). |  |
| Figure 19.--Sand boils west of Aughinbaugh Way near borehole HBI-CPT1 on Bay Farm Island (see fig.18 for locations).Click on figure for larger image (36K). | 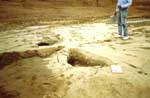 |
As a result of widespread damage to the battered piles, they have been replaced by the Port of Oakland with vertical piles that are designed to provide lateral flexibility during earthquake loading. The pile-supported wharf deck has also been extended inboard, with additional vertical piles to provide improved support for the inboard crane rails. Stone columns were installed through the sand dike fill to limit deformations of the dike during future earthquakes.
At the south end of Berth 38, liquefaction-related features were observed in (now closed) Port View Park, located at the west end of Seventh Street (fig. 5). Lateral spreading and failure of the southern perimeter dike, with lateral movements toward the bay of several meters, were observed, although an area inboard of the dike near borehole POO7-3 had no surface manifestations of liquefaction. It may be that a thin seam of sand at approximately 6.5-m depth in borehole POO7-3 liquefied and that lateral displacement bayward of the site, and the opening of fissures, relieved excess pore-water pressures.
The Howard and APL Terminals differ in their design from the Marine Container Terminal in that (1) fill-containment dikes at the Howard Terminal are composed entirely of rock, and at the APL Terminal entirely of sand; (2) both the inboard and outboard crane rails are pile supported; and (3) all the piles supporting the wharves and the crane rails at the Howard Terminal are vertical or nearly vertical (max batter, 1:12). Liquefaction of the hydraulic fill caused appreciable settlements (max 30 cm) over large areas of the Howard and APL Terminals. Although pavement was damaged at the edges of the wharves and in the inboard container yards, there was no apparent damage to piles or adverse movements of the crane rails.
Two of the six logs of six boreholes drilled at the Port of Oakland study site (figs. 1, 5) near the Marine Container Terminal at Seventh Street are shown in figure 14 and 15. Detailed description of the Port of Oakland borehole logs, including those discussed here, were presented by Kayen (1993) and Mitchell and others (1994). Three SPT's were performed near the southwest corner of the fill area near Berth 38 and Port View Park, and six CPT soundings near the north side of the facility near Berths 36 and 37. We note that evidence of liquefaction of the subbase material appears to have extended across much of the entire western.part of the Marine Container Terminal, as evidenced by settlement, sand boils, and tension cracking of the asphalt. The study sites were selected for ease of access, not because of the severity of liquefaction damage, except at borehole POO7-3, where liquefaction was not observed. These sites typically have a resistant surface layer in the upper 3 to 4 m, with qc values typically 25 to 35 MPa and N values of 25 to 36 blows/ft. The water table within this layer averages approximately 2- to 2.3-m depth and fluctuates with tidal action. Below this surface layer, the fill consists of looser deposits of fine marine sand with qc values of 5 to 15 MPa and N values of 10 to 25 blows/ft. Liquefaction appears to have occurred in the materials between 4- and 8-m depth in borehole POO7-2, on the basis of correlations of SPT samples with surface sand-boil material recovered. Borehole POO7-3 is characterized by qc values greater than 10 MPa and N values greater than 21 for the entire submerged soil profile, except for a muddy-sand unit between 5- and 7-m depth.
Soil liquefaction occurred over large areas of Alameda Naval Air Station (ANAS), immediately south of the Port of Oakland, as shown in figure 1. Numerous, commonly large sand boils, settlements, and lateral spreads occurred over a large area at the west end of ANAS. The airfield's two runways and two taxiways were significantly damaged and inoperable after the earthquake. A large sand boil and vent on the taxiway of the two runways at ANAS is shown in figure 16. Pavement damage consisted of heaving, settlement, and minor lateral spreading, resulting in separation at joints. Maximum crack and joint openings were about 10 cm, and maximum vertical offsets were approximately 5 cm.
As at many of the sites discussed above, the western part of ANAS is built on hydraulic fill, underlain at shallow depths by soft bay mud, and at greater depths by older, stiffer soil units. Settlements of as much as 30 cm occurred over much of the west end of the ANAS; however, little liquefaction occurred to the east in the area occupied by base-operations buildings. A few structures were lightly damaged in the eastern part of ANAS as a result of relatively modest foundation movements, but most buildings were undamaged. Minor settlements and ground displacements in some places resulted in separation of exterior steps and cracking of concrete sidewalks. In addition, several sewer-line and waterline breaks occurred in this area.
Scattered evidence of liquefaction, as evidenced by sand boils, minor settlements, and minor lateral spreading, occurred in several places along the west coast of the Alameda outside ANAS. These ground deformations caused minor cracking of pavements and ruptured many pipelines but caused no serious damage to structures. A typical example of the minor ground deformations in this area is shown in figure 17. No inplace testing was performed either at ANAS or on the Alameda as part of our studies.
At Bay Farm Island, immediately north of Oakland International Airport (figure 1, 18), considerable liquefaction occurred at the northwest corner and at points along the west edge of the fill (fig. 19).
Most of the western part of Bay Farm Island consists of sandy hydraulic fill, underlain by bay mud and deeper, stiffer alluvium. Soil liquefaction in the northern part of the island was largely confined to undeveloped, artificially filled land in the areas on the south side of Bay Farm Slough, northwest of the intersection of Aughinbaugh Way and Mecartney Road (fig. 18). This area, which served as our study site, is presently undergoing residential development. Much of the rest of the island had already been developed for lightweight residential housing and light commercial use.
Fill in the perimeter dike was densified by dynamic compaction. Densification appears to have successfully prevented soil liquefaction of the western-perimeter dike during the earthquake. In contrast, in an area of unimproved fill, damage to roadway and parking-lot pavements occurred at the Harbor Bay Plaza business park (fig. 18). Numerous sand boils, many relatively large (more than 3 m in diameter), erupted in this area (fig. 20)
| Figure 20.--Sand boil near Harbor Bay Plaza on west side of Bay Farm Island. Click on figure for larger image (56K). | 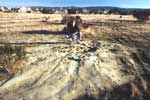 |
The logs of one of the three boreholes drilled at the Bay Farm Island study sites (figs. 1, 18) are shown in figure 21. These logs suggest a complex stratigraphy of relatively thin (less than 1 m thick) interbeds of sand and finer material. A total of 20 CPT logs were also taken at the liquefaction site northwest of the intersection of Aughinbaugh Way and Mecartney Road to observe any changes in strength over time; a representative log is shown in figure 21. These logs indicate a noncohesive layer of sand and silty sand at 2- to 3-m, with qc values of typically 2 to 16 MPa and N values of 8 to 18 blows/ft. The water table is within this layer between 1.5- and 2-m depth. Below this layer, to approximately 6.5-m depth, is a set of finer interlayered deposits with decreasing qc values and elevated Bq and FR values. Below 6.5-m depth, silty sand with a low qc value defines the rest of the logged soil column. Liquefaction probably occurred in the fine sand and silty sand at 2- to 3-m depth, on the basis of correlation of sand-boil materials with recovered samples.
| Figure 21.--Log of borehole HBI-CPT1 in fill deposits at Bay Farm Island study site (see fig. 18 for location). Click on figure for larger image (76K). |  |
CPT and SPT logs were taken along the improved perimeter dike, which did not liquefy during the earthquake. At the elevated dike structure, the water table is somewhat deeper in the soil profile at 2.5-m depth. However, within the sandy deposits at 2.5- to 7-m depth, qc values are noticeably higher, ranging from 10 to 35 MPa, and N values range from 29 to 58 blows/ft.
At the Harbor Bay Plaza business park, we performed tests in a parking area on South Loop Road. The soil at the site consists of fine hydraulic fill sand with low qc values to 4-m depth, below which are interbedded layers of bay mud and sand. Liquefaction almost certainly occurred at 2- to 4-m depth in the soil profile.
Immediately south of Bay Farm Island, soil liquefaction caused considerable damage to the main jet runway (11-29) at Oakland International Airport (figs. 1, 18). Additional evidence of liquefaction, including sand boils, settlement, and lateral spreads, occurred over wide areas of airport fill to the north, south, and east of the damaged runway section. As shown in figure 18, the main runway is located at the southwest edge of the airport. Much of the runway and inboard taxiway area is built on loose sandy fill underlain at shallow depths by soft bay mud and at greater depths by older, stiffer sedimentary deposits. The perimeters of the airport fill have dikes to prevent inundation during unusually high tides and storms.
Extensive soil liquefaction occurred in the western section of the airport fill, damaging the northwestern 900 m of the 3,000-m-long main runway. In addition, the adjacent taxiway pavement also was heavily damaged (fig. 22). At the northwest end of the main runway (left side, fig. 22), sand boils and cracks appeared in the pavement (figs. 23, 24). These cracks were as much as 30 cm wide, with vertical offsets of as much as 15 cm. Most of the runway damage was repaired within 4 weeks, and as a result, the airport was able to resume essentially full operations with a shortened operational runway 2,700 m long on November 20, 1989.
| Figure 22.--Northwest end of main runway (bottom) and adjacent taxiway (top) at Oakland International Airport (fig. 1). Photograph taken October 18, 1989. Click on figure for larger image (52K). | 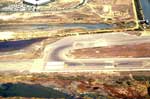 |
| Figure 23.--Large sand boil near north end of main runway at Oakland International Airport (fig. 1). Click on figure for larger image (32K). |  |
| Figure 24.--Fissures, sand boils, and grabens associated with lateral spreading near north-west end of main runway at Oakland International Airport. Photograph courtesy of B.A. Vallerga. Click on figure for larger image (44K). | 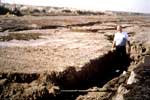 |
Settlement and lateral spreading occurred in several places in the surrounding perimeter dikes at the west end of the runway fill. The maximum observed levee settlement of the perimeter dikes was approximately 0.5 to 0.7 m, and lateral deformations were similar in magnitude. Liquefaction-induced ground deformations also damaged an undeveloped area of fill to the north and northeast of the main runway. Sand boils and major fissures caused by lateral spreading in this area are shown in figure 30. Liquefaction was also observed near the main terminal buildings, which are supported on deeper foundations and were not significantly damaged, although settlements of as much as 8 cm were observed in several places in the surrounding soils. In addition, a below-ground tramway, which allows service vehicles carrying passengers' luggage to pass under part of one of the main terminal buildings, filled to a depth of 2 m with exuded sand and water, as shown in figure 25.
| Figure 25.--Below-grade tramway, filled with as much as 1.8 m of extruded sand, at Oakland International Airport Terminal Building. Photograph courtesy of B.A. Vallerga. Click on figure for larger image (68K). | 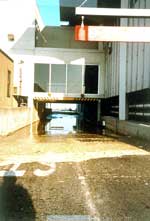 |
The log of one of the three boreholes drilled at the OIA study site along the north end of runway 11-29 (fig. 18) are shown in figure 26. Additional SPT boreholes and CPT soundings were located in this area as part of ongoing geotechnical investigations directed toward evaluating and, if necessary and feasible, improving conditions along the runways to ensure operability in the wake of a future earthquake.
| Figure 26.--Log of borehole ACPT7 in fill deposits at Oakland International Airport study site (see fig. 2 for location). Click on figure for larger image (64K). |  |
As shown in figure 26, a modest surficial crust is present between 0- and 2-m depth, where the water table was penetrated. From 2- to 4.5-5.8-m depth, depending on the borehole, is an extremely loose deposit of fine-sand hydraulic fill that almost certainly was responsible for the observed liquefaction and lateral spreading. qc values within this deposit range from 2 to 14 MPa, and N values from 1 and 4 blows/ft. The material in this layer correlates with sand-boil material observed at the surface. Below this deposit, young bay mud with a low qc value defines the rest of the soil profile.
We compared the observed liquefaction behavior of eastbay fills with the liquefaction potential of the study sites, as measured by qc and N values. To remove the influence of effective overburden stress on the field penetration-resistance measurements so that we may evaluate the liquefaction potential of soil in a manner that is independent of soil depth, we normalized the field measurements to values at a corresponding reference vertical effective stress of 1 atm. For example, N values can be normalized to a reference effective overburden stress of 1 atm ('vo=0.096 MPa) by correcting for overburden effects on penetration resistance, using the relation of Seed and Idriss (1971)
| N1 = CnN. | (3) |
We found that the overburden-stress-correction factor, Cn, can be reasonably expressed as
 |
(4) |
where N1 is the overburden-stress-corrected standard penetration resistance, 'vo is the effective overburden stress, and 'ref is a reference stress of 1atm. Likewise, to evaluate qc values at a common reference stress we adjust the measured qc values as follows:
| qc1 = Cq qc. | (5) |
We found that Cq can be reasonably expressed as
 |
(6) |
The N values were also adjusted to account for the efficiency of the SPT hammer system and the effects of sampler configuration. A standard SPT hammer efficiency of 60-percent energy transmission to the drill rod and sampler was adopted by Seed and others (1984). The actual SPT hammer efficiency of the drill rig used (a model CME-450) during most of the testing at east-bay sites was less than 60 percent. We used a Binary Instruments model 102 calibrator to determine the actual efficiency by stress-wave energy measurement (American Society for Testing and Materials, 1986b) and corrected the N1 measurements according to the recommendations of Farrar (1991; J.A. Farrar, oral commun., 1992). We also accounted for the influence of a split-spoon sampler that did not have a constant inside diameter of 5.50 cm (sampler configured to permit the use of internal sample liners and the liners were omitted) by increasing the recorded blowcounts by 10 to 20 percent for low and high N values, respectively (Seed and others, 1984).
Liquefiable layers at the Toll Plaza, Port of Oakland, Bay Farm Island, and Oakland International Airport study sites can be characterized as clean sand with a mean grain diameter (D50) of at least 0.25 mm and a fines content of less than 5 percent. The liquefiable layer at the Port of Richmond study site has a D50 value of approximately 0.06 to 0.07 mm and a fines content (<0.074 mm) of more than 35 percent. Silty sands, like those at the Port of Richmond study site, with the same liquefaction resistance as that of a corresponding reference "clean sand," are typically observed to have distinctly lower measured penetration-resistance values. Seed and others (1984) presented boundary curves that effectively convert penetration-resistance values of silty sands to those of clean sands containing no fines, and defined an SPT fines-content correction factor (Seed and de Alba, 1986):
(N1, fc )clean sand equivalent = (N1)silty sand rneasured +  N1 N1 |
(7) |
where N1, the fines-content correction factor, is a function of the fines content, FC (in percent). According to the guidelines presented in a consensus statement from the NCEER Workshop on Evaluation of Liquefaction Resistance, held January 4-5, 1996, in Salt Lake City, Utah, we used the following equations for correcting the SPT values of low-plasticity silty sands to equivalent values for clean sand
 |
(8) |
We applied this correction factor to the SPT data at the Port of Richmond study site.
We used two approaches to assess the intensity of seismic shaking at the study sites. The first approach used the conventional cyclic-stress-ratio (CSR) method of Seed and others (1984), and the second approach used a new method based on the Arias intensity of ground motion recorded near the study sites (Kayen and Mitchell, in press). The first method utilizes a uniform CSR to represent the complex and irregular earthquake-induced stress-time history. This equivalent series of cyclic loads of uniform amplitude is expressed as follows (Seed and Idriss, 1982):
 |
(9) |
where amax is the peak ground acceleration, g is the gravitational acceleration (981 cm./s2), vo is the total overburden stress, 'vo is the effective overburden stress, and rd is a depth-reduction factor, which can be estimated in the upper 10 rn of the soil column by the following relation:
| rd = 1 - 0.012z, | (10) |
where z is the depth (in meters) (Kayen and others, 1992). The second approach utilizes a quantitative measure of earthquake shaking intensity termed the Arias intensity (Arias, 1970), which is the sum of the energy per unit weight absorbed by an evenly spaced population of idealized undamped simple oscillators in response to the earthquake motion. For the two horizontal components of motion, the Arias intensity, Ih, is calculated as
 |
(11) |
where Ixx and Iyy are the intensities measured in the x- and y-directions, respectively, in response to transient motions in the x- and y-directions; g is the acceleration due to gravity; to is the duration of earthquake shaking; and ax(t) is the transient acceleration. The Arias intensity integral has the dimensional units of L/T.
To assess the soil-liquefaction potential, the advantages in using Arias intensity over peak ground acceleration (PGA), as used in the CSR method, are that (1) Arias intensity is derived from the acceleration records of both horizontal components of motion over the entire duration of motion, whereas PGA utilizes a single arbitrarily selected value; and (2) Arias intensity incorporates the intensity of motions over the full range of recorded frequency, whereas PGA is commonly associated with high-frequency motion. Furthermore, the breakdown of soil structure that results in liquefaction depends fundamentally more on input energy than on a single level of acceleration (Liang and others, 1995).
As in the case of PGA, we find that Ih typically decreases with depth in the soil column. To assess the soil-liquefaction potential, we need to know the Ih profile within the soil column. We estimated the decrease in Ih with depth through a parametric analysis of synthetic accelerograms based on shear-modulus representations of soil columns at our east-bay study sites. Synthetic seismograms were generated for the surface and depth nodes of soil-column input files with the ground-response computer-prograrn SHAKE90 (modified version of program presented by Schnabel and others, 1972). Using SHAKE90, strong-motion records from eight earthquakes were propagated through a soil column representing loose sandy fill (Vs=150 m/s) overlying cohesive soil with shear-wave-velocity profiles representative of known San Francisco bayshore sites (Sun and others, 1989; Kayen, 1993). Each profile was underlain by an elastic base-rock material with a shear wave velocity of 2,500 m./s. Output synthetic acceleration-time histories for layer nodes at depth in the model soil profiles were integrated to calculate Ih and then normalized by the respective Ih at the surface. This normalization process allows us to evaluate the depth dependency of Ih over a broad range of earthquake and site conditions by collapsing the profiles to a common reference value (unity) at the ground surface. We define an Arias intensity depth-of-burial-reduction parameter, rb, as the ratio of the buried to the surface cumulative Arias intensity:
 |
(12) |
The rb parameter, which is analogous to rb (Seed and Idriss, 1982), can be calculated from either one- or two-component horizontal Arias intensity. The mean ± l responses calculated from the suite of SHAKE runs are plotted in figure 27. The mean rb value decreases somewhat linearly from 1.0 to a value of 0.58 at 6-m depth and then to 0.46 at 10-m depth; rb remains essentially constant below 10-m depth. We calculated the Arias intensity within the soil column, Ihb, as the product of Ih measured from recorded seismograms in the east bay and rb estimated from the SHAKE90 study.
| Ihb = Ihrb. |
(13) |
In our study, we associate CSR and Ihb profiles with the liquefaction field-performance data (N1)60 and qc1, from our study sites. The CSR and Ihb values used in the analyses of critical soil layers at the east-bay study sites (fig.1) are summarized in table 1. Two SPT boundary-curve sets for the assessment of soil- liquefaction potential based on Ihb (Kayen and Mitchell, in press) and CSR (Seed and others, 1984) for soils with low-plasticity fines content of less than 5 percent are shown in figure 28. The CSR by itself does not account for earthquake magnitude and duration, and so magnitude-correction factors must be applied to CSR values to scale for the severity of earthquake shaking. This approach results in a suite of magnitude dependent boundary curves. Several magnitude-correction-factor curves for CSR have been proposed (Seed and Idriss, 1982 ; Ambraseys, 1988; Arango, 1996). The Arias intensity incorporates magnitude, frequency, and earthquake-shaking-duration elements of strong motion and thus needs no magnitude-correction factors.
| Figure 27.--Profiles of Arias intensity depth-of-burial-reduction parameter versus depth (A) and mean ± curves (B), modeled using ground-response program SHAKE. Click on figure for larger image (52K). |
 |
| Figure 28.--Assessment of soil-liquefaction potential from Arias intensity versus cyclic-stress ratio method. A, Arias intensity within soil column versus normalized 60-percent-hammer-efficiency blowcount for sites in the United States and Japan, with fines-content correction to equivalent "clean sand." B, Cyclic-stress ratio versus normalized 60-percent-hammer-efficiency blowcount for Loma Prieta study sites. Click on figure for larger image (60K). |  |
| Table 1.--Representative values of parameters used in liquefaction-susceptibility analyses for critical soil layers at east-bay study sites. Click on figure for larger image (76K). |  |
The Ihb and CSR values at the liquefaction boundary in figure 28 represent the minimum threshold seismic intensity (Ihb,1 and CSR1, respectively) required to induce liquefaction in soil with a given (N1)60 or qc1 value. We compared Ihb,1 and CSR1 with the corresponding seismic-shaking-intensity function induced by the earthquake, using equations for Arias intensity at depth (Ihb,eq) and cyclic-stress ratio (CSReq), to determine profiles of factor of safety against liquefaction. The Arias intensity-based factor of safety FIhb against liquefaction occurrence is defined as the ratio of the Arias intensity required to cause liquefaction to the Arias intensity imparted by the earthquake:
 |
(14) |
This Arias intensity-based factor of safety is analogous to that defined by Seed and others on the basis of cyclic-stress ratio (FCSR).
We converted the N profiles from figures 4, 9, 10, 14, 15, 21, and 26 into factor-of-safety profiles for both FCSR and FIhb in figure 29, on the basis of the calculated CSR and Ihb values for the study sites. At the Port of Richmond study site, the FIhb and FCSR profiles accurately identify the liquefaction zone between 4- and 5-m depth in profile POR-1. At borehole POR-Hall St. (log not shown), both profiles accurately indicate no liquefaction. Profiles of FCSR and FIhb for the San Francisco-Oakland Bay Bridge study site correctly indicate that liquefaction occurred principally between approximately 5.5- and 7.5-m depth at borehole SFOBB-1 and between 6.0- and 9-m depth at borehole SFOBB-5, on the basis of field observations. The profiles for borehole POO7-2 are in agreement and identify the zone of liquefaction between 5- and 8-m depth, and borehole POO7-3 indicates thin seams of loose potentially liquefiable material at 6.5- and 7.5-m depth, but otherwise no liquefaction susceptibility. Likewise, at Bay Farm Island, both methods accurately predict no liquefaction at the improved dike and liquefaction at 3.5- to 4.5-m depth at profile HBI-CPT1; and at Oakland International Airport, both methods predict liquefaction in a zone between approximately 2- and 5-m depth.
| Figure 29.--Comparison of factor of safety against liquefaction (FS£1.0 = liquefaction; FS>1.0 = no liquefaction) for study sites on east side of San Francisco Bay, using Arias intensity and cyclic-stress ratio methods. Click on figure for larger image (72K). |  |
The CPT data used to construct the plot of Ihb versus qcl in figure 30A are almost exclusively from the Loma Prieta data set. qc1 is plotted against CSR in figure 30B with respect to the boundary curves proposed by Robertson and Campanella (1985), Seed and de Alba (1986), Shibata and Teparaksa (1988), and Mitchell and Tseng (1990). The boundary curves proposed by Robertson and Campanella (1985) and Seed and de Alba (1986) are based on qc/N ratios rather than direct field investigations of liquefaction test sites. The method of Shibata and Teparaksa (1988) is based on a limited data set of direct measurements at liquefaction sites for earthquakes in Japan, China, and the United States. Mitchell and Tseng (1990) proposed boundary curves developed from the qc-Dr (relative density)-CSR relation at a given effective confining stress, which are based on cavity -expansion theory and cone-chamber test results.
| Figure 30.--Assessment of soil-liquefaction potential from Arias intensity versus cyclic-stress ratio method, showing plots of Arias intensity within soil column (A) and cyclic-stress ratio (B) versus normalized cone-penetration resistance for Loma Prieta study sites listed in table 1. Click on figure for larger image (64K). |  |
The data points for sandy-fill deposits in the east bay observed to have liquefied plot on or to the left of the boundary curves proposed by Robertson and Campanella (1985), Shibata and Teparaksa (1988), and Mitchell and Tseng (1990) for medium sand. The dense layers at borehole POO7-3 and the Bay Farm Island dike (fig. 24), which are not believed to have liquefied, plot to the right of all the boundary curves. One boundary curve proposed by Seed and de Alba (1986) did not fully capture the observed occurrences of liquefaction for several soil layers and appears to be somewhat unconservative. The boundary curve for D50=0.05 mm proposed by Shibata and Teparaksa (1988) falls to the left of the data points for the Port of Richmond study site and appears to be somewhat unconservative for fine-sand material.
Extensive soil liquefaction occurred during the 1989 Loma Prieta earthquake in uncompacted artificial-fill deposits of the east bay from Oakland International Airport to the Port of Richmond, from 65 to 85 km from the north end of the rupture zone. We present the results of studies at five sites near the east-bay shoreline: the Port of Richmond, San Francisco-Oakland Bay Bridge Toll Plaza, the Port of Oakland's Marine Container Facility at Seventh Street, Bay Farm Island and Harbor Bay Plaza, and Oakland International Airport. Typical of all these sites are extremely low to low N and qc values in layers of cohesionless hydraulic fill that overlie deep, primarily cohesive soil deposits. Two factors, low density (as reflected by low penetration resistance) and amplification of seismic shaking by the underlying soils, combined to give the sites a relatively high liquefaction susceptibility.
Comparing the CSR- and Arias intensity-based methods for assessing soil-liquefaction potential, we found that when using SPT data, the two methods agree in predicting the occurrence or nonoccurrence of liquefaction in soils layers at our study sites during the earthquake. The CPT data allow for an evaluation of liquefaction susceptibility using various proposed CSR-based boundary curves. We found that the proposed boundary curves of Robertson and Campanella (1985), Shibata and Teparaksa (1988), and Mitchell and Tseng (1990) did well in distinguishing liquefiable from nonliquefiable soils at our study sites, whereas the boundary curve proposed by Seed and de Alba (1986) appears to be somewhat unconservative. Field data from the Loma Prieta study sites allow us to construct an Arias intensity/cone-penetration-resistance boundary for assessment of soil-liquefaction potential.
This research was supported the U.S. Geological Survey and an unrestricted gift to the University of California, Berkeley, from the Institute of Technology, Shimizu Corp., Japan. We thank Angela Lodge (University of California, Berkeley) and Roberto Coutinho (Universidade Federal de Pernambuco, Brazil) for their participation in the collection of field data. John Egan and Larry Scheibel (Geomatrix Consultants, Inc.) generously contributed data for several of the east-bay study sites.
Ambraseys, N.N., 1988, Engineering seismology: Earthquake Engineering & Structural Dynamics, v. 17, no. 1, p. 1-105.
American Society for Testing and Materials, 1984, Standard method for penetration test and split-barrel sampling of soils: Annual Book of ASTM standards, Section. 4, v. 04.08, D1586-84.
--1986a, Standard method for quasi-static, cone and friction cone penetration test of soil, Annual Book of ASTM standards, Section 4, Volume 04.08, D3441-86.
--1986b, Standard. test method for stress wave energy measurement for dynamic penetrometer testing systems: Annual Book of ASTM Standards, Section 4, v. 04.08, D4633-86, p. 943-946.
Arango, Ignacio, 1996, Magnitude scaling factors for soil liquefaction evaluations: Journal of Geotechnical Engineering, v. 122, no. 11, p. 929-936.
Borcherdt, R.D. ed, 1994, The Loma Prieta, California, earthquake of October 17, 1989--strong ground motion: U.S. Geological Survey Professional Paper 1551-A, p. Al-A272.
Campanella, R.G., and Robertson, P.K., 1982, State-of-the-art in in-situ testing of soils; developments since 1978: Engineering Foundation Conference on Updating Subsurface Sampling of Soils and Rocks and Their In-Situ Testing, Santa Barbara, Calif, 1982, Proceedings, p. 1-23.
Farrar, J.A., 1991, Field energy measurements of standard penetration testing: Denver, University of Colorado, M.S. thesis, 400 p.
Hardin, B.O., and Drnevich, V.P., 1972, Shear modulus and damping of soils; measurement and parameter effects: American Society of Civil Engineers Proceedings, Soil Mechanics and Foundations Division Journal, v. 98, no. SM6, p. 603-624.
Kayen, R.E., 1993, Accelerogram-energy approach for prediction of earthquake-induced ground liquefaction: Berkeley, University of California, Ph.D. thesis, 289 p.
Kayen, R.E., Mitchell, J.K., Lodge, A.G., Seed, R.B., Nishio, Shin'ya, and Coutinho, Roberto, 1992, Evaluation of SPT-, CPT-, and shear wave-based methods for liquefaction potential assessment using Loma Prieta data, in Hamada, Masanori, and O'Rourke, T.D., eds., Proceedings of the Fourth Japan-U.S. Workshop on Earthquake Resistant Design of Lifeline Facilities and Countermeasures for Soil Liquefaction: Buffalo, N.Y., National Center for Earthquake Research Technical Report NCEER-92-0019, v. 1, p. 177-204.
Kayen, R.E., Mitchell, J.K., and Holzer, T.L., 1994, Ground motion characteristics and their relation to soil liquefaction at the Wildlife Liquefaction Array, Imperial Valley, California, in O'Rourke, T.D., and.Hamada, Masanori, eds., Proceedings of the Fifth U.S.-Japan Workshop on Earthquake Resistant Design of Lifeline Facilities and Countermeasures for Soil Liquefaction: Buffalo, N.Y., National Center for Earthquake Research Technical Report NCEER-94-0026, p. 267-283.
Kayen, R.E., and Mitchell, J.K., 1997, Assessment of liquefaction potential during earthquakes by Arias intensity: Journal of Geotechnical and Geoenvironmental Engineering, ASCE, v. 123, no. 12.
Liang, Liqun, Figueroa, J.L., and Saada, A.S., 1995, Liquefaction under random loading; unit energy approach: Journal of Geotechnical Engineering, v. 121, no. 11, p. 776-781.
Mitchell, J.K., and Tseng, D.-J., 1990, Assessment of liquefaction potential by cone penetration resistance, in Duncan, J.M., ed., H. Bolton Seed Memorial Symposium: Berkeley, Calif., BiTech, v. 2, p. 335-350.
Mitchell, J.K., Lodge, A.L., Coutinho, R.Q., Kayen, R.E., Seed, R.B., Nishio, Shin'ya, and Stokoe, K.H., II, 1994, In situ test results from four Loma Prieta earthquake liquefaction sites; SPT, CPT, DMT and shear wave velocity: Berkeley, University of California, Earthquake Engineering Research Center Report UCB/EERC-94/04, 179 p.
Robertson, P.K., 1986, In situ testing and its application to foundation engineering: Canadian Geotechnical Journal, v. 23, no. 4, p. 573-594.
--1990, Soil classification using the cone penetration test: Canadian Geotechnical Journal, v. 27, no. 1, p. 151-158.
Robertson, P.K. and Campanella, R.G., 1985, Liquefaction of sands using the CPT: American Society of Civil Engineers Proceedings, Geotechnical Engineering Division Journal, v.111, no. GT3, p. 384-403.
Robertson, P.K., Campanella, R.G., Gillespie, Don, and Rice, A., 1986, Seismic CPT to measure in situ shear wave velocity: Journal of Geotechnical Engineering, v. 112, no. 8, p. 791-803.
Schnabel, P.B., Lysmer, John, and Seed, H.B., 1972, SHAKE; a computer program for earthquake response analysis of horizontally layered sites: Berkeley, University of California, Earthquake Engineering Research Center Report UCB/EERC-72/12.
Seed, H.B., and de Alba, Pedro, 1986, Use of SPT and CPT tests for evaluating the liquefaction resistance of sands, in Clemence, S.P. ed., Use of in situ tests in geotechnical engineering: New York, American Society of Civil Engineers, p. 281-302.
Seed, H.B., and Idriss, I.M., 1971, Simplified procedure for evaluating soil liquefaction potential: American Society of Civil Engineers Proceedings, Soil Mechanics and Foundations Division Journal, v. 97, no. SM9, p. 1249-1273.
--1982, Ground motions and soil liquefaction during earthquakes: Berkeley, University of California, Earthquake Engineering Research Institute, 139 p.
Seed, H.B., Idriss, I.M., and Arango, Ignacio, 1983, Evaluation of liquefaction potential using field performance data: Journal of Geotechnical Engineering, v. 109, no. 3, p. 458-482.
Seed, H.B., Tokimatsu, Kohji, Harder, L.H., and Chung, R.M., 1984, The influence of SPT procedures in soil liquefaction evaluations: Berkeley, University of California, Earthquake Engineering Research Center Report 84-15, 50 p.
Seed, R.B., Dickenson, S.E., Reimer, M.F., Bray, J.D., Sitar, Nicholas, Mitchell, J.K., Idriss, I.M., Kayen, R.E., Kropp, Alan, Harder, L.F., Jr., and Power, M.S., 1990, Preliminary report on the principal geotechnical aspects of the October 17, 1989 Loma Prieta earthquake: Berkeley, University of California, Earthquake Engineering Research Center Report UCB/EERC-90/05, 137 p.
Shakal, A.F., Huang, M.J., Reichle, Michael, Ventura, C.E., Cao, T.Q., Sherbourne, R.W., Savage, M.K., Darragh, R.B., and Petersen, C.P., 1989, CSMIP strong-motion records from the Santa Cruz Mountains (Loma Prieta), California earthquake of 17 October 1989: California Division of Mines and Geology, Office of Strong Motion Studies Report OSMS 89-06, 196 p.
Shibata, Toru, and Teparaksa, Wanchai,1988, Evaluation of liquefaction potentials of soils using cone penetration tests: Soils and Foundations, v. 28, no. 2, p. 49-60.
Spudich, Paul, ed., 1996, The Loma Prieta, California, earthquake of October 17, 1989-main-shock characteristics: U.S. Geological Survey Professional Paper 1550-A, p. Al-A297.
Wroth, C.P., 1984, The interpretation of in situ soil tests: Géotechnique, v. 34, no. 4, p. 449-489.
 |
 |
 |
 |
|
|
 |
geotech/soil/index.html
contact: Robert Kayen
last modified 2018
