|
|
Viewing Movies and Photographs
The movies, individual photographs, a plot of time-series data collected during the tripod deployment, and notes for each time series are available through links in table 3. The movie may be viewed using a movie player such as Imagen (available free at http://www.gromada.com/imagen.html), QuickTime (available free at http://www.apple.com/quicktime/download/), or Windows Media Player. Click on Movie in table 3 to open the movie. Or if viewing this report from the DVD version, navigate to the .avi file (located in directories labeled TRIPODNNN, where NNN is the mooring number) and open with a movie player. See Description of Movie Frames (select from sidebar) for an explanation of the movie frame layout. Click on Photographs in table 3 to open a page of thumbnails of individual photographs; click on a thumbnail on that page to view the photograph, in .png format, at a resolution of 600 x 337 pixels. Click on Plot in table 3 to view a plot of observations (see description below). Click on Notes in table 3 (or navigate to the Notes section using the sidebar) to view comments on each time series.
An effective way to quickly scan a set of photographs is to download the movie file (.avi format) to your computer (right click on Movie in table 3 and select Save Target As...); downloading the movie allows a movie player to rapidily access the large data file and insures smooth playing without interruption. On your computer, open the .avi file with Imagen or QuickTime movie player and drag the slider with your mouse, in either direction, to navigate through the movie frames.
The data plot provides an overview of the observations recorded by the tripod system during the period of the time-series photographs. The plot includes low-passed current (as a stickplot, lines point in the direction of the current, subsampled every six hours), and hour-averaged current speed, temperature, pressure (the mean of the record has been subtracted), pressure standard deviation, and beam attenuation. The current measurements are nominally 1 m above the sea floor and the other data approximately 2 m above the sea floor. Pressure standard deviation is the standard deviation of burst pressure measurements (pressure typically sampled at 1 Hz for 5 minutes). The hour-averaged data are smoother than the data in the movie frames that are displayed at the fastest sampling interval, typically every 5 min. Abrupt changes in the hour-averaged pressure indicate that the tripod has moved or tipped over. Increases in pressure standard deviation indicate pressure fluctuations caused by surface waves. A gradual increase in beam attenuation over the deployment typically indicates fouling of the transmissometer optics. If a data panel is blank no data were collected, most likely a result of instrument failure.
Table 3. Links to photographs, movies, data plots, and notes. Click on Movie to open the movie with a movie player such as Imagen, Quicktime, or Windows Media Player. Or right click on Movie to download the .avi file to your hard drive. Some movie players allow adjustment of play speed, scanning of the movie by dragging a location slider with a mouse, and (or) control of the movie one frame at a time, forward or backward. Click on Photographs to open a page of thumbnails of the individual photographs; click on a thumbnail on the thumbnail page to view a larger-format photograph (in .png format). Click on Plot to open a plot of the time-series data collected during the tripod deployment. Click on Notes for a list of features and events of note for each set of time-series photographs. See table 4 for a list of frame date and times for each deployment.
Mooring
number
|
Start date
|
Stop date
|
Movie
|
Photographs
|
Data
plot |
Notes |
|
480 | October 1, 1996 | February 9, 1997 | Movie | Photographs | Plot | Notes | |
495 | February 17, 1997 | June 10, 1997 |
Movie | Photographs | Plot | Notes | |
501 | June 10, 1997 | September 23, 1997 |
Movie | Photographs | Plot | Notes |
|
507 | September 23, 1997 | November 12, 1997 |
Movie | Photographs | Plot | Notes |
|
516 | February 10, 1998 | June 10, 1998 |
Movie | Photographs | Plot | Notes |
|
530 | June 17, 1998 | September 30, 1998 |
Movie | Photographs | Plot | Notes |
|
540 | September 30, 1998 | February 8, 1999 |
Movie | Photographs | Plot | Notes |
|
552 | February 10, 1999 | May 7, 1999 |
Movie | Photographs | Plot | Notes |
|
569 | May 11, 1999 | September 15, 1999 |
Movie | Photographs | Plot | Notes |
|
591 | September 26, 1999 | December 10, 1999 |
Movie | Photographs | Plot | Notes |
|
625 | May 13, 2000 | September 11, 2000 |
Movie | Photographs | Plot | Notes |
|
638 | February 14, 2001 | May 24, 2001 |
Movie | Photographs | Plot | Notes |
|
665 | October 23, 2001 | February 6, 2002 |
Movie | Photographs | Plot | Notes |
|
690 | May 21, 2002 | September 23, 2002 |
Movie | Photographs | Plot | Notes |
|
717 | September 24, 2003 | February 1, 2004 |
Movie | Photographs | Plot | Notes |
|
767 | May 19, 2004 | July 17, 2004 |
Movie | Photographs | Plot | Notes |
|
775 | September 22, 2004 | January 27, 2005 |
Movie | Photographs | Plot | Notes |
|
777 | February 9, 2005 | May 14, 2005 | none | Photographs | Plot | Notes |
|
786 | May 18, 2005 | July 15, 2005 | none | Photographs | Plot | Notes |
|
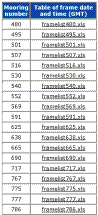 Table 4.
Links to tables in Excel format that list frame number and frame date and time for each mooring deployment.
|