Woods Hole Science Center
Title Page / Table of Contents / List of Figures / Introduction / Maps / Data Collection/Processing / Interpretation / Acknowledgments / Appendix 1 / Appendix 2 / Appendix 3 / Appendix 4
 |
 |
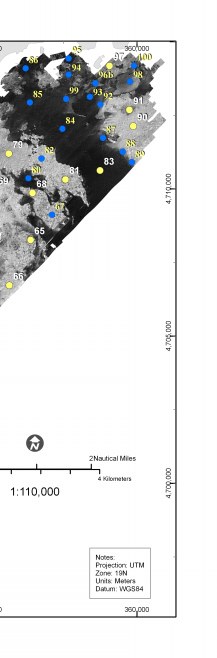 |
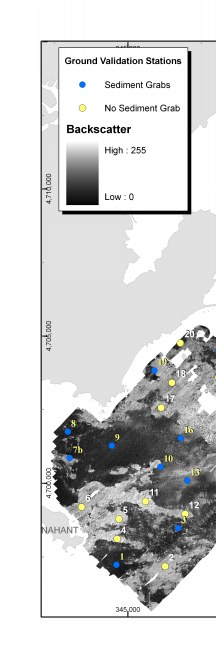
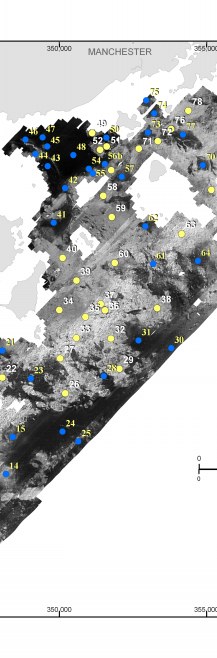
Figure 3.7. Map showing bottom sample locations and video transects overlain on a map of acoustic backscatter from sidescan sonar. Each numbered circle indicates a station where multiple photographs, video, and/or samples were collected. | ||