Woods Hole Science Center
|
|
Section 4: Geologic Interpretation
Setting
The Nahant-Gloucester study area lies in the western Gulf of Maine, where the coast and inner continental shelf are bedrock framed with numerous rocky islands and rugged headlands. Bedrock in the region consists of complexly faulted and deformed intrusive rocks that range in age from Precambrian (> 540 million years) to Paleozoic (250-540 million years) (Zen and others, 1983). Bedrock is widely exposed along the shoreline and is a primary control on the shape of the coast. Rocky headlands provide shelter for small harbors and pocket beaches. The rugged topography of the seafloor is presumably due to these same rocks cropping out offshore. Mapping Seafloor GeologyThe seafloor topography and surficial geology of the western Gulf of Maine are complex and difficult to map (Trumbull, 1972; Poppe and Polloni, 2000; Barnhardt and others, 1996). Earlier maps characterized the texture of seafloor sediments at regional scales based on widely spaced bottom samples (Schlee, 1973; Folger and others, 1975; Poppe and others, 1989). Traditional methods of mapping in more homogenous, non-glaciated regions of seafloor have relied on contouring changes in grain-size properties (Hollister, 1973), but those methods are impractical on this part of the Massachusetts shelf. The substrate variations that exist cannot be accurately shown given the density of samples in the area.
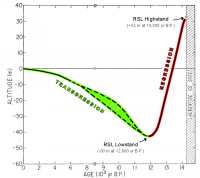
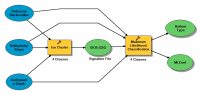
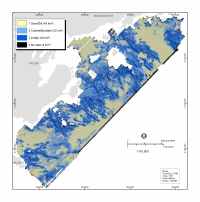
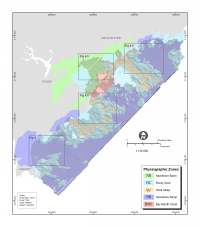
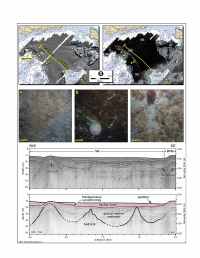
Two characteristics of the study area complicate attempts to map it: 1) the rugged, high-relief seafloor exhibits abrupt changes in water depth (fig. 3.2), and 2) different substrates form a distinct "patchiness" on the seafloor that changes over distances of only a few meters (fig. 3.3). For example, high relief bedrock and bouldery glacial deposits (till) are commonly exposed on the seafloor in close proximity to flat-lying deposits of finer sediment (sand, mud). Rocky areas also contain isolated accumulations of shelly sediment that are ponded in small cracks and other low-lying areas between rock outcrops. Multivariate AnalysisQuantitative, computer-generated mapping methods are being developed in this study to delineate the characteristics of geologic materials on the seafloor and test the validity of statistical approaches to mapping. Preliminary results of this research show potential for semi-automated classification of bottom types in the nearshore environment of this study. Visual inspection of the bathymetric and acoustic backscatter maps (figs. 3.2 and 3.3) show a loose correlation between water depth, backscatter intensity, and the slope of the seafloor. In general, areas of low slope tend to have low backscatter values, and areas of higher slope have higher backscatter values. The main objective is to create a statistical method that can be applied to quantify the distribution of substrates on a regional scale. The inputs for this unsupervised classification were 5-m resolution grids of seafloor topography (water depth), backscatter intensity (substrate reflectance) and seafloor slope (derived from seafloor topography). This method uses a two-step unsupervised classification of the seafloor. First, an Iterative Self Organizing (ISO) clustering function (also known as migrating means technique) was applied to the three input grids. The ISO function groups overlapping cells from the grids into 4 user-defined classes and creates an ASCII signature file of the results. The second part of the process uses this signature file as an input to a Maximum Likelihood Classification routine that outputs a classified raster. These two steps were combined in a custom model using ArcGIS Model Builder (fig. 4.2). The output grid from this analysis groups surficial materials on the seafloor in three general classes: ledge, cobble/boulders, and sand/silt (fig. 4.3). The fourth class "“no data” is used to identify areas around the edges of the input data where all three input grids did not overlap and thus did not meet the criteria for classification. Although this type of unsupervised classification technique is commonly used in aerial remote sensing of terrestrial environments, it has not been widely applied to marine remote sensing data primarily because survey costs and survey time are usually greater. Marine acoustic data is also difficult to classify because of external noise (e.g., boat wakes, breaking waves, and propeller wash) and refraction effects in the water column (e.g., thermocline). The signal-to-noise ratio in marine surveys is relatively low compared to terrestrial surveys that use data from airplanes or satellites. In this study, the four generalized groupings of bottom types were selected to compliment the primary objective which is to provide geologic data maps of the seafloor on a regional scale. A rigorous quantitative error analysis of the final bottom classification was not run as part of this study because of time constraints. Future work on these data will include comparison of supervised and unsupervised classification of these data. Physiographic ZonesThe seafloor in the study area can be divided into five environments, or physiographic zones, which are delineated based on seafloor morphology and the dominant characteristics of surficial materials (fig. 4.4). Physiographic mapping allows efficient mapping of large areas and presents geologic information in a readily useable format. It is a more qualitative method than the multivariate approach described above, and relies heavily on geologic interpretation. Delineation of physiographic zones does not require full coverage with bathymetric and backscatter data, which can be difficult to collect in shallow water environments. Other data, such as single-beam depth soundings, can also be used to characterize the seafloor physiography where full coverage does not exist. In figure 4.4, for example, information from air photographs, nautical charts, and site visits was used to map physiographic zones in the narrow band of shallow water adjacent to the coast, where water depths were less than about 5 m. The five physiographic zones are Nearshore Basins, Rocky Zones, Nearshore Ramps, Shelf Valleys, and Bay-Mouth Shoals. Geologic maps using these zones have been produced at regional scales for other areas in the Gulf of Maine where seafloor topography and substrates are similar to the inner shelf offshore of northeastern Massachusetts (Kelley and others, 1989; Kelley and Belknap, 1991; Barnhardt and Kelley, 1995). The zones are described below in terms of their size, morphology, physical setting, and substrate properties. Nearshore Basins (NB) are areas of shallow, low-relief seafloor adjacent to the mainland and separated from offshore areas by islands and shoals. Along its landward margin, the basin sediment merges with the intertidal zone in a gradational contact. One large Nearshore Basin is recognized in the study area, located inside Salem Sound and Marblehead Harbor. It is sheltered from the open ocean by small islands and shoals. The basin is bordered by the mainland coast on its landward side and terminates against Rocky Zone, Shelf Valley, and Bay-Mouth Shoal on its seaward side. The inner-most part of the basin is the Danvers River estuary. Although exposures of bedrock and coarse-grained sediment locally occur within the basins, the generally smooth seafloor primarily consists of sandy and muddy sediment. Nearshore Basins comprise 22.4 km² or 13.1% of the mapped area (table 4.1). Water depths range from 0 to 19 m. Seismic-reflection profiles indicate that sediment up to 33 m thick fills the basin, deeply burying high-relief bedrock in many areas of Nearshore Basins (fig. 4.5). Based on geophysical characteristics and previously published research (Oldale and Edwards, 1990; Oldale and others, 1983, 1993), we infer a Holocene age (less than 10,000 years) for the sandy/muddy surficial deposits. Long cores are needed to validate geophysical interpretations and to confirm age estimates on subsurface deposits by collecting and dating organic materials. In most areas of the Nearshore Basin, a pronounced acoustic reflector marks the base of the Holocene deposits (fig. 4.5). Previous studies have recognized this reflective surface as the transgressive unconformity that was eroded into the top of older deposits due to sea-level rise and shoreline transgression that occurred over the last 12,000 years (Oldale and others, 1983, 1993). Sediment below the transgressive unconformity is inferred as Pleistocene in age. It was originally deposited in contact with or in close proximity to large ice sheets that once covered the region. Till, which is a poorly sorted, sandy sediment containing large clasts (pebbles, cobbles, boulders), forms numerous drumlins and moraines along the coast of northeastern Massachusetts and in offshore regions (Oldale, 1985b; Oldale and others, 1994). Glacial-marine sediment is the most abundant basin fill, especially in deeper parts of the basin where the thickest deposits of interbedded mud and sand accumulated. The highly stratified material characteristically drapes over bedrock pinnacles and has been designated the Presumpscot Formation throughout the western Gulf of Maine (Belknap and Shipp, 1991). Table 4.1. Area of physiographic zones in the survey region.
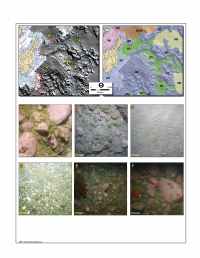
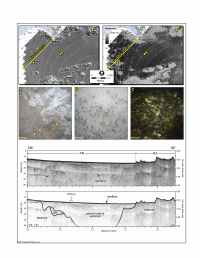
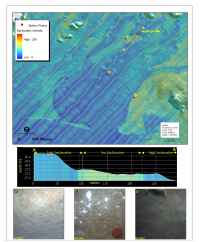
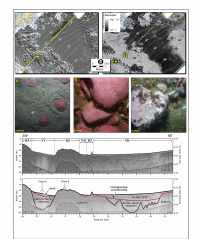
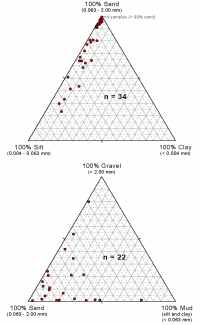
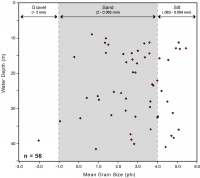
*In addition to areas completely imaged with sonar (134 km²), the geologic map in figure 4.4 includes adjacent shallow-water areas along the coast and surrounding islands (37.4 km²) Rocky Zones (RZ) are rugged areas of extreme bathymetric relief ranging from nearly vertical rock cliffs to relatively flat, gravel-covered plains littered with boulders up to 4 m in diameter. Although ledge and coarse-grained sediment locally occur in all physiographic zones, they dominate the seafloor in Rocky Zones. Large expanses of Rocky Zone surround many of the islands and extend several kilometers seaward from the coast as hazardous shoals. Sandy sediment with abundant shell fragments locally accumulates in sediment ponds that fill low-lying troughs (fig. 4.6D). Shells of benthic-dwelling bivalves and other encrusting organisms are commonly observed around the base of elevated rocky outcrops (fig. 4.6F). Rocky Zones are the 2nd largest physiographic element, comprising 63.4 km² or 37.0% of the study area (table 4.1). Water depths range from 0 to 48 m. The defining characteristics of Rocky Zones are high relief and hard bottom. Rocky Zones occur from the intertidal zone to water depths of > 40 m, and are common in relatively shallow water throughout the western Gulf of Maine (Kelley and others, 1989; Kelley and Belknap, 1991; Barnhardt and Kelley, 1995). Rocky Zones are expressed as series of bathymetrically complex, rock- and boulder-covered ridges and mounds that extend from the coast out to the seaward margin of the study area. These rugged areas of seafloor correspond loosely to zones of erosion/non-deposition mapped by Knebel and Circe (1995). Seismic-reflection profiles suggest that bedrock forms the core of the ridges and mounds, which are covered by a thin layer of bouldery sediment (fig. 4.7). The most prominent of these bouldery features is a series of lobate-shaped, convex-seaward ridges that we interpret as end moraines (red arrows in fig. 4.6). The submarine moraines have steep margins and consist of acoustically incoherent material, probably till, on seismic-reflection profiles. A series of bottom photographs, taken across one of the submerged moraines, shows cobbles and boulders at the crest of the moraine (fig. 4.6A) and a narrow apron of sandy gravel at the base (fig. 4.6B). Seaward of the gravelly apron, the smooth seafloor is covered with muddy sand (fig. 4.6C). Relatively sharp boundaries define the textural transitions between these different materials. In general, sediment thickness in Rocky Zones is 1 m or less, although seismic-reflection profiles show that ponded sediment is up to 10 m thick in a few locations. An acoustically transparent unit, inferred to be muddy glacial-marine sediment, underlies a thin surficial layer of gravelly sediment in these larger sediment ponds. Ponded sediment is often covered with bedforms and gravelly scour surfaces that are evidence of active reworking by waves and bottom currents, probably during large storms. The bedforms have wavelengths of 15-20 m, with crests 10-30 cm high that generally trend in a NE-SW direction and locally bend around bathymetrically high areas of seafloor. The sandy bedforms are variously classified as megaripples or subaqueous dunes (Ashley, 1990). Nearshore Ramps (NR) are areas of gently-sloping seafloor with generally shore-parallel bathymetric contours. This zone is primarily covered with sand-rich sediment, although small exposures of ledge, cobbles and boulders locally crop out on the seafloor. Nearshore Ramp terminates on the landward side against the mainland shoreline, Rocky Zone, and/or Shelf Valley. On the seaward side, it extends out to the depth of the sea-level lowstand at approximately 50 m, where it merges with deeper basin sediment outside the limit of the study area. The smooth, generally sandy seafloor of Nearshore Ramps are the most prominent physiographic element in the study area, comprising 68.6 km² or 40.0% of the study area (table 4.1). Water depths range from 0 to 48 m. Nearshore Ramps abut sandy beaches in the southwestern part of the study area between Nahant and Marblehead Neck, and in the northeastern part near Manchester. (fig. 4.4). Large areas of Nearshore Ramp are covered with uniform, relatively featureless, low backscatter material. In limited areas, however, a mosaic of different bottom types occurs on the seafloor. These areas exhibit complex distributions of high and low backscatter intensity, forming light and dark patches that are irregular in size and shape (fig. 4.8). Textural transitions between the different patches of sediment are marked by sharp boundaries. The seafloor has a mottled appearance due to high backscatter, gravelly material that lies in slight depressions (fig. 4.8A,B), surrounded by slightly elevated deposits of low backscatter, silty/sandy sediment (fig. 4.8C). Topographic changes at the margins of the depressions typically range from 5 to 50 cm, but locally can exceed 1 m. These irregular patches of high/low backscatter resemble "sorted bedforms" or "rippled scour depressions" that have been observed on continental shelves around the world (Cacchione and others, 1984; Murray and Thieler, 2004; Guiterrez and others, 2005; Ferrini and Flood, 2005; Green and others, 2004). The enigmatic features are common on other parts of the Massachusetts inner shelf (Aubrey and others, 1982; Goff and others, 2005). Numerous theories for their origin have been proposed, but generally the distinct morphology and texture of these features result from the interaction of waves and currents (i.e., along- and cross-shelf transport of sediment) with the existing substrate materials on the seafloor (i.e., geologic framework). Seismic-reflection profiles show that thick sediment deposits underlie the smoothly sloping surface of Nearshore Ramps in the study area. The thick deposits conceal the high-relief bedrock that lies below the seafloor (fig. 3.5). The surficial deposits, however, have different ages and origins. These are determined based on the stratigraphic setting, primarily whether they lie above or below the transgressive unconformity, which separates the Pleistocene and Holocene sedimentary sequences. In the southwestern part of the study area, the transgressive unconformity lies at or very near the seafloor offshore of Nahant. The unconformity truncates material that is highly stratified with closely spaced internal reflections draping over bedrock, the diagnostic properties of Pleistocene glacial-marine sediment (fig. 4.7). Bottom photographs confirm that bluish gray deposits of glacial-marine silty clay are exposed on this part of the Nearshore Ramp (fig. 4.7A). Where the stiff, cohesive deposits of silty clay crop out on the seafloor, backscatter intensity is high. Where the seafloor is covered with sandy Holocene material, backscatter intensity is low. The thin, discontinuous nature of sandy surficial sediment in this area creates alternating patches of low backscatter (Holocene) and high backscatter (Pleistocene). In the northeastern part of the study area, surficial sediment covering the Nearshore Ramp is Holocene in age, thousands of years younger than the glacial-marine clay that crops out offshore of Nahant. The Nearshore Ramp offshore of Manchester is covered with a relatively thick layer of Holocene sediment that completely buries the transgressive unconformity beneath up to 15 m of muddy sand (fig. 4.9). No glacial-marine deposits were observed on the seafloor in this part of the mapped area. Shelf Valleys (SV) are elongate depressions that extend offshore more or less perpendicular to the trend of the coastline, and slope gently seaward. They are bordered by rocky, bouldery walls where they cut through areas of Rocky Zone (fig. 4.4). The channels form a pattern of tributaries and main channels, which locally bifurcate into multiple branches and pass around isolated patches of Rocky Zone. The type of sediment in Shelf Valleys is highly variable, ranging from gravel to muddy sand (fig. 4.6B,C). Bedrock commonly crops out within the walls and floors of the channels. Shelf Valleys comprise 12.5 km² or 7.3% of the study area (table 4.1). Water depths range from 7 to 45 m. Four Shelf Valleys of different sizes cross the study area, generally trending from NW to SE. The largest valley, located in the northeastern part of the study area, measures 8 km long and up to 1 km wide (fig. 4.4). In plan view, it has a branching geometry that is analogous to terrestrial river valleys and a smooth, gently sloping bottom. The large valley, extends from the Nearshore Basin at its head in Salem Sound, passes between rocky islands (Misery, Bakers Islands), and gradually terminates seaward where it merges with a Nearshore Ramp in water about 40 m deep. This valley is the only one that can be traced directly to a modern river (Danvers River). It probably was formed by fluvial erosion during times of lower sea level. The three smaller valleys, clustered in the center of the study area offshore of Marblehead Neck, measure 1.5 to 5 km long and 0.1 to 1 km wide. They also exhibit an overall branching geometry but, compared to the larger valley, the tributaries are more lobate in plan form and the main channel is poorly defined. The valley bottoms have an irregular, not smooth, morphology that consists of a series of small, interconnected depressions. In addition, they have no obvious terrestrial source; the heads of the small valleys do not correlate with modern stream valleys onshore. All three valleys terminate on their seaward end against Nearshore Ramps in 30-40 m water depth. This class of small Shelf Valleys probably represent a series of kettles that originally formed in glacial drift, and have been modified by erosion. The hardness and roughness of the seafloor, as recorded with sidescan sonar (i.e., backscatter intensity in fig. 3.3), varies along the length of the Shelf Valleys. High backscatter areas within the valleys are floored with coarse sand, gravel (including pebbles, cobbles and boulders), and bedrock exposures, indicating areas of erosion or non-deposition. Highly reflective aprons of coarse material typically lie adjacent to channel margins and surround the base of rocky outcrops. Bottom photographs show that submarine talus piles contain abundant carbonate (fig. 4.6B). The thalweg, or deepest part of the valleys, is a relatively featureless region floored with low backscatter material such as sand and muddy sand (fig. 4.9A). Seismic-reflection profiles show that Shelf Valleys locally contain deposits up to 31 m thick (fig. 3.5). Bay-Mouth Shoals (BMS) are areas of shallow, generally smooth seafloor at the entrance to Salem Sound. Relatively steep slopes define the margins of the shoals, which are elevated above the surrounding shelf and locally emerge above sea level as small islands. The tops of the shoals are uniformly covered with high backscatter, sandy, gravelly material (fig. 4.5C, fig. 4.6E). Seismic-reflection systems achieved only shallow penetration through these deposits (fig. 4.5), and their structure is largely unknown. Fields of bedforms typically occur on top and around the margins of the shoals, indicating contemporary reworking of the seafloor by waves and currents. The sandy bedforms have linear to slightly sinuous crests, amplitudes of 10-30 cm, and wavelengths of 15-20 m. They are variously classified as megaripples or subaqueous dunes (Ashley, 1990). Bay-Mouth Shoals are the least abundant zone, covering 4.4 km², or 2.6% of the study area. Water depths range from 0 to 17 m. Bottom Sediment TextureBottom samples from the study area contained nearly all components of the particle size spectrum (fig. 4.10). Sediment texture ranged from sandy silt in Nearshore Basins to pebbles, cobbles, and boulders in Rocky Zones (table 4.2). No meaningful correlation exists between mean grain size and water depth; both coarse- and fine-grained sediment were collected in all water depths (fig. 4.11). In general, the sediment was poorly sorted with respect to grain size.
Gravel is the least common bottom sediment sampled. Large particles greater than 2 mm in diameter comprise an average of 6.5% of all samples by weight. Only two samples contained more than 50% gravel, but at least some gravel-size material was collected from 48% of the sample sites. Gravel most commonly occurs in Rocky Zones (average 55.9%), where it comprises a major component of glacial deposits and surrounds the base of rock outcrops. Samples from other zones average less than 5% gravel. Gravel is probably underrepresented in these grab samples due to problems collecting large diameter particles and the need for large samples to perform statistically valid analyses. Sidescan sonar observations suggest that gravel is probably more abundant than indicated by sampling alone. Table 4.2. Location, depth, and textural properties for stations where sediment samples were collected. See Map Sheet 5, panel C for the textural data overlain on backscatter intensity. See Appendix I for a GIS database with links to texture data and bottom photographs, and for locations of all stations where no samples were collected. Detailed sediment texture data are available in Appendix II and links to bottom photographs at each station in Appendix III.
Key to sediment descriptions (Folk, 1974): Geologic Framework and Late Quaternary EvolutionThe physiography and surficial sediment of the inner continental shelf offshore of northeastern Massachusetts reflect the region's underlying geologic framework and complex late Quaternary history. Bedrock controls the overall geometry of the coast and inner shelf, where resistant intrusive rocks form rugged coastal headlands and submarine shoals and ridges. No major rivers deliver significant sediment to the area, so reworking of existing deposits (mostly glacial in origin) determines the observed distribution of bottom sediment. Modern processes interact with bedrock and glacial sediment to create the sandy beaches and other coastal landforms extant along the present shoreline. Glaciation and relative sea-level change are the most important processes to act on the region, and have produced a heterogeneous mix of bottom types on the inner continental shelf. SummaryThe inner continental shelf between Nahant and Gloucester, Massachusetts is a bedrock-framed, glaciated seafloor. The area possesses sedimentary deposits whose distribution and characteristics are largely dictated by the inherited geologic framework, glaciation, and changes in relative sea-level. The shape of the pre-glacial bedrock surface controls the overall geometry of the coast and shelf. Changes in relative sea level have allowed terrestrial and marine processes to repeatedly operate over the inner shelf and coast, exerting great influence on the stratigraphy and surficial geology of the region. The initial transgression, which accompanied deglaciation, and regression were times of major sediment introduction to the shelf. The ongoing transgression is largely a period of sediment reworking, in which sand and silt derived from glacial deposits has been redistributed across the shelf and coarser material left behind as mounds of pebbles, cobbles, and boulders. These shoreline migrations, driven by changing sea level, have repeatedly winnowed older deposits between the present coast and the lowstand shoreline, largely removing sediment cover from bedrock highs and etching a distinct unconformity that separates Pleistocene and Holocene sedimentary sequences. Bathymetrically high areas, covered with coarse material up to boulder size, are probably eroded remnants of morainal ridges and other glacial deposits. |
|
![]() To view files in PDF format, download free copy of Adobe Reader.
To view files in PDF format, download free copy of Adobe Reader.
 Back to Data
 ![]() To Top of Page
To Top of Page  Forward to Next Section