Woods Hole Science Center
Title Page / Table of Contents / List of Figures / Introduction / Maps / Data Collection/Processing / Interpretation / Acknowledgments / Appendix 1 / Appendix 2 / Appendix 3 / Appendix 4
 |
 |
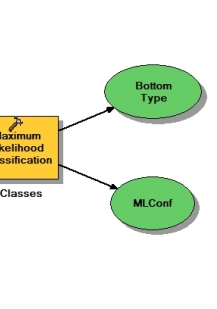 |
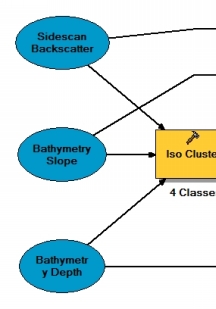
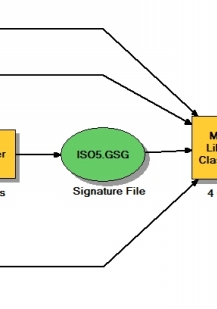
Figure 4.2. Model builder schematic of multivariate analysis, showing input data (depth, slope, acoustic backscatter) and processing steps used to create map in figure 4.3. | ||