Woods Hole Science Center
Title Page / Table of Contents / List of Figures / Introduction / Maps / Data Collection/Processing / Interpretation / Acknowledgments / Appendix 1 / Appendix 2 / Appendix 3 / Appendix 4
 |
 |
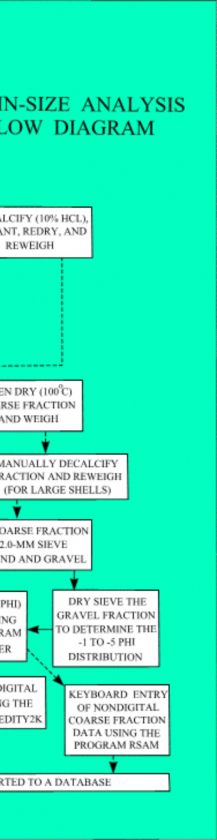 |
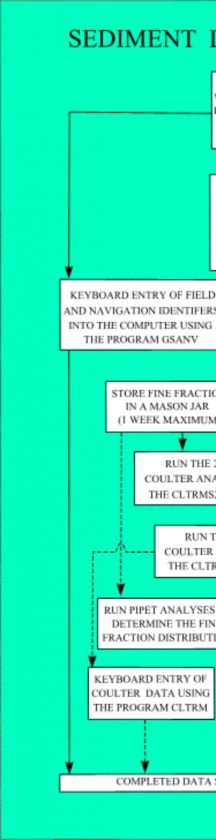
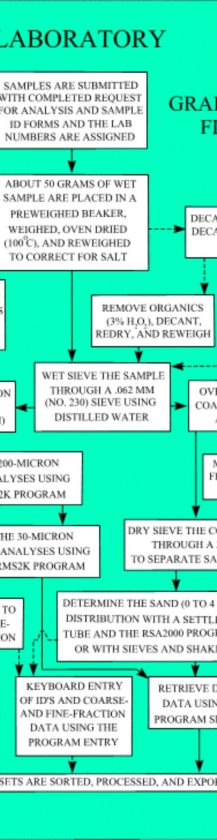
Figure 3.8. Flow diagram showing steps in laboratory analysis of sediment samples (Poppe and Polloni, 2000). | ||