Online Links:
Online Links:
| Range of values | |
|---|---|
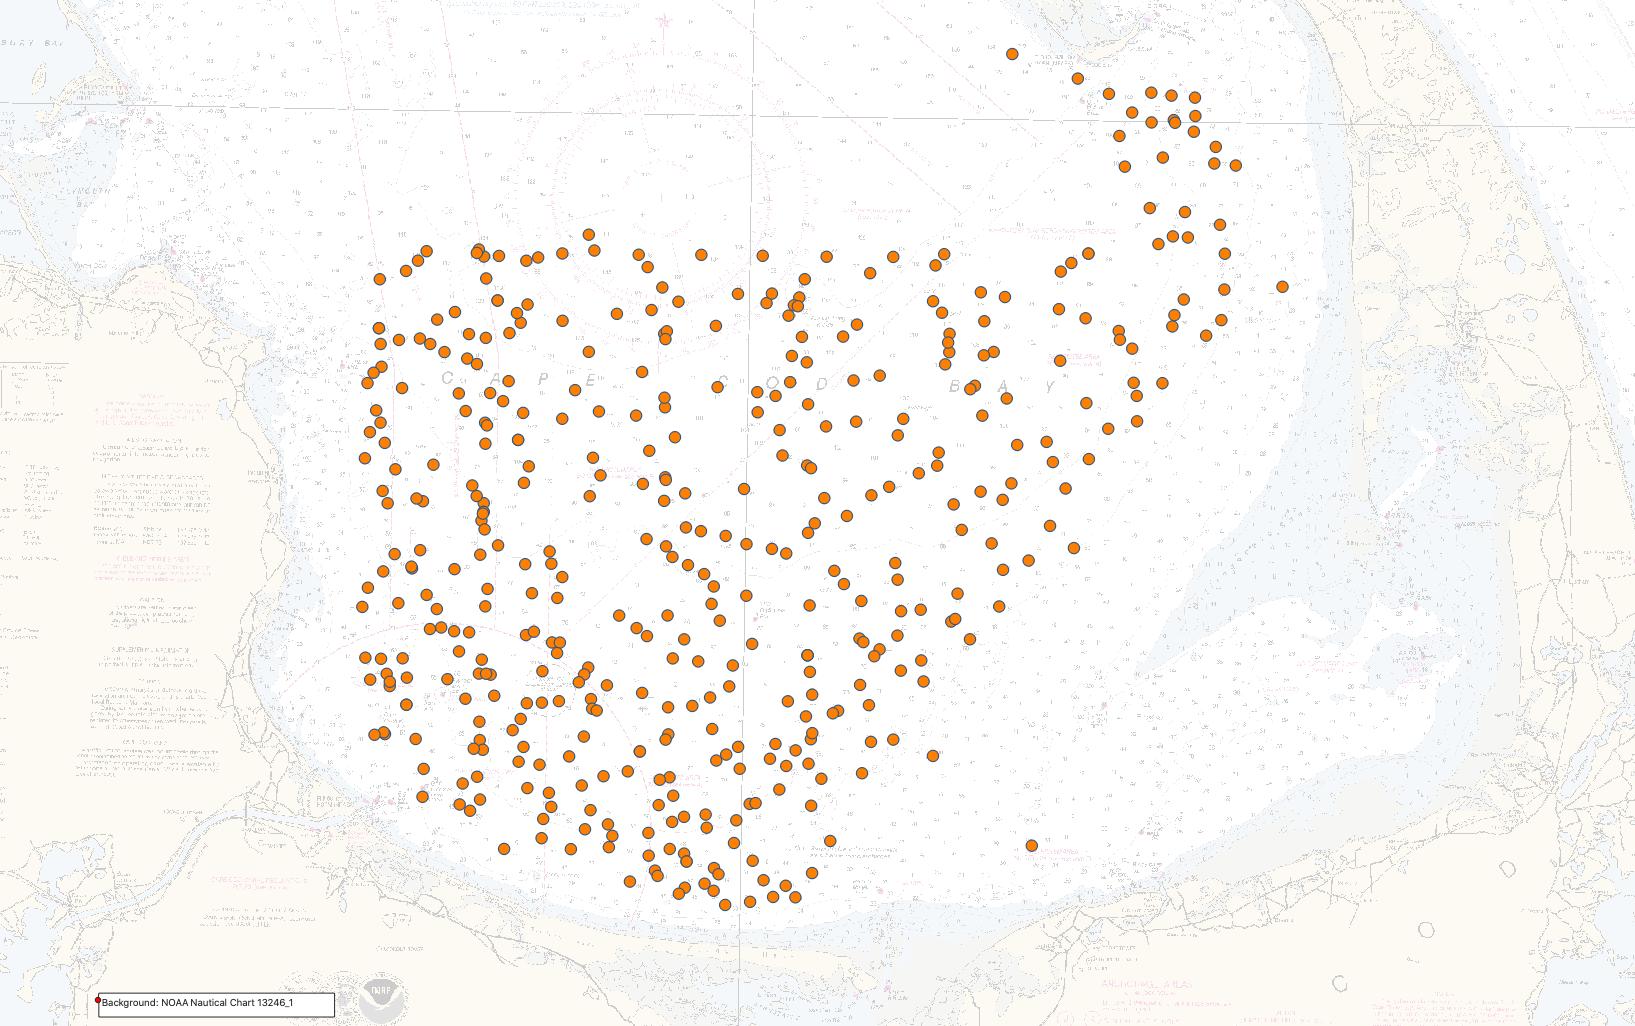
| Minimum: | -70.495560 |
| Maximum: | -70.106390 |
| Units: | degrees |
| Resolution: | .000001 |
| Range of values | |
|---|---|
| Minimum: | 42.020830 |
| Maximum: | 41.749170 |
| Units: | degrees |
| Resolution: | .000001 |
Online Links:
Online Links:
Online Links:
Online Links:
| Access_Constraints | none |
|---|---|
| Use_Constraints | Public domain data from the U.S. Government are freely redistributable with proper metadata and source attribution. Please recognize the U.S. Geological Survey as the originator of the dataset. |
| Data format: | Shapefile of sound velocity profile data cast locations collected by the U.S. Geological Survey - Woods Hole Coastal and Marine Science Center in Cape Cod Bay, Massachusetts during USGS Field Activity 2019-002-FA and the associated metadata. in format Shapefile (version Spatialite 5.0.1) Shapefile Size: 0.1 |
|---|---|
| Network links: |
https://cmgds.marine.usgs.gov/data-releases/media/2021/10.5066-P99DR4PN/6c71f5d2e53d4cf4b2db26b3748c4984/2019-002-FA_MVPSVP_data.zip https://cmgds.marine.usgs.gov/data-releases/datarelease/10.5066-P99DR4PN/ https://doi.org/10.5066/P99DR4PN |
| Data format: | The zip file contains CARIS SVP text files of sound speed profile data collected by the U.S. Geological Survey - Woods Hole Coastal and Marine Science Center in Cape Cod Bay, Massachusetts during USGS Field Activity 2019-002-FA and the associated metadata. in format SVP (version 1.0) CARIS ASCII file format (SVP) Size: 0.4 |
|---|---|
| Network links: |
https://cmgds.marine.usgs.gov/data-releases/media/2021/10.5066-P99DR4PN/6c71f5d2e53d4cf4b2db26b3748c4984/2019-002-FA_MVPSVP_data.zip https://cmgds.marine.usgs.gov/data-releases/datarelease/10.5066-P99DR4PN/ https://doi.org/10.5066/P99DR4PN |
| Data format: | The zip file contains sound speed profile images of sound speed profile data collected by the U.S. Geological Survey - Woods Hole Coastal and Marine Science Center in Cape Cod Bay, Massachusetts during USGS Field Activity 2019-002-FA and the associated metadata. in format PNG (version ImageMagick (version 7.0.8-11)) Portable Network Graphic (PNG) Size: 20 |
|---|---|
| Network links: |
https://cmgds.marine.usgs.gov/data-releases/media/2021/10.5066-P99DR4PN/6c71f5d2e53d4cf4b2db26b3748c4984/2019-002-FA_MVPSVP_data.zip https://cmgds.marine.usgs.gov/data-releases/datarelease/10.5066-P99DR4PN/ https://doi.org/10.5066/P99DR4PN |