Multibeam backscatter data collected in Cape Cod Bay, Massachusetts during USGS Field Activity 2019-002-FA, using a dual-head Reson T20-P multibeam echo sounder (8-bit GeoTIFF, UTM Zone 19N, WGS84, 1-m resolution)

Metadata also available as - [Outline] - [Parseable text] - [XML]

Frequently anticipated questions:


What does this data set describe?

Title:
Multibeam backscatter data collected in Cape Cod Bay, Massachusetts during USGS Field Activity 2019-002-FA, using a dual-head Reson T20-P multibeam echo sounder (8-bit GeoTIFF, UTM Zone 19N, WGS84, 1-m resolution)
Abstract:
Accurate data and maps of sea floor geology are important first steps toward protecting fish habitat, delineating marine resources, and assessing environmental changes due to natural or human impacts. To address these concerns the U.S. Geological Survey, in cooperation with the Massachusetts Office of Coastal Zone Management (CZM), comprehensively mapped the Cape Cod Bay sea floor to characterize the surface and shallow subsurface geologic framework. Geophysical data collected include swath bathymetry, backscatter, and seismic reflection profile data. Ground-truth data, including sediment samples, underwater video, and bottom photographs were also collected. This effort is part of a long-term collaboration between the USGS and the Commonwealth of Massachusetts to map the State’s waters, support research on the Quaternary evolution of coastal Massachusetts, the influence of sea-level change and sediment supply on coastal evolution, and efforts to understand the type, distribution, and quality of subtidal marine habitats. This collaboration produces high-resolution geologic maps and Geographic Information System (GIS) data that serve the needs of research, management and the public. Data collected as part of this mapping cooperative continue to be released in a series of USGS Open-File Reports and Data Releases (https://www.usgs.gov/centers/whcmsc/science/geologic-mapping-massachusetts-seafloor). This data release provides the geophysical and geologic sampling data collected in Cape Cod Bay during USGS Field Activities 2019-002-FA and 2019-034-FA in 2019.
Supplemental_Information:
Additional information on the field activities associated with this project are available at https://cmgds.marine.usgs.gov/fan_info.php?fan=2019-002-FA and https://cmgds.marine.usgs.gov/fan_info.php?fan=2019-034-FA.
  1. How might this data set be cited?
    Ackerman, Seth D., 20220718, Multibeam backscatter data collected in Cape Cod Bay, Massachusetts during USGS Field Activity 2019-002-FA, using a dual-head Reson T20-P multibeam echo sounder (8-bit GeoTIFF, UTM Zone 19N, WGS84, 1-m resolution): data release DOI:10.5066/P99DR4PN, U.S. Geological Survey, Coastal and Marine Hazards and Resources Program, Woods Hole Coastal and Marine Science Center, Woods Hole, Massachusetts.

    Online Links:

    This is part of the following larger work.

    Ackerman, Seth D., Foster, David S., Andrews, Brian D., Danforth, William W., Baldwin, Wayne E., Huntley, Emily C., Worley, Charles R., and Brothers, Laura L., 2022, High-resolution geophysical and geological data collected in Cape Cod Bay, Massachusetts during USGS Field Activities 2019-002-FA and 2019-034-FA: data release DOI:10.5066/P99DR4PN, U.S. Geological Survey, Reston, VA.

    Online Links:

    Other_Citation_Details:
    Suggested citation: Ackerman, S.D., Foster, D.S., Andrews, B.D., Danforth, W.W., Baldwin, W.E., Huntley, E.C., Worley, C.R., and Brothers, L.L., 2022, High-resolution geophysical and geological data collected in Cape Cod Bay, Massachusetts during USGS Field Activities 2019-002-FA and 2019-034-FA: U.S. Geological Survey data release, https://doi.org/10.5066/P99DR4PN.
  2. What geographic area does the data set cover?
    West_Bounding_Coordinate: -70.503320
    East_Bounding_Coordinate: -70.074238
    North_Bounding_Coordinate: 42.049562
    South_Bounding_Coordinate: 41.745533
  3. What does it look like?
    https://cmgds.marine.usgs.gov/data-releases/media/2021/10.5066-P99DR4PN/39044ad7f9154298a8fa47ee5fa5805c/2019-002-FA_T20P_Backscatter_1m_browse.jpg (JPEG)
    Thumbnail image of 1-m multibeam echo sounder backscatter data collected in Cape Cod Bay, Massachusetts.
  4. Does the data set describe conditions during a particular time period?
    Beginning_Date: 01-Aug-2019
    Ending_Date: 29-Aug-2019
    Currentness_Reference:
    ground condition during field activity 2019-002-FA: 20190801-20190829
  5. What is the general form of this data set?
    Geospatial_Data_Presentation_Form: raster digital data
  6. How does the data set represent geographic features?
    1. How are geographic features stored in the data set?
      This is a Raster data set. It contains the following raster data types:
      • Dimensions 33237 x 35102 x 1, type Grid Cell
    2. What coordinate system is used to represent geographic features?
      Grid_Coordinate_System_Name: Universal Transverse Mercator
      Universal_Transverse_Mercator:
      UTM_Zone_Number: 19
      Transverse_Mercator:
      Scale_Factor_at_Central_Meridian: 0.9996
      Longitude_of_Central_Meridian: -69
      Latitude_of_Projection_Origin: 0
      False_Easting: 500000
      False_Northing: 0
      Planar coordinates are encoded using row and column
      Abscissae (x-coordinates) are specified to the nearest 1.0
      Ordinates (y-coordinates) are specified to the nearest 1.0
      Planar coordinates are specified in meters
      The horizontal datum used is WGS_1984.
      The ellipsoid used is WGS_84.
      The semi-major axis of the ellipsoid used is 6378137.0.
      The flattening of the ellipsoid used is 1/298.257223563.
  7. How does the data set describe geographic features?
    Entity_and_Attribute_Overview:
    Acoustic reflectance values of the nearshore sea floor in Cape Cod Bay, Massachusetts.
    Entity_and_Attribute_Detail_Citation: U.S. Geological Survey

Who produced the data set?

  1. Who are the originators of the data set? (may include formal authors, digital compilers, and editors)
    • Seth D. Ackerman
  2. Who also contributed to the data set?
    The authors acknowledge our fellow participants of the Cape Cod Bay field activities 2019-002-FA (Walter Barnhardt, Luke Bennett, Eric Moore, Alex Nichols, Jake Fredericks, and Dan Kennedy) and 2019-034-FA (Dann Blackwood, Eric Moore, and Alex Nichols); the crew of the M/V Warren Jr and the R/V Tioga; and our sea floor mapping group onshore support team during these surveys (Jane Denny, PJ Bernard, Barry Irwin, and Emile Bergeron).
  3. To whom should users address questions about the data?
    Seth Ackerman
    U.S. Geological Survey
    Geologist
    384 Woods Hole Rd.
    Woods Hole, MA
    USA

    508-548-8700 x2315 (voice)
    508-457-2310 (FAX)
    sackerman@usgs.gov

Why was the data set created?

This dataset provides a high-resolution multibeam backscatter mosaic of the seabed created from sonar data collected by the U.S. Geological Survey during survey 2019-002-FA in Cape Cod Bay, Massachusetts. The multibeam backscatter mosaic will be used in conjunction with other geophysical and sample data to investigate the morphology and geologic framework of the sea floor and coastal environment in Cape Cod Bay Massachusetts.

How was the data set created?

  1. From what previous works were the data drawn?
    Reson T20P multibeam echo sounder raw bathymetry and backscatter (source 1 of 1)
    U.S. Geological Survey, Unpublished Material, raw MBES data in s7k format.

    Type_of_Source_Media: disc
    Source_Contribution:
    Multibeam echo sounder (MBES) bathymetry and backscatter data were collected using dual-head Reson T20-P sonars aboard the M/V Warren Jr. The system was pole-mounted on the port side of the vessel with the transducers located approximately 4.13 m below the waterline when deployed. Vessel navigation and attitude data were acquired using an Applanix POS MV Wavemaster (model 220, V5). An AML Micro X SV mounted on the sonar bracket monitored sound speed near the sonars during acquisition, and an AML MVP30 moving vessel profiler (MVP) or an AML Minos X sound velocity profiler (SVP) was deployed from the stern of the vessel to collect water column sound speed profiles at 1 to 4 hour intervals while underway (See shapefile 2019-002-FA_MVPSVP_data.shp available from the larger work citation). The Reson SeaBat User Interface (version 5.0.0.6) was used to control the sonars, as well as to monitor and record the sonar data. Hypack Hysweep (version 2019, 19.0.6.0) was also used to record and monitor the sonar data. The SeaBat User Interface logged the navigation, attitude, bathymetry, time-series backscatter, and water column data to s7k format files for each sonar. The line files were created by the Reson UI using the following naming convention: YYYYMMDD_HHMMSS_M/S. The line files were appended with a "M" or "S" suffix to denote the port (primary) and starboard (or secondary) sonar heads, respectively. Hypack Hysweep 2019 also was used to log the navigation, attitude, and bathymetry data for both sonars to a single HSX format file. Hypack Hysweep filenames have the format 'YYYYMMDD_HHMMSS_LLL_HHMM', which prepends the Reson filename (YYYYMMDD_HHMMSS) to the Hypack Hysweep filename (LLL_HHMM), where LLL indicates the three digit planned line number and HHMM is the UTC time. The Reson SeaBat User Interface s7k data were used to produce the final processed backscatter mosaic.
  2. How were the data generated, processed, and modified?
    Date: Aug-2019 (process 1 of 3)
    PROCESSING STEP 1: QIMERA DATA PROCESSING. Multibeam bathymetry processing within QPS Qimera (version 1.7.6) during the survey consisted of the following flow:
    1) A Qimera project (version 1.7.6) was created with projection information set to Universal Transverse Mercator (UTM) Zone 19N, WGS 84.
    2) Each Hysweep HSX file was imported to the new Qimera project.
    3) Navigation was reviewed and edited as needed.
    4) Sound velocity correction was applied using the CARIS-formatted MVP or SVP data.
    5) 5-m resolution Dynamic Surfaces were created to incorporate all the sonar data as they were processed, and the surfaces were reviewed for inconsistencies and anomalies.
    6) The swath and area-based editors were used to remove spurious points through manual editing and filter application.
    7) Each survey line was exported into separate Sonar Head 1 and Sonar Head 2 files from Qimera in GSF format for pairing with the corresponding raw s7k files in QPS FMGT (see next step).
    The contact person for this and all subsequent processing steps below is Seth Ackerman. Person who carried out this activity:
    Seth Ackerman
    U.S. Geological Survey
    Geologist
    384 Woods Hole Rd.
    Woods Hole, MA
    USA

    508-548-8700 x2315 (voice)
    508-457-2310 (FAX)
    sackerman@usgs.gov
    Date: Nov-2021 (process 2 of 3)
    PROCESSING STEP 2: QPS FMGT PROCESSING
    Backscatter mosaics were created using QPS FMGT (v. 7.7.5 and 7.10.0) processing software. Raw s7k files containing the time series values, were paired with the GSF data exported from each survey line file containing the depth data to create a 1-meter resolution time series backscatter mosaic that followed the steps below.
    1) Create new FMGT project for the Cape Cod Bay using UTM 19N, WGS 84 coordinate system.
    2) Set processing parameters for T20-P Sonar (defaults)
    3) Set filter method to flat 300
    4) Add source/paired files using the T20P s7k files for the backscatter files, and GSF files exported from from Qimera. All the s7k and GSF files were added by Julian day. Once the line files were added to the project a 1-meter draft mosaic was created using the "time-series" as the backscatter source for each Julian day for review.
    5) Final 1-meter mosaics were created for groupings of survey lines (typically 2-3 adjacent survey days) and visually reviewed for inconsistencies or anomalies. Individual line files were moved up or down in the mosaic order to increase quality if needed. The "Backscatter Adjustment" tool was used to increase or decrease intensity of individual lines as required to visually match adjacent lines.
    6) The resulting mosaics were exported out of QPS FMGT as 8-bit gray-scale GeoTIFFs.
    Date: Dec-2021 (process 3 of 3)
    PROCESSING STEP 3: MERGING GEOTIFF MOSAICS
    Using Global Mapper (version 19.0), the individual GeoTIFFs were exported as single 8-bit gray-scale GeoTIFF for 3 distinct areas within the survey area (EW trending survey lines, NS trending survey lines, and the lines near Truro). Finally, the three smaller mosaics were merged using Esri ArcPro's Mosaic to New Raster tool with the Mosaic Operation set to Mean.
  3. What similar or related data should the user be aware of?
    Pendleton, E.A., Baldwin, W.E., Barnhardt., W.A., Ackerman, S.D., Foster, D.S., Andrews, B.D., and Schwab, W.C., 2013, Shallow Geology, Sea-floor Texture, and Physiographic Zones of the Inner Continental Shelf from Nahant to Northern Cape Cod Bay, Massachusetts: Open-File Report 2012-1157, U.S. Geological Survey, Coastal and Marine Geology Program, Woods Hole Coastal and Marine Science Center, Woods Hole, MA.

    Online Links:

    Andrews, B.D., Ackerman, S.D., Baldwin, W.E., and Barnhardt, W.A., 2010, Geophysical and Sampling Data from the Inner Continental Shelf: Northern Cape Cod Bay, Massachusetts: Open-File Report 2010-1006, U.S. Geological Survey, Coastal and Marine Geology Program, Woods Hole Coastal and Marine Science Center, Woods Hole, MA.

    Online Links:

    Ackerman, Seth D., Foster, David S., Danforth, William W., and Huntley, Emily C., 2019, High-resolution geophysical and sampling data collected off Town Neck Beach in Sandwich, Massachusetts, 2016: data release DOI:10.5066/P9HZHXXV, U.S. Geological Survey, Reston, VA.

    Online Links:

    Other_Citation_Details:
    Suggested citation: Ackerman S.D., Foster D.S., Danforth W.W., and Huntley, E.C., 2019, High-resolution geophysical and sampling data collected off Town Neck Beach in Sandwich, Massachusetts, 2016: U.S. Geological Survey data release, https://doi.org/10.5066/P9HZHXXV.

How reliable are the data; what problems remain in the data set?

  1. How well have the observations been checked?
  2. How accurate are the geographic locations?
    Navigation data were acquired using the WGS 84 coordinate system with an Applanix POS MV Wavemaster (model 220, V5), which blends Global Navigation Satellite Systems (GNSS) with acceleration data from a Motion Reference Unit (MRU) and GPS azimuthal heading. The POS MV was configured with two AeroAntenna Technologies GPS antennas located at either end of a 2-m baseline, which was oriented fore and aft and mounted atop the MBES pole, approximately midships on the port side of vessel. DGPS positions are horizontally accurate to 0.5 - 2 meters, but accuracy improves to less than 10 cm after post-processing with Applanix POSPac (version 8.1).
  3. How accurate are the heights or depths?
  4. Where are the gaps in the data? What is missing?
    Data were collected on the following dates: 20190801-20190829 (Julian day 213-241); sonar data from 20190801 (Julian day 213) and 20190827 (Julian day 239) includes data processed for performing the patch test to calibrate the multibeam sonar but these data were not incorporated into the final bathymetry or backscatter dataset since the same area was re-occupied on subsequent survey days. Data collected during some turns and along lines that extend beyond the area of a continuous backscatter mosaic were also excluded.
  5. How consistent are the relationships among the observations, including topology?
    This backscatter mosaic represents processed dual-head Reson T20-P multibeam echo sounder (MBES) time series data gridded at 1-m resolution. Quality control and data processing were conducted to remove spurious points and reduce sound speed artifacts (refraction) using QPS Qimera (version 1.7.6) and QPS FMGT (version 7.7.5 and 7.10.0). Despite this processing, small areas of vessel motion and refraction artifacts remain in the data. Small "no data" gaps exist throughout the dataset. These are the result of editing the artifacts and, in some areas, eliminating low quality soundings. In addition, gaps exist in shallow areas where underwater obstructions created hazards for the safe navigation of the survey vessel.
    While navigation and attitude data in the backscatter data and coincident bathymetry data (see larger work citation https://doi.org/10.5066/P99DR4PN) are identical the extents of the processed bathymetry grid and backscatter mosaic differs slightly due to differences in processing. Cross lines, collected to check tide corrections in bathymetry data and to provide dip angle seismic profile data, were not added to this backscatter imagery.

How can someone get a copy of the data set?

Are there legal restrictions on access or use of the data?
Access_Constraints none
Use_Constraints Public domain data from the U.S. Government are freely distributable with proper metadata and source attribution. Please recognize the U.S. Geological Survey as the originator of the dataset.
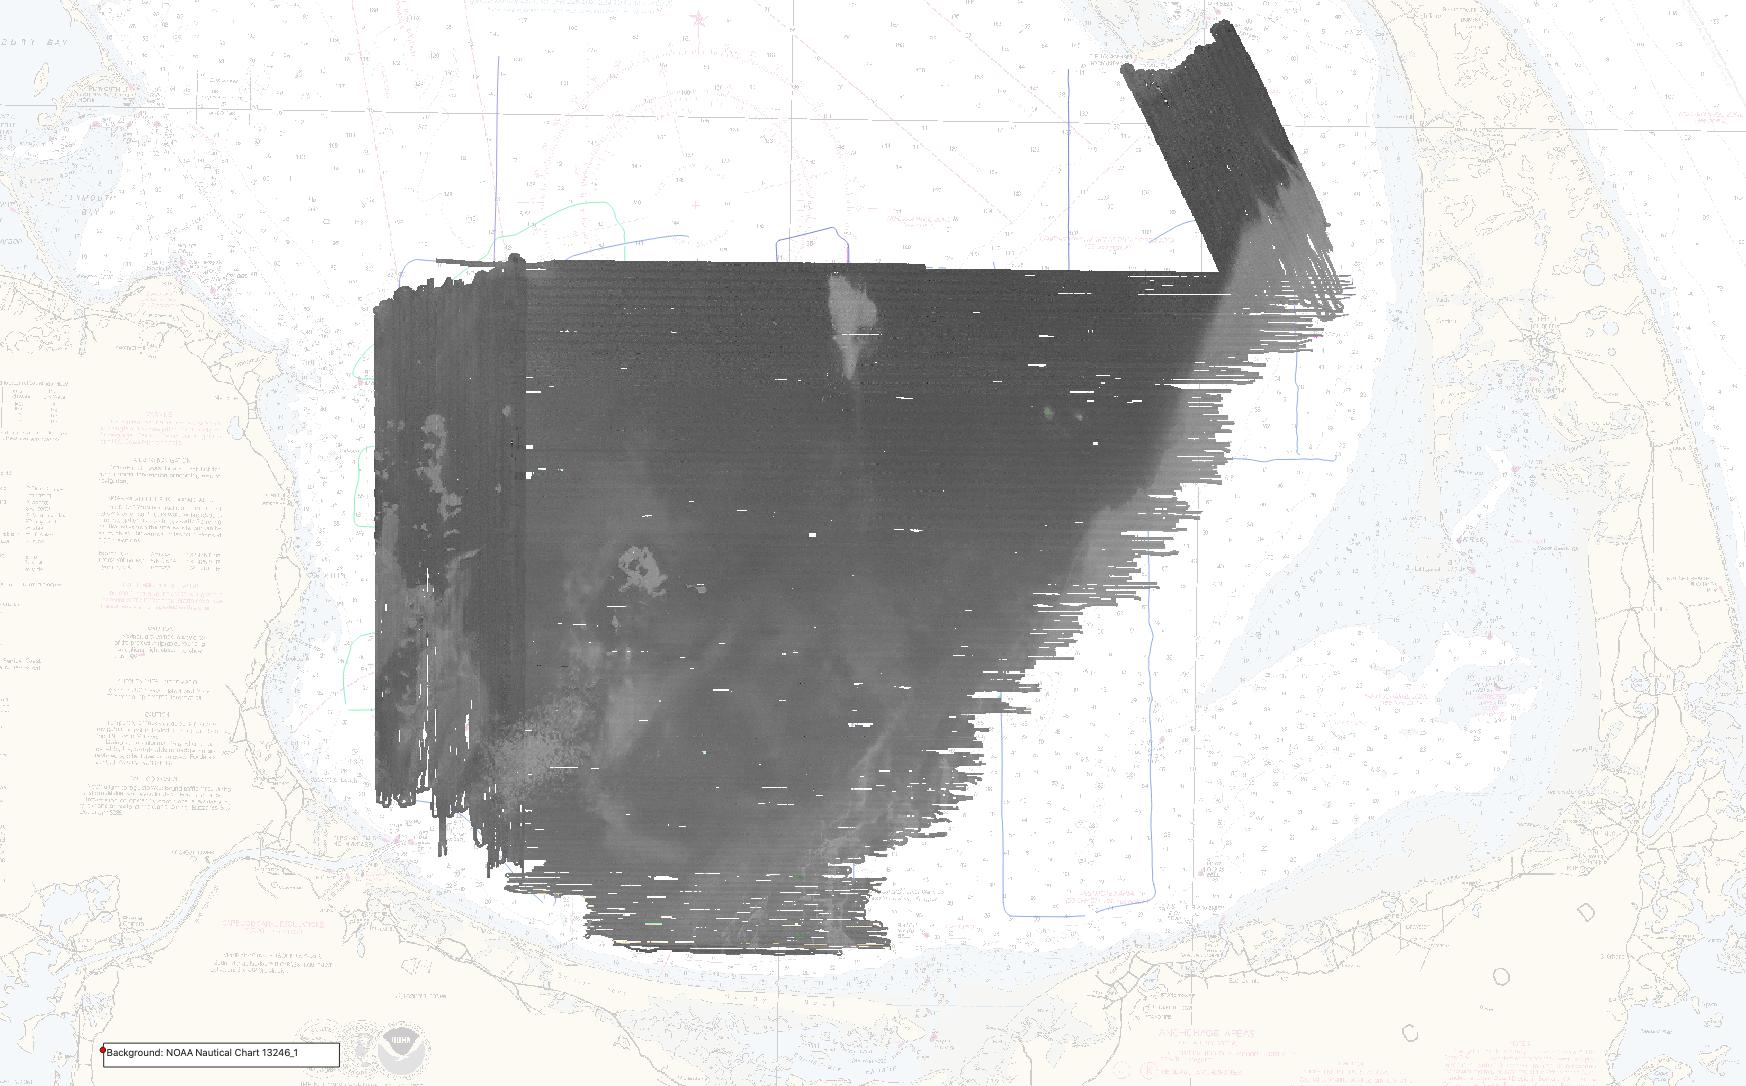
  1. Who distributes the data set? (Distributor 1 of 1)
    Seth Ackerman
    U.S. Geological Survey
    Geologist
    384 Woods Hole Rd.
    Woods Hole, MA
    USA

    508-548-8700 x2315 (voice)
    508-457-2310 (FAX)
    sackerman@usgs.gov
  2. What's the catalog number I need to order this data set? Multibeam backscatter data collected in Cape Cod Bay, Massachusetts during USGS Field Activity 2019-002-FA, using a dual-head Reson T20-P multibeam echo sounder: includes the GeoTIFF image 2019-002-FA_T20P_Backscatter_1m.tif, world file 2019-002-FA_T20P_Backscatter_1m.tfw, browse graphic 2019-002-FA_T20P_Backscatter_1m_browse.jpg, and Federal Geographic Data Committee (FGDC) Content Standards for Digital Geospatial Metadata (CSDGM) metadata files (2019-002-FA_T20P_Backscatter_1m_meta.xml)
  3. What legal disclaimers am I supposed to read?
    Neither the U.S. Government, the Department of the Interior, nor the USGS, nor any of their employees, contractors, or subcontractors, make any warranty, express or implied, nor assume any legal liability or responsibility for the accuracy, completeness, or usefulness of any information, apparatus, product, or process disclosed, nor represent that its use would not infringe on privately owned rights. The act of distribution shall not constitute any such warranty, and no responsibility is assumed by the USGS in the use of these data or related materials. Although these data and associated metadata have been reviewed for accuracy and completeness and approved for release by the U.S. Geological Survey (USGS), and have been processed successfully on a computer system at the USGS, no warranty expressed or implied is made regarding the display or utility of the data for other purposes, nor on all computer systems, nor shall the act of distribution constitute any such warranty. The USGS or the U.S. Government shall not be held liable for improper or incorrect use of the data described and/or contained herein. Any use of trade, firm, or product names is for descriptive purposes only and does not imply endorsement by the U.S. Government.
  4. How can I download or order the data?
  5. What hardware or software do I need in order to use the data set?
    To utilize these data, the user must have software capable of viewing GeoTIFF files.

Who wrote the metadata?

Dates:
Last modified: 18-Jul-2022
Metadata author:
Seth Ackerman
U.S. Geological Survey
Geologist
384 Woods Hole Rd.
Woods Hole, MA
USA

508-548-8700 x2315 (voice)
508-457-2310 (FAX)
sackerman@usgs.gov
Metadata standard:
Content Standards for Digital Geospatial Metadata (FGDC-STD-001-1998)

This page is <https://cmgds.marine.usgs.gov/catalog/whcmsc/DRB_data_release/DRB_P99DR4PN/2019-002-FA_T20P_Backscatter_1m_meta.faq.html>
Generated by mp version 2.9.51 on Mon Sep 19 09:45:24 2022