
|
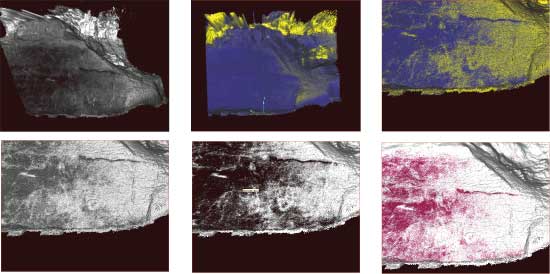
Color Channel & Intensity models of the Trench WallClick on image for larger view (32-86KB)
Viewing the trench wall with substitute false-colors, enhanced contrast, and intensity filters allows us to see features muted in natural light. Color Channel and Intensity Models: The USGS LiDAR unit has a pulse laser and a separate RGB color sensor. In bright light conditions, this color sensor tags each pulse-path with an RGB color value, even when no laser pulse is returned (e.g. sky points). The laser sensor only detects the near infrared of the laser light, though is also can measure the attenuation of the light intensity of the pulse. On the left, we manipulate the intensity and enhance the contrast of the color using intensity filters and substitute (false) colors. One promising technique for viewing difficult to see features is to establish a threshold intensity for a color transition. Similar techniques with higher resolution should be possible with an intensity sensitive digital camera. |
|||||||||||
|
Abstract | Vedanta Ranch Trench | Color Channel & Intensity Models of the Trench Wall | Olema Ridge Trench
|
||||||||||||
geotech/olema/color.html
contact: Robert Kayen
last modified 2018