USGS PCMSC

LIDAR Imagery of the San Andreas Fault zone at the Vedanta and
Olema Ridge Paleoseismic Trench sites, Pt. Reyes, CA

Index Back to Home Page About These Web Pages Summary Olema Ridge Trench Color Channel & Intensity Models of the Trench Wall Vedanta Ranch Trench Abstract

Olema Ridge Trench

3 views of the site from 1906, 2003 and 2004, and one of inside the trench.

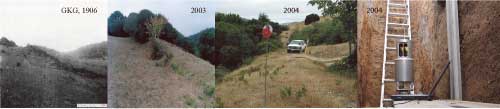
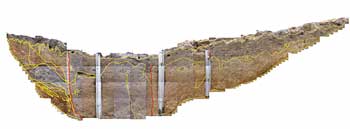
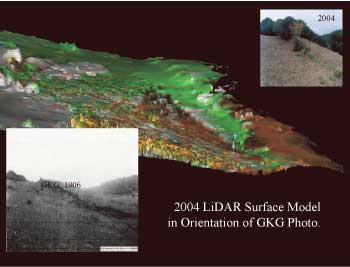
Georeferencing: G.K. Gilbert photographed the Olema Ridge site in 1906, and that photograph was, in part, the inspiration for locating the trench site at this site. With the trench opened, we used LiDAR inside the trench and on the surface. The reflector points in the third image is one of a suite of georeferencing control points. We use the light intensity threshold filter in I-Site Studio to pick our our control points and tag them with a GPS position.

3 views of the surface modeling and one photo of the trench.

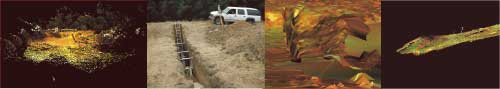
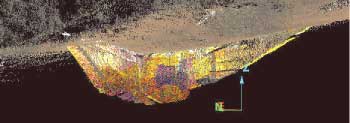
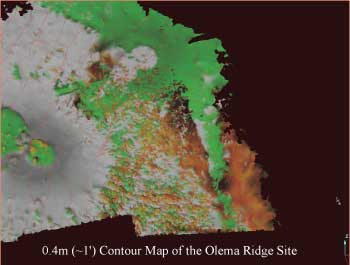
Solid Surface Modeling: The point cloud data on the left contains all the vegetation-points of the field in 2004. We applied the topography and proximity filters to eliminate the vegetation as well as model the trench. In the event of a new surface rupture at this site, the spacial characteristics of the ground deformation-field in the vicinity of the scarp can be mapped to sub-centimeter accuracy.

Photo mosaic of trench wall. PHOTO MOSAIC

(click on photo for larger image, 53KB)

LIDAR MODEL

(click on photo for larger image, 33KB)

LiDAR model of the trench, viewed from beneath the surface.
Visualization of the Solid Earth : The point cloud data and solid surface allows us to visualize the trench and scarp in unusual ways. Here, the trench is viewed from beneath the ground surface and in alignment with the scarp in areas now densely vegetated. The geometry of the trench is identical to the photomosaic taken with a digital camera. The LIDAR can also be used to measured to plan a dig, direct bracing, and focus drainage efforts.
2004 LiDar surface model in orientation of GKG photo

(click on photo for larger image, 38 KB)

Removal of Vegetation: Visualizing the scarp as Gilbert saw it requires the removal of nearly 100 years of vegetation. Several filtering tools in our processing lab software (I-Site Studio) allow for ‘de-vegetation’ of the growth. First we apply a topographic filter that grids our point cloud data into tight X,Y bins that are infinitely tall. Then, the lowest topographic point is selected from the bin. This may filter down to the bald earth, or the lowest vegetation point. We finally apply a surface proximity filter that looks for, and eliminates spurious elevation points floating above neighboring points in adjacent bins. Careful application of the topographic and proximity filters, along with manual point rejection, reduce the image to a bald earth model that we can use to create a solid triangulated surface.
Solid Surface Modeling: After we filter the data to create a bald-earth model a solid triangulated surface or spherical triangulated surface can be computed from the point cloud data. Multiple solid surfaces can be fused to make a larger more continuous surface of the ground. This is the ideal medium for difference calculations and change detection in ground deformation studies.
Contour map of the Olema ridge site(click on photo for larger image, 38 KB)


Abstract | Vedanta Ranch Trench | Color Channel & Intensity Models of the Trench Wall | Olema Ridge Trench
Summary | About These Web Pages | Geotech Home Page


 Previous page, Color Channel & Intensity Models of the Trench Wall  Title Page  Next page, Summary  Return to Geotech Home Page  Pacific Coastal and Marine Science Center


geotech/olema/olema.html
contact: Robert Kayen
last modified 2018