 |
|
|
||||
| Open-File Report 2005-1001 |
|
|
|
|
U.S. Geological Survey
Open-File Report 2005-1001
USGS East-Coast Sediment
Analysis: Procedures, Database, and
GIS
Data
| SOFTWARE | |||||||
|
|
|
|||||
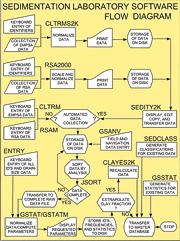
Software Overview
The adjacent diagram outlines the software sequence of operation in a generalized flow diagram for those computer programs used before 2003 in the sedimentation laboratory at the Woods Hole Coastal and Marine Science Center (WHCMSC). The data-acquisition programs RSA2000, CLTRMS2K, and SEDITY2K and the data-processing program CLAYES2K were written in Quick BASIC and run in DOS 3.0 or later and in DOS under Windows 3.1/95/98. The data-acquisition programs GSANV, RSAM, CLTRM, and ENTRY, and the data-processing programs JSORT, GSTAT, and GSTATM are written in C and run under Windows 95/98 in the “Born-Again-Shell” (bash). This shell, which is part of the GNU operating system (Hagerty and others, 1998) distributed by the Free Software Foundation, creates a Unix-like environment under Microsoft Windows 95/98. The post-2003 data processing programs SEDCLASS and GSSTAT are written in Visual BASIC and run under Windows 95/98/ME/NT/2000/XP. Raw data records were created on IBM-compatible computers interfaced with a Rapid Sediment Analyzer (RSA) and Electro-Resistance Multichannel Particle-Size Analyzer (EMPSA) by using the programs RSA2000 and CLTRMS2K, respectively. The user was prompted for all the necessary identifiers, and, upon completion of a satisfactory analysis, the data and identifiers were written to both an output file and a printer. Three raw data records were generated for each sample: an RSA record, a 200 micron aperture tube EMPSA record, and a 30 micron aperture tube EMPSA record. These records each contain a lab number, equipment type, sample identification, project identification, requestor, operator, and analysis date. The RSA data records included sample weight, coarse weight, sand weight, and the relative percentages of the 5 to 1 phi gravel and 0 to 4 phi sand fractions. The EMPSA data records included aperture diameter and tabulated micrometer diameters and the corresponding relative frequency percentages from the size fraction channels collected by the Coulter Counter Multisizer IIe. Although the Multisizer IIe generated 256 channels of data, this accuracy is unnecessary when generating whole-phi grain-size distributions. The program CLTRMS2K combined and reduced the data into a more manageable 16-channel format that is equivalent to the data originally produced by the Coulter Counter Model TAII. The raw RSA and EMPSA data were archived into master files by using the program SEDITY2K. This program also contained utilities to inspect, edit, and print hard copies of the data generated by the RSA2000 and CLTRMS2K programs. Occasionally, distribution and statistics were generated for samples, which were not analyzed or only partially analyzed with the RSA2000 and CLTRMS2K programs. For example, many fine-grained samples did not contain enough sand (< 10 g) to perform settling tube analyses, and the entire coarse fraction (>0.062 mm) was determined by sieving or approximated by visual estimates. When this occurred, a raw data master file was created or updated by keying the raw sediment data directly into a file using the programs RSAM and CLTRM. These programs prompted the user for all of the necessary identifiers and data. The data was then processed as output from the programs RSA2000 or CLTRMS2K. The field and navigation parameters were entered manually using the program GSANV. These parameters and their coding are described in the “Request For Analysis” forms (Form 1; Form 2) which are completed by all personnel who submit samples for particle size analysis. The field and navigation parameters include lab number, latitude, longitude, area, sampling device, water depth, depth in section to the top of the sample, and depth in section to the bottom of the sample.
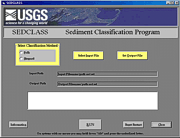
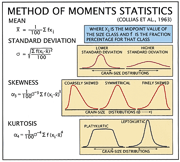
The data-processing program JSORT was used to sort the multi-line records according to lab numbers and to output the records that were complete (all RSA and method of moments statistics, textural nomenclature and EMPSA data, and field and navigation parameters) to an output file for further processing. The program GSTAT was used to retrieve data from the complete, sorted raw data files created by JSORT and to compute the modified frequency percentages, method of moments statistics, textural nomenclature and classification (Wentworth, 1922, 1929; Shepard, 1954), and percentages of gravel, sand, silt, and clay. The modified frequency percentages were given for size distributions up to and including 11 phi to 5 phi. The method of moments statistics included arithmetic mean, median, standard deviation, skewness, kurtosis, modal classes, and modal frequencies. If requested by the user, a hardcopy of this output, which also includes inclusive graphics statistics and verbal equivalents for standard deviation, skewness, and kurtosis (Folk, 1974), was produced. The frequency percentages for the corresponding phi classes were computed by the subroutines MPVC, SUMRY, and WTFP. The cumulative frequency-percent curve used in computing the inclusive graphics statistics was approximated by using the International Mathematical and Statistical Library Inc. (IMSL) routines IQHSCU and ICSEVU. The program SEDCLASS (Poppe and others, 2003) accepts comma-delimited ASCII text files containing percentages of gravel, sand, silt, and clay and will assign sediment classifications based on either the Folk (1954, 1974;) or Shepard (1954) schemes.
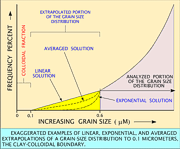
The programs ENTRY and GSTATM allowed the user to generate statistics for pre-existent grain-size data produced outside the software system described above. The program ENTRY permitted input of sediment data as relative frequency percentages at whole-phi intervals; the program GSTATM performed the functions of the program GSTAT on these data. The program GSSTAT (Poppe and others, 2004) accepts comma-delimited ASCII text files containing whole-phi distributions in either cumulative frequency or frequency percents and produces both inclusive graphic statistics and method of moments statistics, percentages of size fractions, verbal descriptions, and sediment classification. Shepard's Correction (Kenny and Keeping, 1951) has been applied to the second and fourth moments about the mean in the statistics generated by the programs GSTAT, GSTATM, and GSSTAT. This correction removes errors introduced by the assumption that each value within a phi class is centered at the midpoint of that class. When creation of a database file was specified in either GSTAT or GSTATM, the cumulative frequency percentages, phi classes, method of moments statistics, and the appropriate identifiers were written to a “pre-database” file in a comma-delimited free field format. Once the data were in a database, multi-variate analyses such as factor analysis or cluster analysis could be applied to retrieved data to help interpret complicated sedimentological phenomena. Because an EMPSA can detect only those particles for which it is calibrated, the tail of the fine fraction produced by this instrumentation (below about 0.6-0.7 microns) is commonly truncated. The program CLAYES2K (Poppe and Eliason, 1999) allowed the user to extrapolate the grain-size distribution contained in the "pre-database" file generated by the program GSTAT to the colloidal-clay boundary. The user could select solutions based on linear or exponential extrapolations, or the mean of both.
The graphic at left presents a stylized plot showing that portion of the grain-size distribution typically truncated by EMPSAs. Also shown in this figure are examples of linear, exponential, and averaged extrapolations of the clay fraction to 0.1 microns available within the program GSSTAT, and the clay-colloidal clay boundary. Errors inherent in the linear and exponential extrapolations have been exaggerated within this figure to more clearly demonstrate their effect on the grain-size distribution. The linear extrapolation tends to slightly overestimate the amount of clay present in a typical distribution and may be used by operators to account for some of the material within the colloidal fraction. The exponential extrapolation tends to underestimate the amount of clay present in a typical distribution and may be used by operators who want data that represents the minimal amount of clay present. Although an operator may select linear or exponential extrapolation, the mean of both extrapolations usually provides the most accurate estimate and is, therefore, the recommended solution for most applications. In addition to SEDCLASS and GSSTAT, other software programs currently being used in the sedimentation laboratory at the WHCMSC include SEDPLOT, CENTRISET, and GRAINSIZE.XLS. The program SEDPLOT generates ternary diagrams to characterize and graphically display sediment grain-size distributions. The inputs for the sediment fractions are percentages of gravel, sand, silt, and clay in the Wentworth (1922) grade scale, and the program permits the user to select output in either the Shepard (1954) classification scheme, as modified by Schlee (1973), or the Folk (1954, 1974) scheme. The program CENTRISET computes settling velocity on the basis of Stokes’ Law for gravitational procedures and computes angular velocity or total time for settling specific particles from a given medium by centrifuge. This program replaces and expands the capabilities of the program CVORT (Poppe and others, 1988). The spreadsheet GRAINSIZE.XLS generates normalized distributions by combining data from the gravel, sand, silt, and clay fractions obtained during typical sediment grain-size analyses RSA2000, CLTRMS2K, SEDITY2K, and CLAYES2K were written and compiled in Microsoft Quick BASIC version 4.5; RSAM, CLTRM, GSANV, JSORT, GSTAT, ENTRY, and GSTATM were originally written in RATFOR (Poppe and others, 1985), but have been rewritten in “C” and compiled with the DJGPP Development System v. 2.01 (Walnut Creek CDROM). The programs SEDCLASS, GSSTAT, and SEDPLOT were written and compiled in Visual BASIC version 6.0; the program CENTRISET was written in Just BASIC; and the GRAINSIZE.XLS spreadsheet was assembled in Microsoft Excel 2003. |
|||||||
| |
|||||||