|
|
|
| Coastal and Marine Geology Program | |
| Woods Hole Science Center | |
![]() U.S.
Geological Survey Open-File Report 2005-1018
U.S.
Geological Survey Open-File Report 2005-1018
Surficial Geologic Interpretation and Sidescan Sonar Imagery of the Sea Floor in
West-Central Long Island Sound
DATA ACQUISITION AND PROCESSING
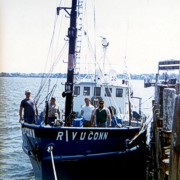
High-resolution seismic-reflection data were obtained with an EG&G Uniboom system aboard the University of Connecticut's Research Vessel UCONN during cruise 84-1. This system has a broad-band sound source operating from 300 Hz to 3 kHz (Poppe and others, 2002). Seismic signals were filtered and recorded using EPC 4100 and 4603 programmable graphic recorders.
Sidescan-sonar imagery collected by NOAA survey H11044 in west-central LIS were acquired aboard the NOAA Ship RUDE in extended Triton data format (XTF) using an Edgetech (EG&G) 272T sidescan-sonar tow fish. The tow fish emits two 50º-wide beams tilted down 20º from horizontal, sweeping about 100 m on either side of the ship track and transmitting at 100 kHz. The sidescan-sonar data were recorded digitally with a Triton Elics International ISIS data acquisition system. The sidescan-sonar data were multiplexed and filtered, corrected for slant-range, and mosaicked using the SonarWeb program at a 1-meter resolution, and reprojected into geographic coordinates. Light tones in the image indicate strong acoustic reflectivity and high backscatter; dark tones indicate weak acoustic reflectivity and low backscatter. Boundaries between interpreted areas of the mosaic are commonly gradational and contacts on the maps are inferred.
The sidescan-sonar imagery was verified using pre-existing bathymetric, photographic, and surficial sediment data (DiGiacomo-Cohen and others, 1998; Poppe and others, 1998c; Poppe and others, 2000b). Bathymetric contours were digitized from NOAA charts (mean lower low water datum). Photographic data were used to evaluate intra-station bottom variability, faunal communities, and sedimentary processes, as well as to observe rocky areas where samples could not be collected. Many of the 487 surficial sediment samples were collected with a modified Van Veen grab sampler.
Sediment descriptions use size grades of classification by Wentworth
(1922), the inclusive graphics statistical method of Folk (1974), and
nomenclature of Shepard (1954). Laboratory techniques are discussed in
detail in Poppe and others (2000b). Gravel-sized shells and other
biogenic carbonate debris were removed from the samples, as they may
form in situ and therefore are not considered representative of the
depositional environment. |
![]()