Woods Hole Science Center
![]() Title |
Introduction |
Setting |
Methods |
Overview |
Interpretation |
Discussion |
Data Catalog |
Acknowledgments |
References |
Figures |
Bottom Photographs |
Sediment Data |
Contacts
Title |
Introduction |
Setting |
Methods |
Overview |
Interpretation |
Discussion |
Data Catalog |
Acknowledgments |
References |
Figures |
Bottom Photographs |
Sediment Data |
Contacts
 |
||
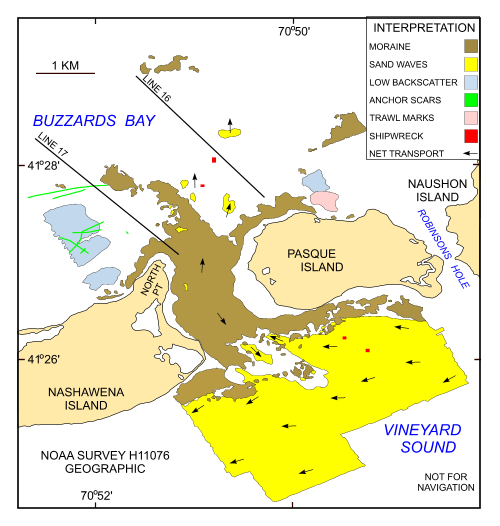
Figure 21. Interpretation of the DTM and sidescan sonar mosaic from NOAA survey H11076 of Quicks Hole. Shown are the areas characterized by moraine, sand waves, and low backscatter. Also shown are the net sediment transport directions deduced from sand-wave and scour mark asymmetry and the locations of anchor scars, shipwrecks, trawl marks, and seismic profiles shown in figure 5 and figure 6. | ||