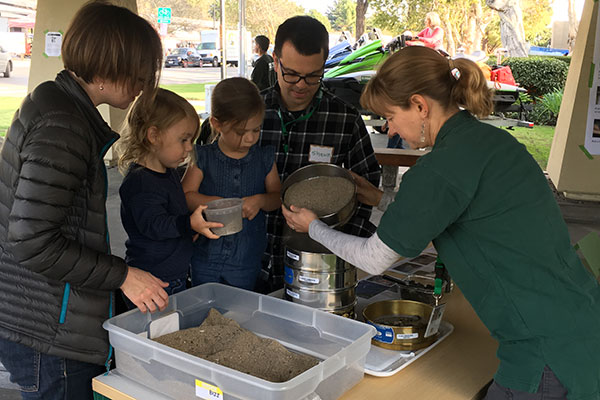
USGS geologist Amy East engages some visitors (with USGS scientists Shawn Harrison looking on) to demonstrate how sand samples are sieved to be sorted by grain size. Scientists use grain size information to learn about water flow and sediment movement in places such as a nearshore environment, where a river reaches the ocean.
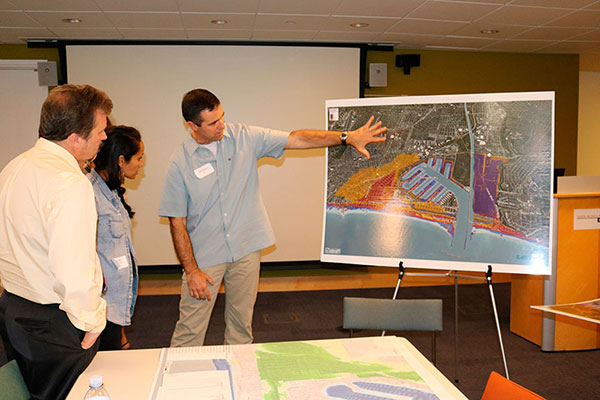
USGS scientists at the Pacific Coastal and Marine Science Center in Santa Cruz, California, spoke with an estimated 300 visitors during a December 9 open house. Adults and kids explored interactive exhibits, video and photo displays, posters, deep-sea rocks and minerals, and oceanographic equipment. Exhibits (and people) filled the lobby and entrance courtyard. “The public was excited to see what we do,” said Center Director Guy Gelfenbaum, “and many were engaged in interesting and meaningful conversations about the science.” Media coverage later that day included an article in the Santa Cruz Sentinel and a segment on KION TV’s late-night news. Contact: Rex Sanders, [email protected], 831-460-7555

A boiling black smoker emits hydrothermal fluids into seawater at Niua vent field in the Lau basin, southest Pacific. The "black smoke" is made of metal sulfide particles that precipitate as the fluids mix. Due to the high pressure at this seafloor vent, the fluids are boiling at 325°C. Photo credit: Schmidt Ocean Institute, ROV ROPOS [Larger version]
For the first time, scientists have found gold particles in boiling fluids from a hydrothermal vent. USGS scientist Amy Gartman and coauthors published their discovery in the journal Geology. Gold is one of the metals in hydrothermal vent deposits that may make mining them economical. The discovery of gold colloids�particles smaller than 1 micron (a human hair is about 60 microns in diameter) suspended in seawater�will advance understanding of how, and how fast, seafloor gold deposits form. Gartman and colleagues collected the colloids from hydrothermal fluids at Niua volcano in the South Pacific on a 2016 Schmidt Ocean Institute cruise. Gold colloids are widely used in biomedicine and technology and have long been hypothesized to exist in natural fluids. This study is the first to find them in hydrothermal fluids. Contact: Amy Gartman, [email protected], 831-460-7562
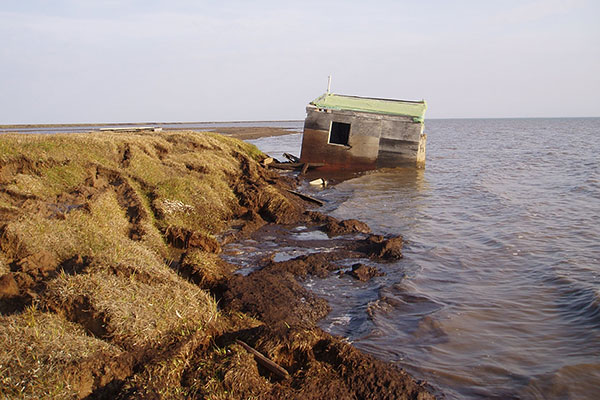
A cabin along Alaska's Arctic coast was recently washed into the ocean because the bluff it was sitting on eroded away. Photo by Benjamin Jones, USGS [Larger version]
USGS scientists at the Pacific Coastal and Marine Science Center spoke by phone with Scientific American writer Andrea Thompson on November 15. Thompson reported their findings in her article about coastal flooding and erosion caused by recent storms in Alaska. In years past, sea-ice formed by mid-November or earlier, limiting the severity of large storm waves impacting the coast. Thompson asked about USGS reports documenting increased rates of coastal change since the 1970s. USGS is researching the connection between changes in the timing of sea-ice formation and the rates and patterns of shoreline change. Limited data along the Alaska coast make it difficult to determine the extent to which climate change is responsible for the observed increase in erosion. The article was published November 30. Contact: Ann Gibbs, [email protected], 831-460-7540

The Elwha River overtopped its banks and cut through Olympic Hot Springs Road in Olympic National Park, Washington, on November 24, 2017. View a 360° panorama. Photo by Andy Ritchie, USGS.
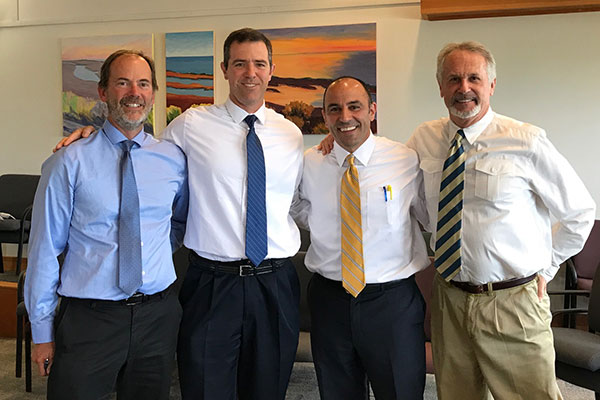
A team of federal scientists addressed comments from researchers who disagree with their conclusions that river channel evolution is driven primarily by physical factors rather than an overabundance of elk after wolf eradication. The team, led by USGS geologist Amy East, does not dismiss the influence of elk on river-bank vegetation, but contend that the weight of evidence indicates floods and other physical drivers have dominated the change in river channels during the last 70 years while biological drivers are secondary. The disagreement highlights the difficulties of determining the causes of ecological change in a complex world. Read the original paper and the reply. Contact: Amy East, [email protected], 831-460-7533, and Kurt Jenkins, [email protected], 360-565-3041

Open House at the Pacific Coastal and Marine Science Center [Larger version]
From 11 a.m. to 4 p.m. on Saturday, December 9, USGS scientists treated visitors to displays about their research at the Pacific Coastal and Marine Science Center in Santa Cruz, California. We had interactive exhibits, video and photo displays, posters, deep-sea rocks and minerals, oceanographic equipment, and colorful handouts. Our first open house in 13 years, visitors poured in to the courtyard and lobby at 2885 Mission Street to learn about our science as part of the “Holiday Bazaar at the Wrigley Building.” Contact: Rex Sanders, [email protected], 831-460-7555
Read about the Open House in the Santa Cruz Sentinel.
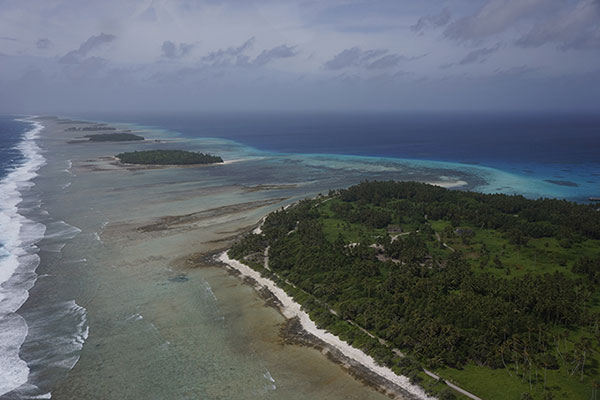
Aerial photograph of Kwajalein Atoll in the Republic of the Marshall Islands, showing its low-lying islands and coral reefs. The line of breaking waves on the left marks the reef crest, where much of the waves' energy is dissipated. Additional energy is lost through friction as the water flows shoreward over the rough surface of the healthy reef flat. Photo by Tom Reiss, USGS, May 2015. [Larger version]
At the request of the U.S. Department of Defense (DoD) Strategic Environmental Research and Development Program (SERDP), USGS geologist Curt Storlazzi chaired a session at a conference on issues affecting DoD installations. The Strategic Environmental Research and Development Program (SERDP) and Environmental Security Technology Certification Program (ESTCP) Symposium took place in Washington, D.C., November 28–30. Storlazzi chaired the session Pacific and Arctic Environments—Unique Importance and Challenges, opening it with an invited overview talk. The session highlighted SERDP projects working to better understand how environmental factors affect DoD built and natural resources, and how climate change is projected to impact operations, infrastructure, freshwater availability, and ecosystems. Storlazzi leads the USGS project Impact of Sea-Level Rise and Climate Change on Pacific Ocean Atolls that House Department of Defense Installations. Contact: Curt Storlazzi, [email protected], 831-460-7521
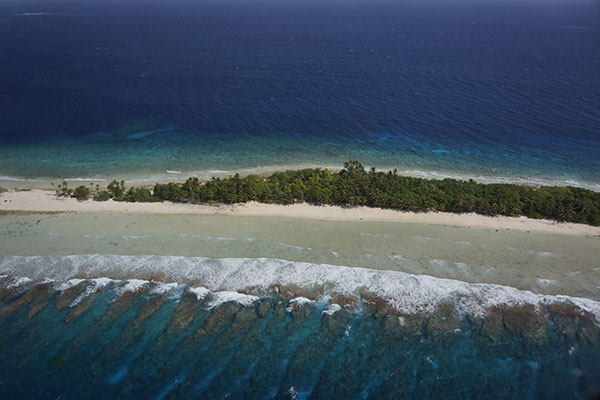
Aerial photograph of Kwajalein Atoll showing its low-lying islands and coral reefs. Photo by Tom Reiss, USGS, May 2015. [Larger version]
Scientists have developed a new model called “BEWARE” (Bayesian Estimator of Wave Attack in Reef Environments) for predicting short-term flooding that threatens property and public safety on coral reef-lined coasts. BEWARE also assesses longer term impacts of sea-level rise on coastal flooding. This new tool estimates how combinations of wave, water level, and reef types lead to flooding. It allows users to test “what-if” scenarios and ask questions such as, “How will flood risk change if the coral reef dies, or if sea level rises by more than 1 meter?” The model can be used to project societal and economic risk and damage. The Dutch research institute Deltares, the USGS, and Delft University of Technology developed BEWARE. Read about it in the Journal of Geophysical Research: Oceans and in a news release from Deltares. Contact: Curt Storlazzi, [email protected], 831-460-7521
Learn more about USGS work on low-lying areas of tropical Pacific islands.

Map of Alaska’s north coast showing color-coded rates of shoreline erosion, which can lead to loss of habitat, cultural features, and infrastructure. Modified from the original assessment published in 2015. Inset: Polar bear on Barter Island, Alaska in September 2016 by Cordell Johnson, USGS. [Larger version]
The USGS updated its shoreline-change rates for Alaska’s north coast between the U.S.-Canadian Border and Icy Cape as part of the National Assessment of Coastal Change Hazards. The previous assessment included data for two time periods, circa-1940s and circa-2000s. The update includes data from two additional time periods, circa-1980s and circa-2010s. The updated assessment confirms that Alaska’s north coast is dominantly erosional, with 84 percent showing shoreline retreat over the long term (1940s–2010s) and 77 percent over the short term (1980s–2010s). Average rates of change increased over the short term and are higher on the Beaufort Sea coast than the Chukchi Sea coast. Read details in USGS Open-File Report 2017-1107. View shoreline change rates along the north coast of Alaska, as well as other U.S. shorelines, in the USGS Coastal Change Hazards Portal. Contact: Ann Gibbs, [email protected], 831-460-7540
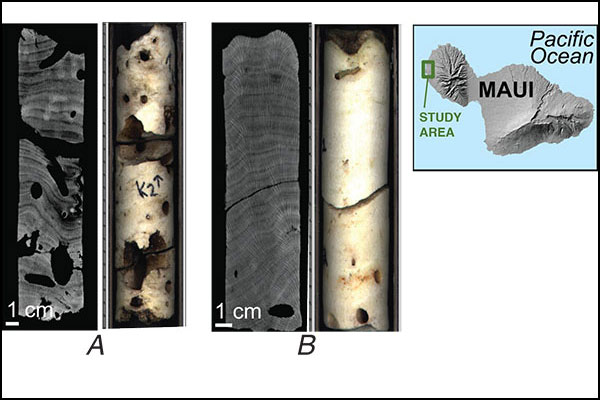
Coral collected from reef near polluted groundwater seeps (A) shows more erosion than coral collected away from seeps (B) in these CT scans (gray tones) and photographs. cm = centimeter
Coral reefs already stressed by ocean acidification are particularly vulnerable to polluted groundwater, according to a recent study by USGS geologist Nancy Prouty and colleagues. Rising atmospheric CO2 is causing a gradual decrease in ocean pH, making it more difficult for corals to grow calcium carbonate skeletons and enhancing rates of dissolution and bioerosion—the breakdown of coral by other organisms. The authors show that polluted groundwater discharging onto coral reefs off west Maui, Hawai‘i, further lowers seawater pH and exposes corals to nitrate concentrations 50 times higher than normal. Such land-based pollution could contribute to the collapse of coastal coral reef ecosystems sooner than predicted just on the basis of ocean acidification. The study was published in the American Geophysical Union (AGU) Journal of Geophysical Research: Oceans, featured on AGU’s GeoSpace blog, and reported by the Honolulu Star-Advertiser and the Associated Press. Contact: Nancy Prouty, [email protected], 831-460-7526

Two polar bears rummage around the eroding coastal bluffs of Barter Island in northern Alaska in July of 2016. The bears triggered a motion-activated camera that was pointed at the bluffs to monitor coastal change. Photo courtesy of Bruce Richmond, USGS. [Larger version]
USGS scientists Li Erikson and Ann Gibbs of the Pacific Coastal and Marine Science Center spoke by phone with producers from ABC News on November 2 about permafrost, coastal erosion, and changing sea-ice conditions at Barter Island on Alaska’s Arctic coast. Durrell Dawson and Doug Vollmayer were making an ABC News television documentary about polar bears and their habitat in Alaska and wanted to learn more about Arctic coastal change described on the USGS web site. The documentary aired in two parts on November 28. Part 1 includes an interview with polar bear researcher Todd Atwood from the USGS Alaska Science Center. Part 2 does not name the USGS but touches on Arctic coastal-change issues that USGS scientists study. Contact: Li Erikson, [email protected], 831-460-7563

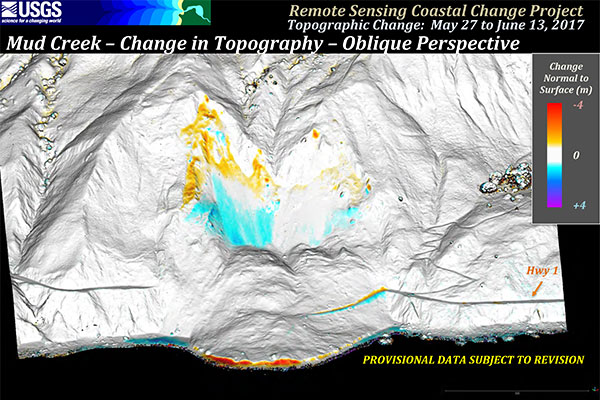
This animation alternates between two Mud Creek 3D images, one derived from a photo collected by airplane on June 13, 2017, and one derived from video footage collected by drone October 12, 2017 [Larger version]
USGS geologists Jon Warrick (Pacific Coastal and Marine Science Center) and Kevin Schmidt (Geology, Minerals, Energy, and Geophysics Science Center) are quoted in a November 9 Los Angeles Times story titled “Highway 1 was buried under a massive landslide. Months later, engineers battle Mother Nature to fix it.” The story takes readers to Mud Creek on California’s Big Sur coast, where millions of tons of rock and dirt slid toward the ocean last May. It details some of the steps that the California Department of Transportation (Caltrans) is taking to stabilize the slide and rebuild the road. Among the illustrations are 3D images of the landslide constructed by Warrick. He and Schmidt have been studying slides along the Big Sur coast and sharing their findings with Caltrans. Contact: Jon Warrick, [email protected], 831-460-7569
Learn more about the USGS project, Remote Sensing Coastal Change.
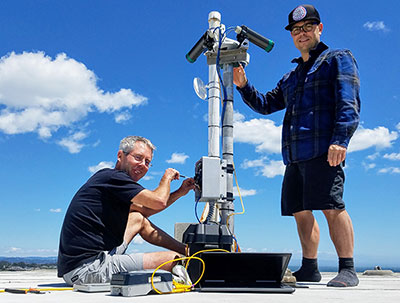
Gerry Hatcher (left) and Shawn Harrison work on their video camera station atop a hotel in Santa Cruz, California. Photo by Shawn Harrison, Pacific Coastal and Marine Science Center, USGS
Coastal communities count on beaches for recreation and for protection from large waves, but beaches are vulnerable to threats such as erosion by storms and flooding. Whether beaches grow, shrink, or even disappear depends in part on what happens just offshore. How do features like shifting sandbars affect waves, currents, and the movement of sand from the beach to offshore and back?
Read the USGS News Story.
View the local images from the Dream Inn in Santa Cruz.

Bathymetry of the Arctic Ocean, with black rectangle delineating study area. White star marks site where sample in photograph was collected. Its cut surfaces show layers in Fe-Mn crust. Each square in scale beneath sample is 1 centimeter (cm). Base map from International bathymetric chart of the Arctic Ocean (IBCAO). Photo by James Hein, USGS [Larger version]
Little is known about seafloor mineral deposits in the Arctic Ocean, an ocean dominated by shallow areas of continental shelf and deep basins with limited circulation. USGS scientists and colleagues published the first comprehensive paper on this subject, “Deep-water ferromanganese-oxide deposits reflect the unique characteristics of the Arctic Ocean,” in the American Geophysical Union (AGU) journal Geochemistry, Geophysics, Geosystems (G-cubed). They found that Arctic ferromanganese (Fe-Mn) deposits are highly enriched in the rare metal scandium, for which there is no land-based mine. Scandium is in great demand to amalgamate with aluminum to make light, fuel-efficient aircraft. Arctic Fe-Mn deposits have additional unique characteristics, reflecting the Arctic Ocean’s history. Growth-layer analyses show that over time Arctic Fe-Mn deposits are becoming more like those in other oceans. Contact: James Hein, [email protected], 831-460-7419

Patrick Barnard (center) and field trip participants above Pacifica State Beach (aka Linda Mar Beach), where future large storms combined with sea-level rise could flood parts of the highway and other infrastructure. [Larger version]
USGS geologist Patrick Barnard and communications officer Leslie Gordon led a coastal-erosion field trip on October 30 for journalists attending the 10th World Conference of Science Journalists in San Francisco, California. On San Francisco’s Ocean Beach, participants observed erosion that threatens the Great Highway and a $1.2 billion sewage treatment facility. In Pacifica, they saw beach-side infrastructure that could be flooded by future large storms combined with sea-level rise. Finally, they visited the Devil’s Slide promontory, where landslides closed California State Route 1 so often that it has been re-routed through tunnels. This is the most rapidly eroding segment of coast in the state, being heavily influenced by the management of sand resources in San Francisco Bay and the Sacramento-San Joaquin Delta. Contact: Patrick Barnard, [email protected], 831-460-7556, and Leslie Gordon, [email protected], 650-329-4006

3D map of Mud Creek slide derived from video footage collected by drone on October 12, 2017 [Larger version]
On October 12, USGS drones collected video footage of the Mud Creek landslide, which buried California State Highway 1 under a third-of-a-mile-wide mass of rock and dirt on May 20. USGS scientists have been monitoring the slide by transforming photos shot from an airplane into 3D maps. They applied the same software to the October 12 drone footage, producing detailed views of how the slide mass has changed. The scientists share their findings with the California Department of Transportation (Caltrans) to help that agency assess the slide and plan reconstruction of Highway 1. USGS will continue collecting drone footage of the Mud Creek landslide to supplement broader coverage provided by photos shot during airplane flights along the central California coast. View provisional imagery from the October drone flights. Contact: Jonathan Warrick, [email protected], 831-460-7569
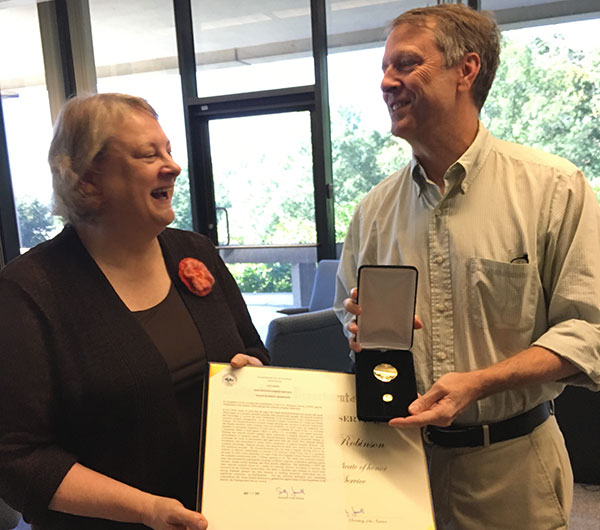
Susan Russell-Robinson receives the Department of the Interior’s Distinguished Service Award from USGS Acting Associate Director John Haines.
Former associate director of the USGS Coastal and Marine Geology Program Susan L. Russell-Robinson received the Department of the Interior’s Distinguished Service Award, the highest honorary award given to Department employees. Russell-Robinson, who retired from the USGS in July 2016 after 42 years of service, was celebrated for her great effectiveness as a scientist and a skilled, thoughtful manager. The Secretary of the Interior signed the award, and USGS Acting Associate Director John Haines presented it to Russell-Robinson on October 3. Haines lauded Russell-Robinson as an “unfailing force for good, exemplifying the guiding principles of the Survey and federal service.” Contact: John Haines, [email protected], 703-648-5464

Field trip participants beside the Carmel River at the former site of the San Clemente Dam. USGS geologist Amy East is seventh from right. Credit: Tommy Williams, NOAA [Larger version]
On October 14, 2017, geologist Amy East of the USGS and biologist Tommy Williams of NOAA’s National Marine Fisheries Service led a field trip to the Carmel River for graduate students from the University of California, Berkeley. Sixteen students enrolled in the course “Restoration of Rivers and Streams” spent the day learning about the Carmel River’s response to the removal of San Clemente Dam nearly two years ago. Demolition of the 32-meter (105-foot)-high dam, completed in November 2015, was the third-largest dam removal in the U.S. so far, and the first removal of a large dam in California. East and Williams showed the students the former dam site as well as evidence of change and recovery both up- and downstream, including increased spawning habitat for steelhead. Contact: Amy East, [email protected], 831-460-7533

Erosion threatens parking lots and the roadway beside San Francisco's Ocean Beach. Photo by Tami Heilemann, DOI.
[Larger version]
USGS geologist Patrick Barnard was interviewed for an article in the SF Weekly about public officials’ efforts to defend San Francisco coastlines against rising sea level. Barnard explains the importance of sand for maintaining beaches that act as buffers against storm waves. Practices like dredging and mining remove some of that sand from the natural system. Barnard leads a USGS project studying beach changes and flooding threats along the U.S. west coast. Read the article, published October 5. Contact: Patrick Barnard, [email protected], 831-460-7556
Mary McGann (left, USGS) and Rachel Lauer (University of Calgary) sample pore fluids from sediment cores collected aboard the Canadian Coast Guard Ship John P. Tully along the Queen Charlotte-Fairweather fault offshore of southeast Alaska. Photo by Jamie Conrad, USGS.
A multinational research cruise is investigating the Queen Charlotte-Fairweather fault offshore southeast Alaska and western Canada to understand hazards it poses to adjacent coastal communities. This fault, like the San Andreas fault to the south, separates the Pacific plate from the North American plate and has produced numerous large earthquakes. The expedition began September 12 and will conclude October 1. It is the latest in a series of research cruises investigating earthquake and tsunami hazards along the Queen Charlotte-Fairweather fault. Working aboard the Canadian Coast Guard Ship John P. Tully, USGS scientists and colleagues from Natural Resources Canada, University of Calgary, and the Sitka Sound Science Center are collecting samples of seafloor sediment, photographs and video of the seafloor, and sonar images of sediment layers below the seafloor. Contact: Jamie Conrad, [email protected], or Danny Brothers, [email protected]
Learn more about USGS earthquake hazards studies in southeastern Alaska.
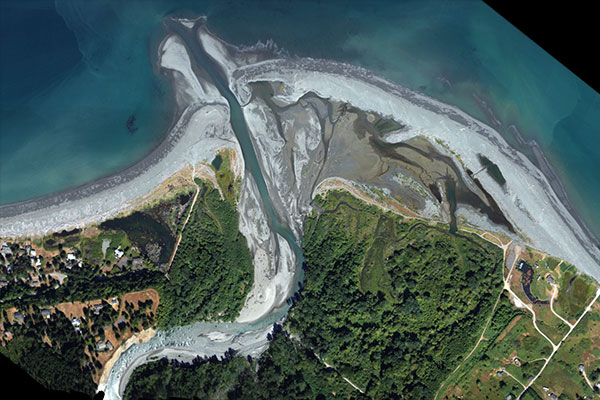
Snippet of an orthophoto of the mouth of the Elwha River, Washington State, USA, compiled from hundreds of images taken July 25, 2017. The images were collected with two Ricoh GR cameras operating at 2-second intervals, mounted on opposite wings of a Cessna 172 piloted by Rite Bros. Aviation. The images were processed using Structure-from-Motion techniques. View full-size imagery.
USGS geologist Andy Ritchie is featured in a High Country News article about recovery of Washington’s Elwha River after removal of two large dams. Ritchie guided the article’s author through the upper dam site and the Elwha’s mouth on the coast, pointing out how the freed river is sculpting new channels and building up beaches. Ritchie worked for the National Park Service at the time of the interview, monitoring the river’s response to dam removal and developing a novel airplane-mounted camera system to collect low-cost repeat aerial imagery. Now with USGS, he continues studying the Elwha as part of the multiagency Elwha River Restoration project. The article, which also quotes USGS wildlife researcher Rebecca McCaffery, is the cover story of High Country News’ September 4 issue. Contact: Andy Ritchie, [email protected], 831-460-7454
Learn more on the web site "USGS Science to Support the Elwha River Restoration Project"
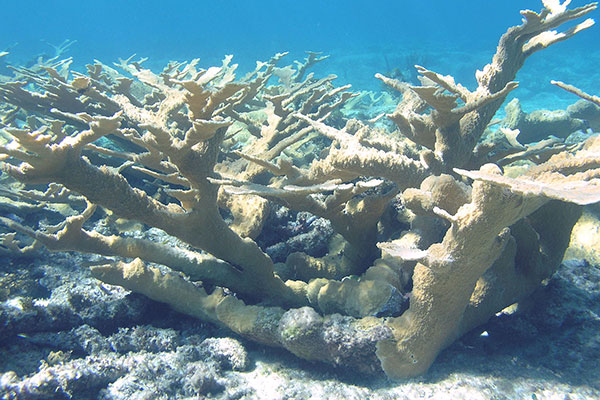
Healthy elkhorn coral (Acropora palmata) like this provides the critical ecosystem service of building the reef crest that protects shorelines during storms.
USGS geologist Curt Storlazzi spoke to Chelsea Harvey of the Washington Post on September 7 about the role of coral reefs in protecting coastlines from storms like Hurricane Irma. Storlazzi confirmed that recent deterioration of coral reefs would likely result in greater flooding. Healthy coral reefs protect coasts by dissipating wave energy some distance from the shoreline. Storlazzi shared information from two papers he co-authored: “The effectiveness of coral reefs for coastal hazard risk reduction and adaptation” (Nature Communications, 2014) and “The influence of coral reefs and climate change on wave-driven flooding of tropical coastlines” (Geophysical Research Letters, 2015). He leads the USGS Coral Reef Project. Harvey’s article, “Scientists say damage to Florida’s coral reef has made the state more vulnerable to storm surges,” was published September 12. Contact: Curt Storlazzi, [email protected], 831-460-7521
USGS has posted animations of a tsunami generated by the magnitude 8.1 earthquake that struck offshore of the Mexican state of Chiapas at 4:49 a.m. UTC on September 8 (11:49 p.m. September 7 local time). USGS geophysicist Eric Geist created the animations using data about the earthquake rupture. The highest wave measured 1.76 meters (5.8 feet) at Puerto Chiapas. In part because the earthquake was relatively deep—the initial break occurred beneath the large fault along which the Cocos oceanic plate is diving under the North American plate—not much vertical movement was transferred up to the seafloor and from there to the overlying water. Hence the tsunami was mild, a lucky thing for coastal communities already coping with deadly shaking. A second large (magnitude 7.1) earthquake on September 19 occurred 123 kilometers (76 miles) southeast of Mexico City, where shaking caused severe damage and many deaths. The second earthquake occurred on land and did not produce a tsunami.
Contact: Eric Geist, [email protected], 650-329-5457
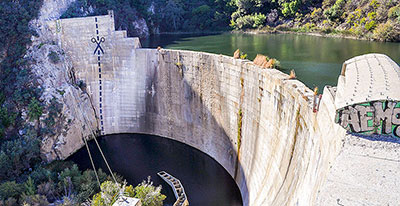
Photograph of the Matilija Dam by Jeremy P. Jacobs, E&E News. Anti-dam activists painted the scissors and dashes.
E&E News quoted USGS geologist Jonathan Warrick in an August 23 article on trapping of sediment by the Matilija Dam in Southern California. The obsolete dam has trapped about 8 million cubic yards of sediment, leading to the need for imported sand to maintain a popular beach at the mouth of the Ventura River. Warrick, who studies the effects of dam removals on coastal sediment, noted that most U.S. coasts are eroding and reduced sediment input exacerbates the problem. The article, “How a useless dam nearly destroyed an iconic beach,” recounts the history of the Matilija Dam and describes efforts to address the difficulties entailed in removing it. Contact: Jon Warrick, [email protected], 831-460-7569
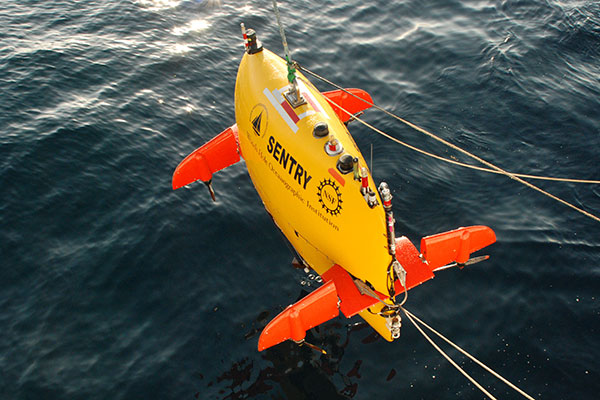
Expedition scientists are running surveys with the Woods Hole Oceanographic Institution (WHOI) autonomous underwater vehicle (AUV) Sentry, being deployed here on September 13. Image courtesy of DEEP SEARCH 2017, NOAA-OER/BOEM/USGS.
Scientists departed from Norfolk, Virginia, on September 12 to begin a three-week research cruise investigating deep-sea corals, canyons, and gas seeps off the Southeast U.S. The expedition is part of a multiyear study in which the USGS, the Bureau of Ocean Energy Management (BOEM), and NOAA are collaborating. Traveling aboard the NOAA Ship Pisces, researchers led by USGS ecologist Amanda Demopoulos will explore geological processes and biological features—such as corals, naturally occurring gas seeps, and the organisms that inhabit them—in deepwater habitats offshore North Carolina, South Carolina, and Georgia. USGS scientists representing various disciplines are working with researchers from Temple University, the University of Georgia, Nova Southeastern University, Florida State University, Harvey Mudd College, the University of New Hampshire, and the Royal Netherlands Institute of Sea Research (NIOZ). Learn more at USGS DISCOVRE. Follow the expedition at DEEP SEARCH. Contact: Amanda Demopoulos, [email protected], or Nancy Prouty, [email protected], 831-460-7526

Time-lapse photographs from the Elwha River Restoration Project show the removal of the Elwha Dam from August, 2011 through September, 2012. Watch a larger version of this time-lapse, 25.5 MB
The rate of dam removal in the U.S. has increased over past decades, motivating a working group at the USGS John Wesley Powell Center for Analysis and Synthesis to review available dam-removal studies. The synthesis of their findings, “Dam removal: Listening in,” appeared July 31 in the American Geophysical Union (AGU) journal Water Resources Research. Contributors include ecologists, geologists, hydrologists, biologists, engineers, and geomorphologists from various federal agencies, universities, and a nonprofit organization. Among the findings is that physical responses, like sediment release, are typically rapid, whereas ecosystem responses vary with location along the river. On August 25, a reporter from Water Deeply interviewed first author Melissa Foley (former USGS research ecologist now with Auckland Council in New Zealand), coauthor and USGS research geologist Amy East, and two colleagues from the U.S. Forest Service. Contacts: Melissa Foley, [email protected], +64 21 080 65553; and Amy East, [email protected], 831-460-7533
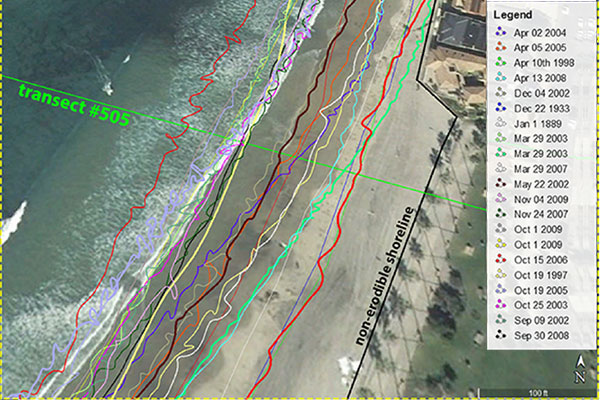
An example of the shoreline data, pictured above for La Jolla Shores, used in the CoSMoS-COAST model.
The New York Times featured research by USGS geologist Patrick Barnard in its August 17 “California Today” section. The story “A Growing Threat on the Shoreline” referred to a report co-authored by Barnard forecasting that up to two-thirds of Southern California’s beaches could be lost by 2100. Barnard said that variables contributing to beach loss include rising seas and intensified storms, both linked to climate change, as well as river dams blocking the flow of sand to beaches. The story described recent damage caused by erosion along California’s coast and noted that Barnard believes such problems are likely to become more frequent. Barnard leads development of the USGS Coastal Storm Modeling System (CoSMoS), which provides detailed forecasts of coastal flooding due to storms of various intensities over a range of future sea levels. Contact: Patrick Barnard, [email protected], 831-460-7556
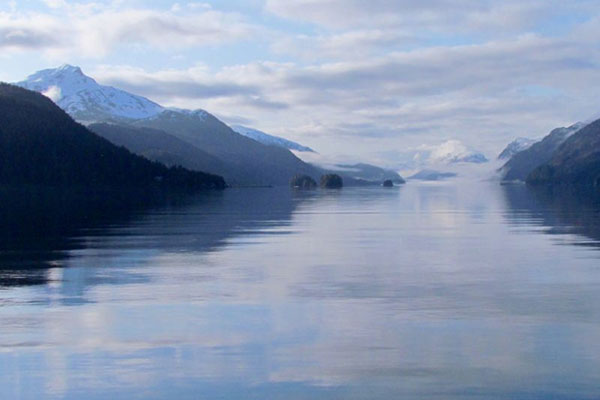
All is calm in southern Alaska’s Lisianski Inlet in this 2015 view from the deck of research vessel Solstice. A systematic survey of the nearby Queen Charlotte–Fairweather Fault, the source of several major earthquakes, has produced valuable information on the fault’s structure and slip mechanisms. Credit: Daniel S. Brothers
A new article by USGS scientists offers a striking portrait of movement along a 500-kilometer-long undersea section of the Queen Charlotte–Fairweather fault off the coast of southeast Alaska. This fault, like its southern counterpart the San Andreas, forms a boundary where the Pacific and North American plates slide past one another. In the past century, movement on the fault has generated at least seven earthquakes of magnitude 7 or greater. Before USGS began offshore surveys in 2015, little was known about the undersea portion of this fault and the earthquake and tsunami hazards it poses to residents and tourists in southeast Alaska and western British Columbia. The new article in Eos highlights major findings of five geophysical surveys conducted since 2015 and offers spectacular seafloor views of the Queen Charlotte-Fairweather fault. Contact: Danny Brothers, [email protected], 831-460-7460
Screenshots of tsunami approaching the shore from video produced by Physics World.
USGS geophysicists are featured in two videos published by Physics World, magazine of the Institute of Physics. In the first video, Eric Geist explains his studies of the mechanics of tsunamis, particularly those triggered by earthquakes occurring at subduction zones on the seafloor, where oceanic plates slide underneath continental plates. (See Geist’s animations of historical tsunamis.) A second, companion video covers the work of Brian Kilgore, who triggers mini-earthquakes in a USGS lab to study their characteristics, and David Lockner, who works in a rock deformation and friction lab to recreate conditions in the Earth under which earthquakes occur. Journalist James Dacey filmed the interviews a year and a half ago at the USGS center in Menlo Park, California. The videos and accompanying article were published in July 2017 on physicsworld.com. Contact: Eric Geist, [email protected], 650-329-5457

Instrument package mounted to the seaward slope of a coral reef off southwestern Puerto Rico. [Larger version]
An instrument package developed by the USGS was placed on the seaward slope of a coral reef off southwestern Puerto Rico on July 27. Collaborators from the University of Puerto Rico-Mayaguez deployed the instrument package at a depth of 177 feet—the deepest deployment yet of instruments to measure currents and suspended sediment in a coral reef environment. The researchers want to measure how much volcanic sediment (derived from land) and carbonate sediment (derived from the reef) are moving off the reef. They are also exploring how deep currents move cool, nutrient-rich water up the slope. This water can offset stress caused by global warming of surface waters and provide food for stressed corals. USGS scientist Cordell Johnson designed and built the instrument mount for delicate emplacement by technical divers. Contact: Curt Storlazzi, [email protected], 831-460-7521
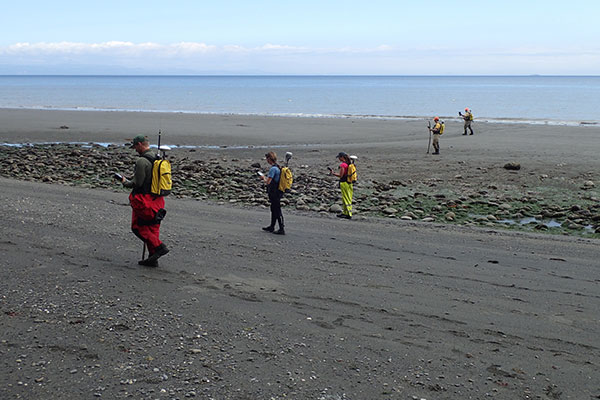
Left to right: In July 2017, Tim Elfers (USGS), Hannah Drummond (WA State Dept. of Ecology), Heather Weiner (WA State Dept. of Ecology), Andrew Stevens (USGS), and Andy Ritchie (USGS) used handheld computers and backpack-mounted GPS equipment to record beach topography along the beach near the mouth of the Elwha River.
USGS has published data documenting coastal changes caused by the removal of two large dams from the Elwha River in northern Washington. The largest dam removal in U.S. history, begun in 2011 and completed in 2014, released massive amounts of sediment from the former reservoirs. USGS scientists regularly survey the beach and seafloor near the river mouth to document the effects of this sediment as it reaches the coast. The published datasets cover surveys conducted in 2010 and twice yearly thereafter through July 2016; new surveys will be added as data are processed. During the most recent survey, in July 2017, the scientists saw an explosion of vegetation colonizing newly created land. This work is part of multiagency studies to support restoration of the Elwha River system. Contact: Andrew Stevens, [email protected], 831-460-7424, or Jon Warrick, [email protected], 831-460-7569
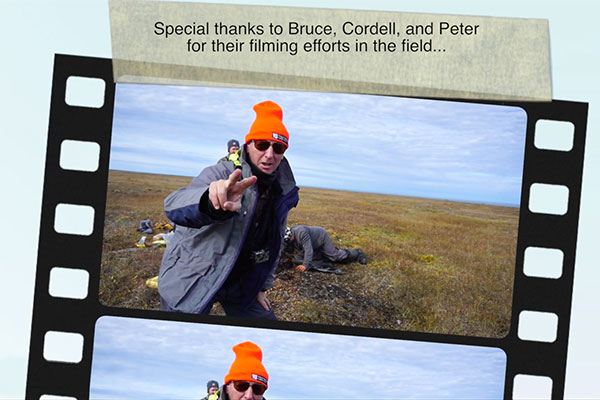
Bruce Richmond clowns for the camera during the closing credits of Peeking into Permafrost. In the background are Cordell Johnson (left) and Peter Swarzenski (on the ground).
The USGS video Peeking into Permafrost has been selected for this year’s Goldschmidt Wild Orbit Cinema week in Paris, August 12–18. Produced by USGS contractor Amy West, the film is one of 15 chosen from nearly 100 entries. It follows a USGS team led by geologist Bruce Richmond as they investigate bluff erosion on Barter Island on Alaska’s Arctic coast. The video conveys the challenging conditions under which the scientists collect samples of permafrost and a range of data—from repeat photographs of the shore, to radon content in groundwater, to the composition and structure of the bluffs—to examine what’s controlling erosion of Arctic coasts. Such erosion threatens villages and infrastructure in many parts of northern Alaska. The annual film festival is a “week long celebration of the very best in science communication” held in conjunction with the prestigious Goldschmidt geochemistry conference. View all 15 films. Contact: Bruce Richmond, [email protected], 831-460-7531, or Amy West, [email protected], 831-460-7428

The USGS team mapped the underwater part of the Mud Creek landslide and the surrounding seafloor on July 11 and are currently processing data. Here�s a view of the slide from the research vessel Snavely. [Larger version]
Scientists from the USGS Pacific Coastal and Marine Science Center mapped the offshore extent of the Mud Creek landslide on California’s Big Sur coast on July 11, 2017. They used sonar to measure bathymetry (seafloor depth) along a series of overlapping swaths to produce a map of the underwater slide debris and surrounding seafloor. The mapping is part of an effort to understand what happens to landslide material after it enters the ocean. The team has been collecting and analyzing air photos of the Mud Creek area before and after the May 20 landslide to monitor changes in ground elevation. See provisional imagery at the Remote Sensing Coastal Change website. Contact: Jon Warrick, [email protected], 831-460-7569
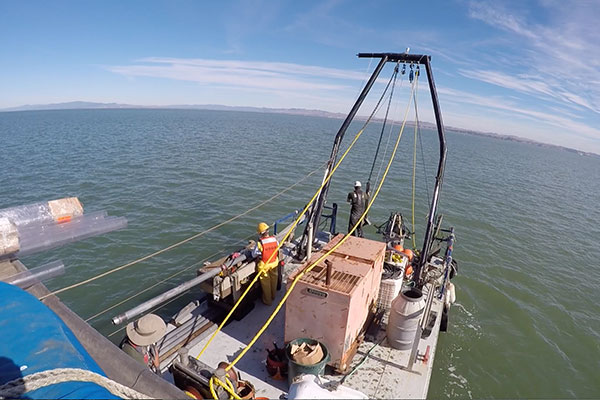
USGS scientists collecting cores of bayfloor sediment from San Pablo Bay to study the history of movement along the link between the Hayward and Rodgers Creek faults.
USGS research geophysicist Janet Watt spoke with reporters Jenna Lane (KCBS Radio, San Francisco) on July 5 and Tom Vacar (KTVU Channel 2, San Francisco) on July 6 about her research on a connection between the Hayward and Rodgers Creek faults beneath San Pablo Bay, an arm of California’s San Francisco Bay. Watt is currently analyzing samples of bay sediment to better understand how these faults have interacted in the past—information that will improve forecasts and help communities prepare for future earthquakes. The interviews were prompted by a July 2 article in the San Jose Mercury News. The KCBS interview aired the morning of July 6, and the KTVU interview was broadcast that evening. Contact: Janet Watt, [email protected], 831-460-7565

USGS scientist Josh Logan points to the high-water mark—the upper limit of damage to tree bark by water-borne debris—from a series of large floods on the Carmel River in January and February 2017. He is standing in a USGS study area downstream from the old San Clemente Dam site. Photo by Amy East, USGS, April 11, 2017 [Larger version]
USGS research geologist Amy East was quoted in a July 7 San Jose Mercury News article titled “With San Clemente Dam gone, are steelhead trout about to make comeback on the Carmel River?” East noted that last winter’s heavy rains produced more floods and larger floods than the river had undergone in many years. These floods, combined with the 2014–15 dam removal, changed the river in ways that make it more hospitable to steelhead, which are listed as threatened under the Endangered Species Act. East leads a USGS team that has been measuring the river’s topography and the sediment it carries since 2013. Their work supports NOAA and California State University Monterey Bay investigations of physical and ecological changes in the watershed resulting from dam removal. Contact: Amy East, [email protected], 831-460-7533
The Mud Creek landslide on California’s Big Sur coast keeps eroding, as seen in air photos taken June 26. USGS scientists have been collecting and analyzing air photos about every two weeks, weather permitting, since the slide occurred on May 20. Maps derived from the June 26 photos show continued movement on the slide’s upper slopes and accelerating erosion at its toe. Since May 27, the 13-acre bulge of new land created by the slide has lost about 2 acres to wave erosion at its seaward edge, while material has accumulated on the beaches beside it. The latest photos also captured new roads built by the California Department of Transportation (Caltrans) to monitor and sample the slide. View provisional imagery at the USGS Remote Sensing Coastal Change website. Contact: Jon Warrick, [email protected], 831-460-7569

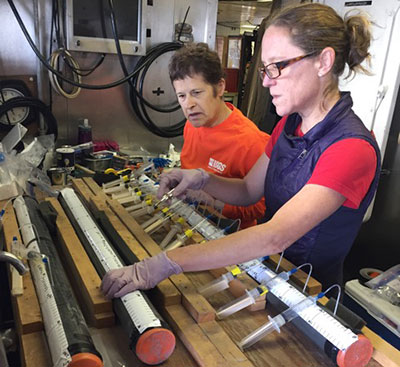
USGS scientists Mary McGann (left) and Janet Watt opening a core of muddy sediment from San Pablo Bay. [Larger version]
A front-page article in the San Jose Mercury News features USGS geophysicist Janet Watt explaining her study of mud collected from beneath the bottom of San Pablo Bay, California. Watt led a team whose October 2014 imaging of sediment layers beneath the bay revealed a direct link between two hazardous faults in the San Francisco Bay area—the Hayward and Rodgers Creek faults. In October 2016, the scientists collected core samples of muddy sediment along the newly discovered fault segment. They are analyzing the cores to ascertain the ages of sediment layers disrupted by fault movement. Determining when the fault has moved could improve assessments of the area’s earthquake hazards. Reporter Lisa Krieger learned of the study from Watt’s May 25 USGS public lecture. Read the article, published online July 2. Contact: Janet Watt, [email protected], 831-460-7565

Metal-containing sulfur compounds are formed by black smokers, hot volcanic springs in the deep sea, like this one at Niua Volcano, about 250 miles southwest of American Samoa in the South Pacific. Credit: Schmidt Ocean Institute/Canadian Scientific Submersible Facility. [Larger version]
USGS research geologist James Hein was interviewed in late May by two reporters interested in deep-ocean mineral resources. Carol Clouse, freelance reporter for The Guardian U.S., spoke to Hein about deep-ocean mineral deposits and deep-ocean mining. Her article was published June 28. Dagmar Roehrlich, science writer for German Public Radio Station Deutschlandfunk, recorded an interview with Hein about ferromanganese crust and nodule resources, with a focus on the Arctic Ocean. Roehrlich’s piece was broadcast and an article published on May 22. (Read a translation of the article.) Contact: Jim Hein, [email protected], 831-460-7419

During early stages of the dam removal project on the Elwha River, hundreds of thousands of tons of sediment (mostly silts and sands), trapped for decades behind the dams, were released causing turbidity in the river and coastal waters. Photograph taken April 14, 2012, by Jon Felis, USGS [Larger version]
USGS research geologist Jon Warrick was quoted in an article about the importance of river-borne sediment for helping coastal-wetland growth keep pace with sea-level rise. Titled “Why the World’s Rivers Are Losing Sediment and Why It Matters,” the article was published June 20 in Yale Environment 360, an online magazine covering global environmental issues. Warrick leads a USGS project studying how the removal of two large dams from the Elwha River in Washington State is changing the region’s coastal areas. He described the expansion of coastal landforms by sediment released during and after dam removal, and he noted that the best way to free sediment trapped behind a dam depends on the dam’s purpose and the unique nature of the river. Contact: Jon Warrick, [email protected], 831-460-7569

Tsunami generated by Japan's 2011 Tohoku earthquake makes its way through San Francisco Bay. Photo taken 9:38 a.m. PST, March 11, 2011, in Emeryville, California, by Dr_Speed at Flickr. [Larger version]
USGS research geophysicist Eric Geist spoke to Olivia Allen-Price of KQED Radio (San Francisco) for a podcast addressing the question: “If a tsunami were to hit the Golden Gate, what would be its real effect on communities facing the San Francisco Bay?” Geist described the impacts of tsunamis generated by large, distant earthquakes as they hit California’s Pacific coast and enter San Francisco Bay, where strong currents could damage piers and vessels. Steven Ward, professor at University of California, Santa Cruz, shared a computer simulation showing how a tsunami wave would fan out after coming through the Golden Gate, flooding low-lying areas in San Francisco and dissipating as it moved farther into the bay. Listen to the podcast, part of the Bay Curious series. Contact: Eric Geist, [email protected], 650-329-5457
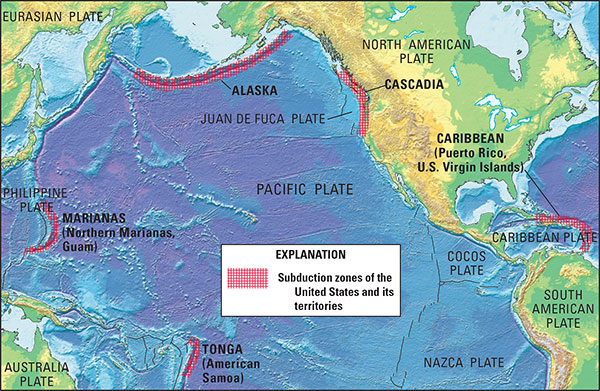
Most of the world’s earthquakes, tsunamis, landslides, and volcanic eruptions are caused by the continuous motions of tectonic plates that make up the Earth’s outer shell. The most powerful of these natural hazards occur in subduction zones, where two plates collide and one is thrust over another. The U.S. Geological Survey’s “Reducing Risk Where Tectonic Plates Collide—A USGS Plan to Advance Subduction Zone Science” is a blueprint for building the crucial scientific foundation needed to inform the policies and practices that can make our Nation more resilient to subduction zone-related hazards. Read a USGS Fact Sheet summarizing the plan, or read the full report. Contact: Joan Gomberg, [email protected], 206-616-5581
Read the June 21, 2017 USGS Featured Story, “USGS publishes a new blueprint that can help make subduction zone areas more resilient.”
USGS analysis of air photos collected June 13 shows that new land created by a May 20 landslide on California’s Big Sur coast is eroding. The large slide buried State Highway 1 beneath more than 65 feet of rock and dirt, and created about 13 acres of new land bulging into the ocean. Between May 27 and June 13, the seaward edge of the landslide retreated about 16 feet. USGS scientists collect air photos of the slide area weekly to biweekly as weather permits. They use “structure-from-motion” software to turn the photos into 3D maps from which they measure changes in ground elevation. View provisional imagery at the USGS Remote Sensing Coastal Change website. Contact: Jon Warrick, [email protected], 831-460-7569

A mosque is left standing amid the rubble in Banda Aceh, following the tsunami on December 26, 2004. Several mosques survived and may have been saved by the open ground floor that is part of their design. The tsunami waves reached the middle of the second floor. Photograph by Guy Gelfenbaum, USGS, taken January 21, 2005. [Larger version]
USGS research geophysicist Eric Geist is the lead scientific editor of a compilation of 25 papers on tsunamis, published by Springer as a special issue of Pure and Applied Geophysics (December 2016) and as a book (April 2017). Tsunami science has expanded significantly since the 26 December 2004 Sumatra tsunami killed approximately 230,000 people along the coasts of 14 countries in the Indian Ocean, and the 11 March 2011 Tohoku (Great East Japan) tsunami killed almost 20,000 people and destroyed the Fukushima Daiichi nuclear power plant. The book, which is volume 1 of the journal’s topical issue “Global Tsunami Science: Past and Future,” highlights tsunami research by scientists around the world. The papers cover tsunami hazard and risk assessment, new methods for tsunami warning and detection, new methods for modeling tsunami hydrodynamics, and the generation of tsunamis by landslides and meteorological disturbances. Contact: Eric Geist, [email protected], 650-329-5457
(Left to right) Charles Lester, Patrick Barnard, Congressman Jimmy Panetta, and Gary Griggs discussed sea-level-rise impacts in a roundtable organized by Congressman Panetta.
Patrick Barnard, coastal geologist with the USGS Pacific Coastal and Marine Science Center, joined University of California-Santa Cruz professor Gary Griggs, UCSC researcher and former executive director of the California Coastal Commission Charles Lester, and Congressman Jimmy Panetta (CA-20) for a roundtable discussion of sea-level rise impacts. Barnard leads the USGS Climate Change Impacts to U.S. Pacific and Arctic Coasts project. He explained how accelerated sea-level rise is likely to affect communities on California’s coast. Panetta, whose district includes the coasts of Monterey and Santa Cruz counties, organized the roundtable to discuss the causes of sea-level rise, issues associated with sea-level rise, and ways to address the problem in his district and nationwide. The roundtable took place at Moss Landing Marine Laboratories on June 1. Contact: Patrick Barnard, [email protected], 831-460-7556
Big Sur Landslide fly around from May 27, 2017, a preliminary computer animation. The slide created roughly 13 acres of new California land. [Larger version]
USGS geologists Jon Warrick (Pacific Coastal and Marine Science Center) and Kevin Schmidt (Geology, Minerals, Energy, and Geophysics Science Center) were interviewed by Lisa Krieger of the San Jose Mercury News on May 31 about a huge landslide that occurred May 20 on California’s Big Sur coast about 140 miles south of San Francisco. Warrick has been collecting and analyzing air photos to precisely measure changes in ground elevation along the shoreline, including the slide site. Schmidt has been mapping landslides in other stretches of the rugged Big Sur coast. The scientists are sharing information with California Department of Transportation (Caltrans) engineers assessing and monitoring the slide. The San Jose Mercury News article has spurred additional coverage, including stories by (so far) the Associated Press, the Los Angeles Times, and the U.K. Daily Mail, plus June 1 interviews by the San Francisco Chronicle and Southern California Public Radio (KPCC). Additionally, Facebook and Twitter posts have garnered attention, including a retweet by Secretary of the Interior Ryan Zinke. Contact: Jon Warrick, [email protected], 831-460-7569
View more media links and imagery on the USGS Remote Sensing Coastal Change website.

USGS "after" image at Big Sur landslide. Watch an animation of USGS computer-generated "before" and "after" images at Big Sur landslide.
USGS scientists analyzing before-and-after air photos have calculated the size of the May 20 landslide on California’s Big Sur coast, about 140 miles south of San Francisco. They are sharing their information with California Department of Transportation (Caltrans) engineers assessing the slide. Preliminary calculations indicate that the landslide moved approximately 2 million cubic meters of material, enough to fill 800 Olympic-sized swimming pools. It buried State Highway 1 more than 20 meters (65 feet) deep and added more than 50,000 square meters (about 13 acres) of new land to the coast. USGS scientists shot air photos of the Big Sur coast in March and May 2017. Using “structure-from-motion” software, they transformed these and earlier photos into 3D maps that allow them to precisely measure areas and changes in ground elevation. They plan to keep monitoring the slide area via weekly airplane flights and, starting in June, drone flights. For additional information and images, please visit the USGS Remote Sensing Coastal Change website, or contact Jon Warrick, [email protected], 831-460-7569.

USGS "before" image at Big Sur landslide area. USGS will shoot "after" images when weather is favorable. [Watch an animation of "before" images]
USGS is collecting and analyzing air photos to help monitor a huge landslide that occurred May 20 on California’s Big Sur coast. A quarter-mile-wide lobe of rock and soil has buried State Highway 1 and extends into the Pacific Oceanat Mud Creek, about 140 miles south of San Francisco. The USGS Coastal and Marine Geology Program’s Remote-Sensing Coastal Change project captured several photo sets during the recent slide activity and plans to shoot additional photos from airplane and drones during the coming weeks and months. Project scientists photograph the California coastline regularly and use “structure-from-motion” software to transform photos into 3D maps from which they can measure ground movement. They have flown and photographed the Big Sur coast several times this spring to track landslide activity in collaboration with geologists from the USGS Landslide Hazards Program. For additional information and images, please visit the USGS Remote Sensing Coastal Change website, or contact: Jon Warrick, [email protected], 831-460-7569.
USGS research geophysicist Janet Watt gave a public lecture at the USGS in Menlo Park, California, on May 25, 2017.
USGS research geophysicist Janet Watt presented a public lecture, “Underwater Secrets of the Hayward Fault Zone: Integrated 3D imaging to understand earthquake hazards,” at the USGS in Menlo Park, California, on May 25. Watt led a team whose imaging of sediment layers beneath San Pablo Bay revealed a direct link between two of the most urbanized and hazardous strike-slip faults in the San Francisco Bay area. Longer fault ruptures produce larger earthquakes, so understanding how fault segments connect is critical to assessing earthquake hazards. Watt’s lecture showed how underwater imaging provides a unique method to study urban faults. She explained how scientists link surface features to depths where earthquakes begin, and how imaging of sub-seafloor sediment— “acoustic trenching”—helps scientists decipher earthquake history. View an archived video of the lecture. Contact: Janet Watt, [email protected], 831-460-7565

Wave-driven flooding and overwash on Roi-Namur Atoll, Republic of the Marshall Islands. Photo credit: Peter Swarzenski, USGS. [Larger version]
Coastal flood frequency will increase dramatically in coming decades, even with small amounts of sea-level rise, according to a new study in Scientific Reports. Scientists at USGS, University of Illinois, and University of Hawai‘i show that just 10 to 20 centimeters of sea-level rise, expected between 2030 and 2050, will more than double coastal flooding frequency along most coastlines around the globe. Tropical regions will be hit hardest, threatening the livability of low-lying Pacific islands and the economies of coastal cities. North America’s west coast and Europe’s Atlantic coast will also undergo increases in flood frequency. The authors combined sea-level projections with wave, tide, and storm-surge models to estimate global increases in coastal flooding. This study is the first to include waves in an analysis of global future flooding. It highlights an important consequence of global climate change. Contact: Patrick Barnard, [email protected], 831-460-7556
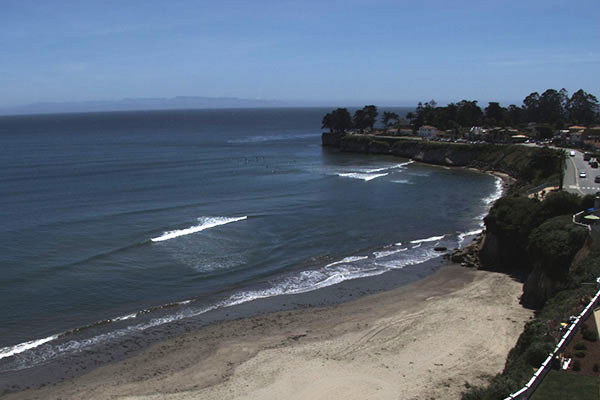
Recent snapshot from USGS Camera 2, which looks southward over Cowells Beach in Santa Cruz, California.
Sea-level rise and climate change could shrink beaches, which are valued for recreation and protection against storm waves. To learn more about processes affecting beaches, Shawn Harrison and Gerry Hatcher of the USGS Pacific Coastal and Marine Science Center installed two video cameras atop a Santa Cruz, California, hotel overlooking northern Monterey Bay. Every half hour, the cameras shoot video of the beach and ocean for 10 minutes. Using specialized software, Harrison extracts data about shoreline position, sandbar migration, rip-channel formation, wave run-up on the beach, alongshore current, nearshore bathymetry, and more. The information will improve simulations of shoreline change that communities can use to plan for the future. Two image types, updated every half hour, are posted online: a snapshot (first video frame), a time-averaged image (made by combining 1,200 frames), a variance image (shows the standard deviation of pixel intensity throughout the video), and a bright and a dark image (showing the brightest and the darkest pixel values throughout the video, respectively). Eventually, USGS will install similar systems in more remote locations. Contact: Shawn Harrison, [email protected], 831-460-7549

Predicted shorelines on five beaches in 2100 with 1.0 meter (3 feet) of sea-level rise. Figure 3 from the new paper.
That’s the question posed by Sean Vitousek (former USGS postdoc now with University of Illinois at Chicago) and USGS colleagues Patrick Barnard and Pat Limber in a paper the American Geophysical Union (AGU) invited them to contribute to its Earth Day Special Collection of Commentaries published in late April 2017. The authors note that sea-level rise driven by climate change is causing increased coastal flooding, beach erosion, cliff failure, and other problems around the world. Accelerated sea-level rise could threaten the very existence of natural beaches. They call for improved computer simulations of natural systems to provide the long-term predictions that planners need to develop adaptation strategies and enhance coastal resilience. The scientists’ recent modeling effort showed that by 2100 up to 67 percent of Southern California beaches could completely disappear without large-scale human intervention. Contact: Patrick Barnard, [email protected], 831-460-7556
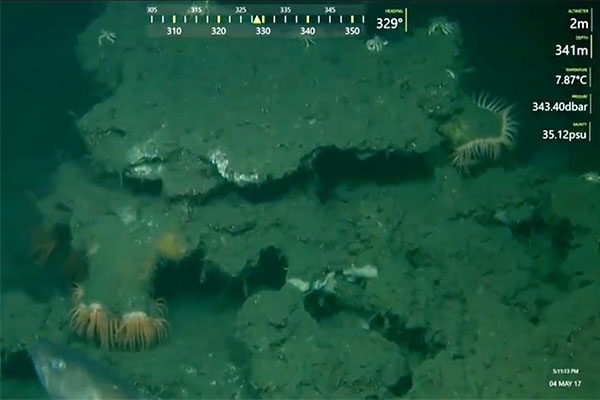
View from Oceaneering’s remotely operated vehicle (ROV) Global Explorer at approximately 5:11 p.m. EDT, May 4, 2017. Scientists are using the ROV to explore methane seeps off the U.S. Atlantic coast. Watch live-streamed video at http://oceanexplorer.noaa.gov/explorations/17atlantic-margin/welcome.html
From May 3-11, USGS scientists on the University of Delaware research vessel Hugh R. Sharp will use a remotely operated vehicle (ROV) to study some of the hundreds of seafloor methane seeps discovered between Baltimore Canyon and Cape Hatteras. The Interagency Mission for Methane Research at Seafloor Seeps (IMMeRSS) expedition will visit previously explored and unexplored seeps. Scientists are studying the age of these seeps, the source of methane gas, the special chemosynthetic ecosystems at these sites, and the physics of methane plumes rising through the ocean. Among the principal investigators is deep-sea coral expert Nancy Prouty of the Pacific Coastal and Marine Science Center. Partners include NOAA, Department of Energy, and the British Geological Survey. During the ROV dives, NOAA will live-stream video of the seafloor. Updates and information are available on the USGS Coastal and Ocean Science Facebook page and the USGS IMMeRSS website. Contact: Carolyn Ruppel, [email protected].
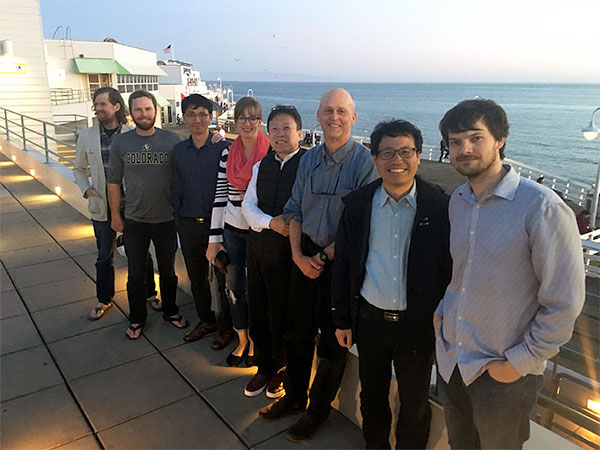
Photo of USGS researchers with visiting KIGAM researchers.
From March 28-29, 2017, the USGS Pacific Coastal and Marine Science Center in Santa Cruz hosted three research scientists from the Korea Institute of Geoscience and Mineral Resources (KIGAM). Drs. Nam-Hyung Koo, Gee Soo Kong, and M.H. Kang are very interested in USGS seafloor mapping and geohazards programs and products in particular, the acquisition, processing, and interpretation of data relevant to earthquake hazard assessments. USGS hosts Sam Johnson, Jared Kluesner, and Danny Brothers shared their recent experiences and strategies in mapping active faults and submarine landslides, and learned about northwest Pacific basin tectonics and recent earthquakes in the Sea of Japan. The visit yielded many stimulating conversations, and follow-up communication is underway. Contact: Sam Johnson, [email protected], 831-460-7546

Installing large boulders as rip rap to armor the shore against further erosion at Goleta Beach in southern California. The tide is very low (negative). Photo credit: Daniel Hoover, USGS
[Larger version]
A recently published paper forecasts that southern California could lose 31 to 67 percent of its beaches by 2100, if sea level rises 3 to 6 feet and human intervention is limited. The story was picked up by media outlets around the world, including the Orange County Register, CBS Los Angeles, KRON4 San Francisco, the Hans India, and MeteoWeb. Lead author Sean Vitousek (now at University of Illinois, Chicago) and USGS colleagues developed a new mathematical model, CoSMoS-COAST (Coastal Storm Modeling System–Coastal One-line Assimilated Simulation Tool), to forecast shoreline change. They applied it in southern California to see where shorelines would be by the end of this century. The model is part of the larger CoSMoS system, which forecasts details of flooding and coastal erosion caused by storms of different intensities over a range of future sea levels. The Journal of Geophysical Research–Earth Surface posted the paper March 15, 2017. Contact: Patrick Barnard, [email protected], 831-460-7556
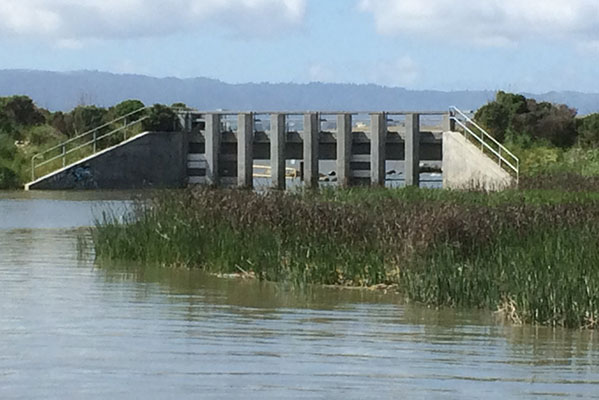
Water control structure between Alviso Slough (foreground) and approximately 14,000 acres of former salt ponds currently undergoing restoration. Restoration managers have gradually increased the number of gates and duration of openings while measuring scour in the slough and monitoring for elevated levels of mercury in sediments, water, birds, and fish in the surrounding area. Photo credit: Amy Foxgrover, USGS
USGS scientists mapped the bottom of Alviso Slough in San Francisco Bay March 27–29 to measure scour caused by heavy storms. In the largest wetland-restoration project on the U.S. West Coast, the South Bay Salt Pond Restoration Project is breaching levees to restore tidal flow to former commercial salt ponds. Managers worry that strong water flows—from levee breaches, storm runoff, or opening gates that route water into restored ponds—could stir up bottom sediment and re-mobilize mercury washed downriver from a now-closed mine. River flows in January and February were the highest since 1998. USGS, which maps the slough regularly to monitor effects of levee breaches and seasonal variability, conducted the extra survey to capture impacts of the high flows. USGS scientists will use the data to improve computer simulations developed to forecast the effects of continued restoration and sea-level rise. Bruce Jaffe [email protected], 831-460-7542, or Amy Foxgrover, [email protected], 831-460-7561

Curt Storlazzi installing a temperature sensor near the coral reef off Makua, Kauai, to try to detect fresh, cold, submarine groundwater seeping from the seabed. Groundwater can carry nutrients and contaminants that harm corals and may be causing the coral disease outbreak in the area. [Larger version]
USGS research oceanographer Curt Storlazzi was quoted in an article in The Garden Island newspaper (Kauai, Hawaiʻi) about the connection between watershed practices and the health of coral reefs. The article appeared March 20, 2017. Storlazzi is a leader of the USGS Coral Reefs project. Contact: Curt Storlazzi, [email protected], 831-460-7521

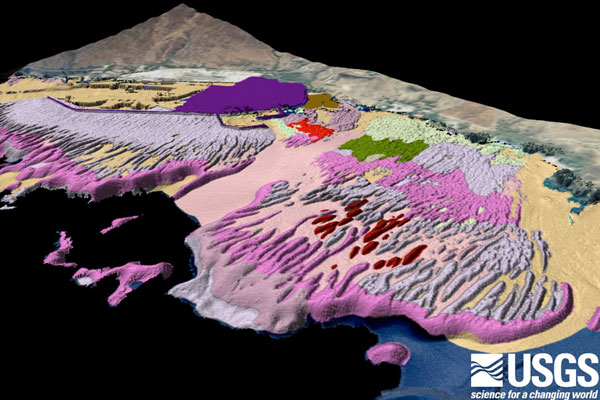
HERA lets users pick from a range of future sea levels and storm intensities to examine effects of coastal flooding on residents, businesses, infrastructure, and land cover. Shown here: number of residents (red-yellow) and projected flooding (dark blue) for a 20-year storm at sea level 25 centimeters (10 inches) higher than today’s in Imperial Beach, San Diego County. [Larger version]
The USGS recently added three counties (Santa Barbara, Los Angeles, and San Diego) to its Hazard Exposure Reporting and Analytics (HERA) interactive web application. HERA provides community-level estimates of resident, economic, land cover, and infrastructure exposure to coastal-flooding hazards for various storm and sea-level rise combinations. Such information is critical for emergency managers, community planners, and elected officials developing risk-reduction strategies. HERA now covers 12 counties in northern and southern California. It is a collaboration between the USGS Western Geographic Science Center and the USGS Pacific Coastal and Marine Science Center, which developed the Coastal Storm Modeling System (CoSMoS) used by HERA for flooding projections. Information provided by HERA supports short-term preparedness and outreach strategies to address current threats, as well as longer term mitigation and adaptation strategies. Contact: Jeanne Jones, [email protected], 650-329-5635

Sam Johnson (third from right) and other marine-geology enthusiasts at CGS conference.
The Council for Geoscience, South Africa’s geological survey, invited research geologist Sam Johnson of the Pacific Coastal and Marine Science Center (Santa Cruz, California) to participate in a 1-day workshop and 2-day conference in Pretoria, South Africa. CGS recently launched the South African Nearshore Mapping Program and invited Johnson to share his insights as a leader of the California Seafloor Mapping Program. Johnson gave a presentation at the workshop on March 1 and opened the conference on March 2 with a keynote address: “The California Seafloor Mapping Program—History, Challenges, Applications, and Lessons Learned.” The workshop and conference produced many stimulating conversations on marine geology and mapping with scientists from CGS as well as other South African agencies and academic institutions. Follow-up communications are underway. Contact: Sam Johnson, [email protected], 831-460-7546

Amy East, left, and Melissa Foley, right.
Students considering careers in Earth and ocean sciences gained valuable information from USGS research scientists Amy East and Melissa Foley at a March 8 event at the University of California, Santa Cruz. East, Foley, and eight more scientists on the GEODES Career Panel briefly described their career paths and then joined small groups of students for lively conversations that lasted more than 2 hours. Both graduate and undergraduate students attended the event, sponsored by the student organization GEODES (Geoscientists Encouraging Openness & Diversity in the Earth Sciences). Contact: Amy East, [email protected], 831-460-7533

USGS/UW crew aboard research vessel Barnes from left to right: Captain Ray McQuin, student Khadijah Homolka, Rob Wyland (USGS), Jared Kluesner (USGS), co-PI Emily Roland (front center, UW), Rachel Marcuson (USGS), co-PI Scott Bennett (USGS), co-PI Janet Watt (USGS), Maureen Walton (USGS), Patrick A'Hearn (UW marine tech). Inset, left: map showing location of the Cascadia subduction zone; inset, right: gear used on the research cruise. [Larger version]
Scientists from USGS and the University of Washington (UW) collected data in Seattle’s Lake Washington and Puget Sound to decipher the earthquake history of the Seattle fault, which runs beneath Seattle and neighboring communities. From February 20-28, they used UW’s research vessel Barnes to obtain detailed images of sediment layers as far as 200 meters below the seafloor. Scientists will identify and determine the ages of layers offset by past (paleo) earthquakes and correlate them with paleo-earthquakes recognized in sediments on land. These onshore/offshore studies will provide estimates of the size and frequency of past events to help communities prepare for future earthquakes. The work is part of a larger multi-disciplinary effort to evaluate the frequency of great earthquakes on the Cascadia subduction zone off the Pacific Northwest coast and improve assessments of the region’s earthquake hazards. Contact: Janet Watt, [email protected], 831-460-7565
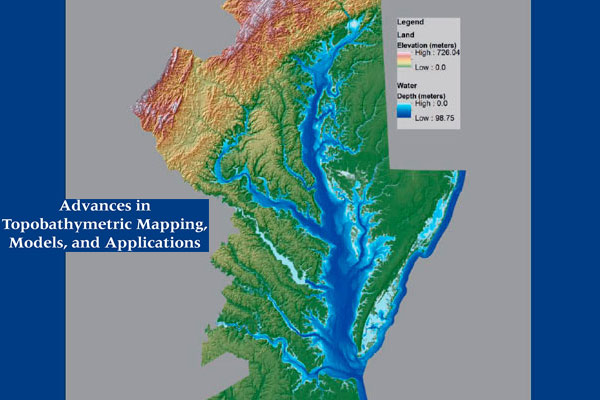
Part of the cover of Journal of Coastal Research Special Issue 76.
In coastal environments, elevation is perhaps the most fundamental and important variable that determines vulnerability. Accurate high-resolution digital elevation models (DEMs) that show both land and submerged topography (bathymetry) are key in coastal wetlands mapping and monitoring, storm surge and sea-level-rise modeling, benthic habitat mapping, coral reef-ecosystem mapping, and a host of related activities.
A special issue of the Journal of Coastal Research, “Advances in Topobathymetric Mapping, Models, and Applications,” edited by USGS scientists, provides a broad array of recent research findings on data, processing methods, applications, and physical processes that are critical for increased understanding of the dynamic coastal environment. Read more in the new issue of Sound Waves.
Patrick Barnard (right) discusses some of the initial projections for Venice and Marina del Rey with City of Los Angeles planning officials at a recent AdaptLA meeting, cosponsored by the City of Santa Monica and University of Southern California’s Sea Grant Program. Photo credit: Holly Rindge.
On the west coast of the United States, the USGS Pacific Coastal and Marine Science Center’s Coastal Processes Team, led by Patrick Barnard and a group of 10 modelers, geologists, engineers, and oceanographers, has developed the Coastal Storm Modeling System (CoSMoS) to help the 20 million residents of California coastal communities understand their vulnerabilities from storms and sea-level rise. CoSMoS is a state-of-the-art modeling system that models all the relevant physics of a coastal storm (for example, tides, waves, and storm surge), which are then scaled down to local flood projections. Rather than relying on historic storm records, CoSMoS uses wind and pressure from global climate models to project coastal storms under changing climatic conditions. Projections of multiple storm scenarios (daily conditions, annual storm, 20-year- and 100-year-return intervals) are provided under a suite of sea-level rise scenarios ranging from 0 to 2 meters (0 to 6 feet), along with a catastrophic 5-meter (16-foot) scenario. This allows users to manage and meet their own planning horizons and specify degrees of risk tolerance.
Read more in the new issue of Sound Waves.
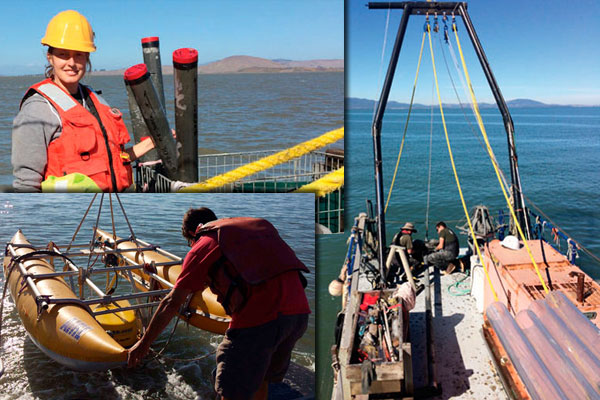
On the shallow-draft barge Retriever (right), USGS scientists led by Janet Watt (top, left) collected core samples of underwater sediment along the Hayward-Rodgers Creek fault zone in San Pablo Bay, California, to investigate the history of faulting beneath the bay. Jackson Curry (bottom, left) launches a chirp subbottom profiler from the USGS research vessel Parke Snavely in San Pablo Bay, California.
San Pablo Bay, a northern extension of California’s San Francisco Bay, hides its secrets well. For decades, scientists have speculated about whether two of the region’s earthquake faults—the Hayward and Rodgers Creek faults—connect beneath the bay.
Now, USGS scientists have arrived at an answer by combining several lines of evidence—detailed images of sediment layers just below the bay floor, measurements of the density and magnetization of sediment and rock deep beneath the bay, and modeling of fault deformation. They report their findings in “Missing link between the Hayward and Rodgers Creek faults,” published October 19, 2016, in Science Advances.
Why does it matter? The longer the stretch of fault that breaks during an earthquake, the stronger the quake. Read more in the new issue of Sound Waves.
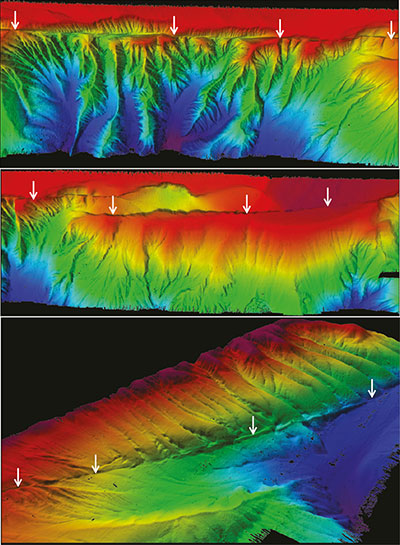
Perspective views of multibeam bathymetry data acquired by the USGS aboard research vessell Medeia. Shallower depths in red. Arrows point to the distinct line in the seafloor associated with the Queen Charlotte-Fairweather fault.
In the spring and summer of 2016, the USGS led two geophysical surveys of the Queen Charlotte-Fairweather fault off the coast of southeast Alaska. The team used multibeam sonar to map the ocean floor in detail, and multichannel seismic reflection to image deeper layers of sediment. The goals included determining how fast the two sides of the fault move past each other (slip rate) and deciphering the history of the fault. Researched sought to better understand how large earthquakes might trigger potentially dangerous underwater landslides.
Despite the often-difficult weather and sea conditions, he research team collected more than 4,600 square kilometers (1,700 square miles) of multibeam bathymetry and backscatter data. The bathymetric data provide remarkable new views of the shape and extent of the Queen Charlotte-Fairweather fault. The team immediately saw several previously unknown features, including a series of subtle bends and steps in the fault that appear to form basins within the fault zone. Perhaps the most intriguing aspect of the new imagery is the continuous and truly “knife-edge” character of the fault for the entire length of the 400-kilometer (250 mile) survey area.
Read more in the new issue of Sound Waves.
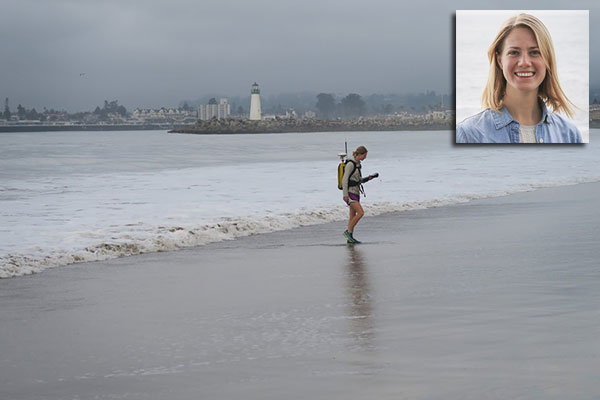
Christie Hegermiller, a UCSC graduate student working with the USGS, conducts research on California waves and how they may change in the future. Here, she surveys Twin Lakes beach during Fall 2016 with high resolution GPS mounted on a backpack to understand how sand moves along the coast. Christie recently spoke with a group of Life Long Learners on El Niño and the California coast. Photo by Andrew Stevens, USGS
On February 27, Christie Hegermiller, a Ph.D. candidate working at the USGS Pacific Coastal and Marine Science Center, met with a group of “Life Long Learners” affiliated with the University of California, Santa Cruz, at their monthly meeting in Scotts Valley, California. Hegermiller described the impact of El Niño on California coasts and her research predicting future wave conditions under changing wind and storm patterns. The group of about a dozen people included many with Ph.D. degrees and long careers in science, which led to insightful questions and lively discussions. Contact: Christie Hegermiller, [email protected], 831-460-7588
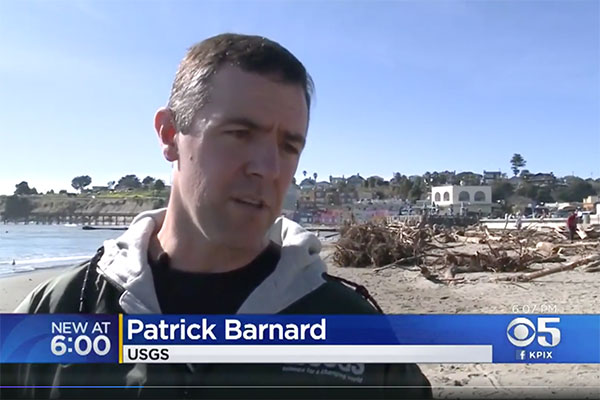
In a CBS5 (KPIX-TV) interview broadcast February 14 from Capitola, California, USGS geologist Patrick Barnard describes unprecedented coastal erosion along the U.S. West Coast caused by the 2015-16 El Niño.
A study by USGS geologist Patrick Barnard and colleagues triggered a flurry of media coverage when it appeared February 14 in Nature Communications. The study documents unprecedented coastal erosion along the U.S. West Coast during the 2015-16 El Niño. Barnard appeared on CBS5 News (KPIX-TV) from Capitola Beach on February 14. He spoke on National Public Radio on KQED’s Forum program on February 17 and WBUR’s Here and Now on February 22. Radio station KCBS (San Francisco) interviewed USGS oceanographer and co-author Dan Hoover on February 16. Stories appeared in the San Francisco Chronicle, the San Francisco Examiner, the Los Angeles Times, the News Tribune (Tacoma, Washington), the Orlando Sentinel (Florida), Popular Science, Discover, and numerous additional outlets in the U.S. (including Chinese- and Spanish-language sites) and overseas (France, UK, Australia, Germany, South Africa). Contact: Patrick Barnard, [email protected], 831-460-7556
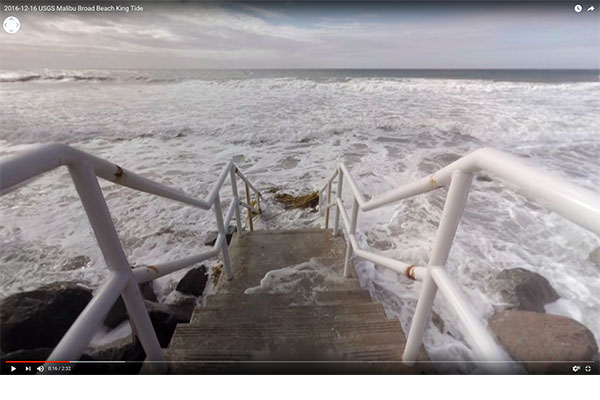
Screenshot from 360-degree video shot December 16, 2016, during a “king tide” at Malibu Broad Beach in Southern California.
Work by USGS oceanographer Juliette Finzi Hart is featured in an Orange County Register article published February 14, “How scientists are using virtual reality to show people effects of global warming”. Finzi Hart played a major role in creating virtual-reality viewers to help visitors envision the effects of sea-level rise and storms on Santa Monica beach. She is using a device on loan from Google to create 360-degree videos of flooding by extreme high tides (“king tides”) in various parts of Southern California. Available on YouTube, the videos enable viewers to see the kind of flooding likely to occur as sea level continues to rise. On February 24, Finzi Hart will present her work to the region’s South Bay Cities Council of Governments. Contact: Juliette Finzi Hart, [email protected], 831-460-7522
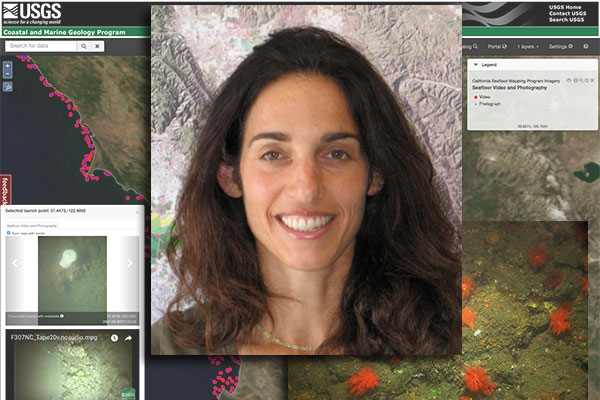
Photo of Nadine with imagery from the Coastal and Marine Geology Program's Video and Photograph Portal, for which she is the lead author.
Director Guy Gelfenbaum of the USGS Pacific Coastal and Marine Science Center (PCMSC) in Santa Cruz, California, announced on February 16 that Nadine Golden will be the Center’s Acting Deputy Director. Golden has an undergraduate degree from the University of California, Berkeley, and a Masters in Geography from San Francisco State University. She has been with PCMSC since 2004 and played a major role in GIS analysis, accuracy assessment, metadata, data management, and archives for the California Seafloor Mapping Program (CSMP) and Marine Geomorphology, Evolution, and Habitats project. Golden has helped lead PCMSC’s data management group and has facilitated Center scientists’ access to and use of ScienceBase to meet data publishing requirements. Her history of helping PCMSC accomplish its science goals makes her a valuable addition to the Center management team. Contact: Guy Gelfenbaum, [email protected], 831-460-7401
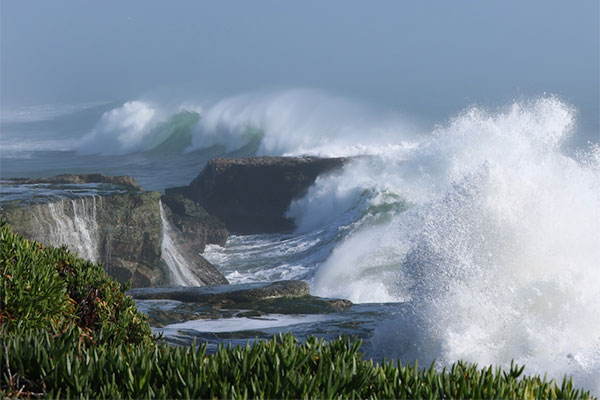
Large storm waves crashing on the rocks near Santa Cruz, California. Photo by Christie Hegermiller, USGS
In a study released today, U.S. Geological Survey scientists and their colleagues document how the 2015-16 winter featured one of the most powerful El Niño climate events of the last 145 years.
Read the February 14, 2017 USGS News Release.
Oblique map of seafloor habitats off Kawaihae, Hawaiʻi, developed from satellite imagery, underwater towed video, and lidar (airborne laser) bathymetry. Image credit: Susan Cochran, USGS
USGS geologist Curt Storlazzi explains how the USGS uses multiple techniques to map coral reefs in “Mapping Methods Prove Helpful in Protecting Coral Reefs,” published February 10, 2017, in POB. Storlazzi leads the USGS Pacific Coral Reefs project. POB, for “Point of Beginning,” a surveyor’s term, is a newsletter for professional surveyors and mappers.
Contact: Curt Storlazzi, [email protected], 831-460-7521.
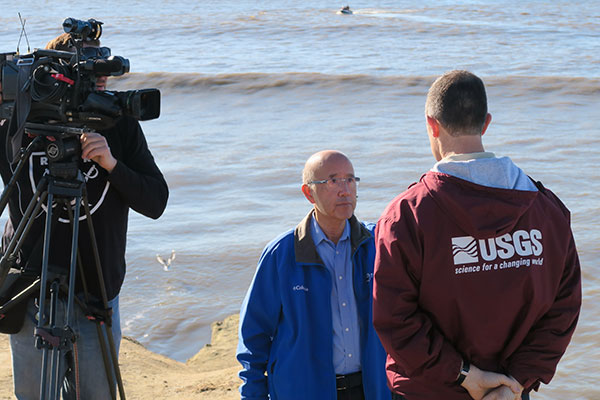
David Louie (center) of ABC7 News interviews USGS researcher Patrick Barnard (right) near the San Lorenzo River mouth during January 13 seafloor surveys to measure sand delivered by recent storms. Photo by Andrew Stevens, USGS.
A post-storm survey of beaches in Santa Cruz, California, by USGS researchers prompted numerous stories in the local media. On January 12-13, scientists from the Pacific Coastal and Marine Science Center mapped beaches and the seafloor around the mouths of two rivers to measure sediment washed to the coast by heavy rainfall (see next news item, below). Four TV stations filmed surveying on the morning of January 13: KPIX (CBS), ABC, KSBW (no link available), and KION. By January 23, project leader Patrick Barnard had given additional interviews to the Santa Cruz Sentinel and the Good Times, and a second interview to KSBW.
Contact: Patrick Barnard, [email protected], 831-460-7556.
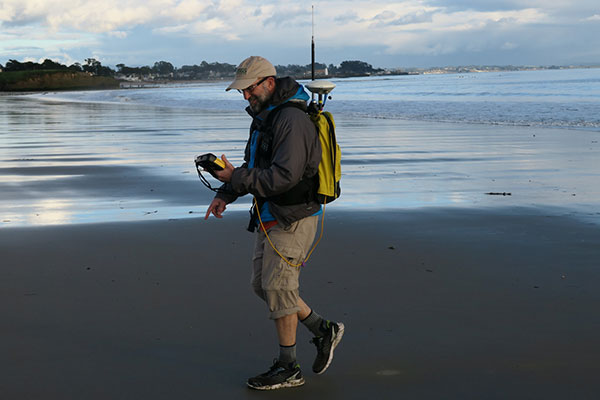
USGS oceanographer Dan Hoover uses a GPS-equipped backpack to measure sand elevations on Main Beach in Santa Cruz, near the mouth of the San Lorenzo River, January 12, 2017. Photo by Andrew Stevens, USGS.
On January 12-13, just days after “atmospheric river” storms dropped heavy rain on Santa Cruz, California, scientists from the USGS Pacific Coastal and Marine Science Center surveyed local beaches to compile a three-dimensional map of storm-related changes. Using a laser scanner, GPS-equipped backpacks, and a sonar-equipped boat and personal watercraft, they measured the beaches and seafloor around the mouths of the San Lorenzo River and Soquel Creek. Early results show the storms washed approximately 100,000 cubic meters (about 10,000 dump-truck loads) of sand to each river mouth. The added sediment built temporary bars, which enhanced local surfing spots. In the long term, the sand should help protect beaches and developed bluffs and shoreline. The fieldwork complements twice-a-year surveys from Santa Cruz to Moss Landing. The research results should assist communities planning for sea-level rise and other coastal hazards. Contact: Patrick Barnard, [email protected], 831-460-7556.
Media links:
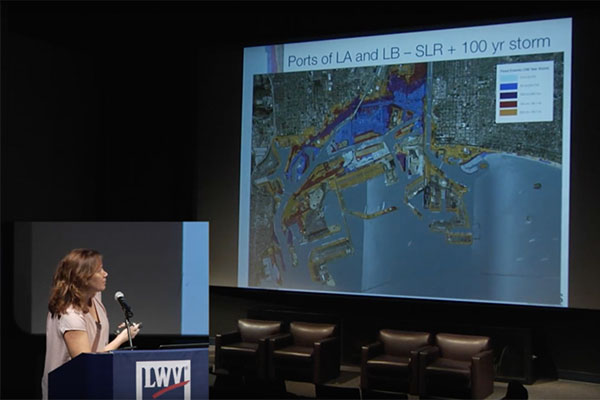
Juliette Finzi Hart, USGS, shows how much flooding a large storm combined with future sea-level rise would likely cause in the ports of Los Angeles and Long Beach.
Juliette Finzi Hart of the USGS Pacific Coastal and Marine Science Center used virtual reality to show how future storms and sea-level rise are likely to change the shoreline at Long Beach, California. She was part of a public forum at the Aquarium of the Pacific on January 21, 2017, sponsored by the aquarium and the League of Women Voters. Finzi Hart described coastal flooding projected by the USGS Coastal Storm Modeling System (CoSMoS) and showed images of the prior week’s “king tides,” or highest high tides of the year. Today’s extreme high tides will be tomorrow’s average daily high tide, and they help the CoSMoS group validate model projections for future sea-level rise. Read an interview with Finzi Hart; view her 360° video of January 12 king tide in Long Beach; and view the archived forum (Finzi Hart’s presentation begins around the 40-minute mark). Contact: Juliette Finzi Hart, [email protected], 310-801-3435
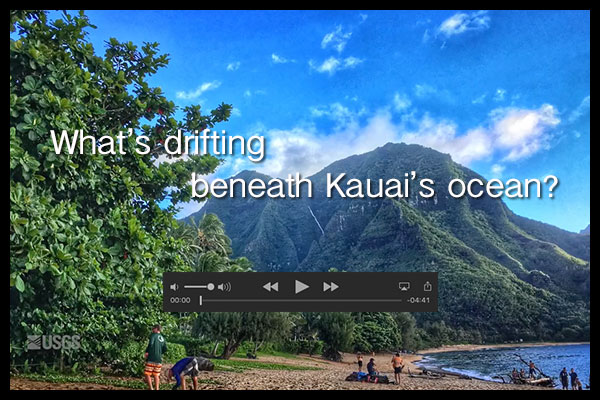 What’s Drifting Beneath Kauai’s Ocean?
Filmed and produced by Amy West
Residents and visitors both revel in Kauai’s lush landscape, and beneath its seascape. However, it’s underwater where things don’t look so healthy—at least not here at Makua Beach.
Scientists from the U.S. Geological Survey got a detailed picture of the coral reef’s physical environment. Understanding just what these reefs are exposed to and for how long, may help explain why some corals here have succumbed to black band disease.

USGS research geologist Amy East prepares to collect a sample of water from the San Lorenzo River in downtown Santa Cruz on January 8, 2017. Photo by Andrew Stevens, USGS. [Larger version]
Scientists from the USGS Pacific Coastal and Marine Science Center and California Water Science Center worked day and night January 7-9 to collect samples of sediment-laden water from the flooding San Lorenzo River. It was the third high flow in a three-week period. From a pedestrian bridge in downtown Santa Cruz, they collected more than 20 samples for measurement of sediment content. The work is part of a multiyear study of how conditions in the watershed—such as total rainfall and recent flooding and drought history—affect the amount of sediment washed to the coast. Answers will help coastal and water-resource managers understand how watershed sediment output, along with the amount of sediment-associated pollutants, may change along California’s coast with year-to-year variations in storm frequency and intensity during an era of changing climate. Contact: Amy East, [email protected], 831-460-7533.
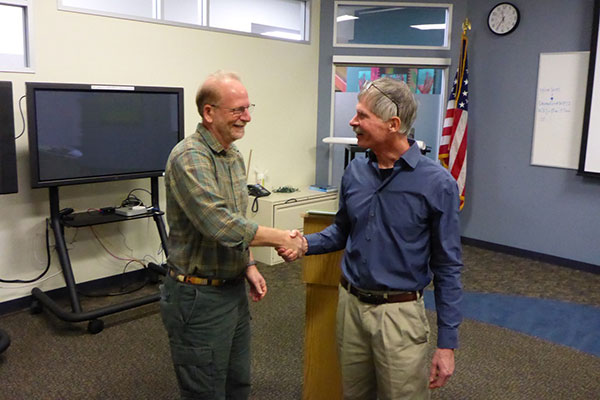
New Science Center Director Guy Gelfenbaum (left) shakes hands with outgoing Center Director, Bob Rosenbauer. Photo by Rex Sanders, USGS.
Dr. Guy Gelfenbaum has become the new Director of the USGS Pacific Coastal Marine Science Center in Santa Cruz, California. Regional Director Mark Sogge of the USGS Pacific Region announced Guy’s selection on January 4, 2017, and his official term began January 8. Guy comes to his new position from a long-time role as a USGS research oceanographer in Santa Cruz and St. Petersburg, Florida. Most recently, he led the Coastal Habitats in Puget Sound (CHIPS) project, a multidisciplinary research effort to support ecosystem recovery in Puget Sound. Guy served on the USGS Ecosystems Strategic Science Planning Team and several Pacific Northwest multiagency science-advisory teams. He succeeds Bob Rosenbauer, who has retired from USGS after directing the Center for nearly 6 years. Thanks to Bob (now a USGS emeritus scientist) and welcome to Guy! Contact: Jane Reid, [email protected], 831-460-7402.
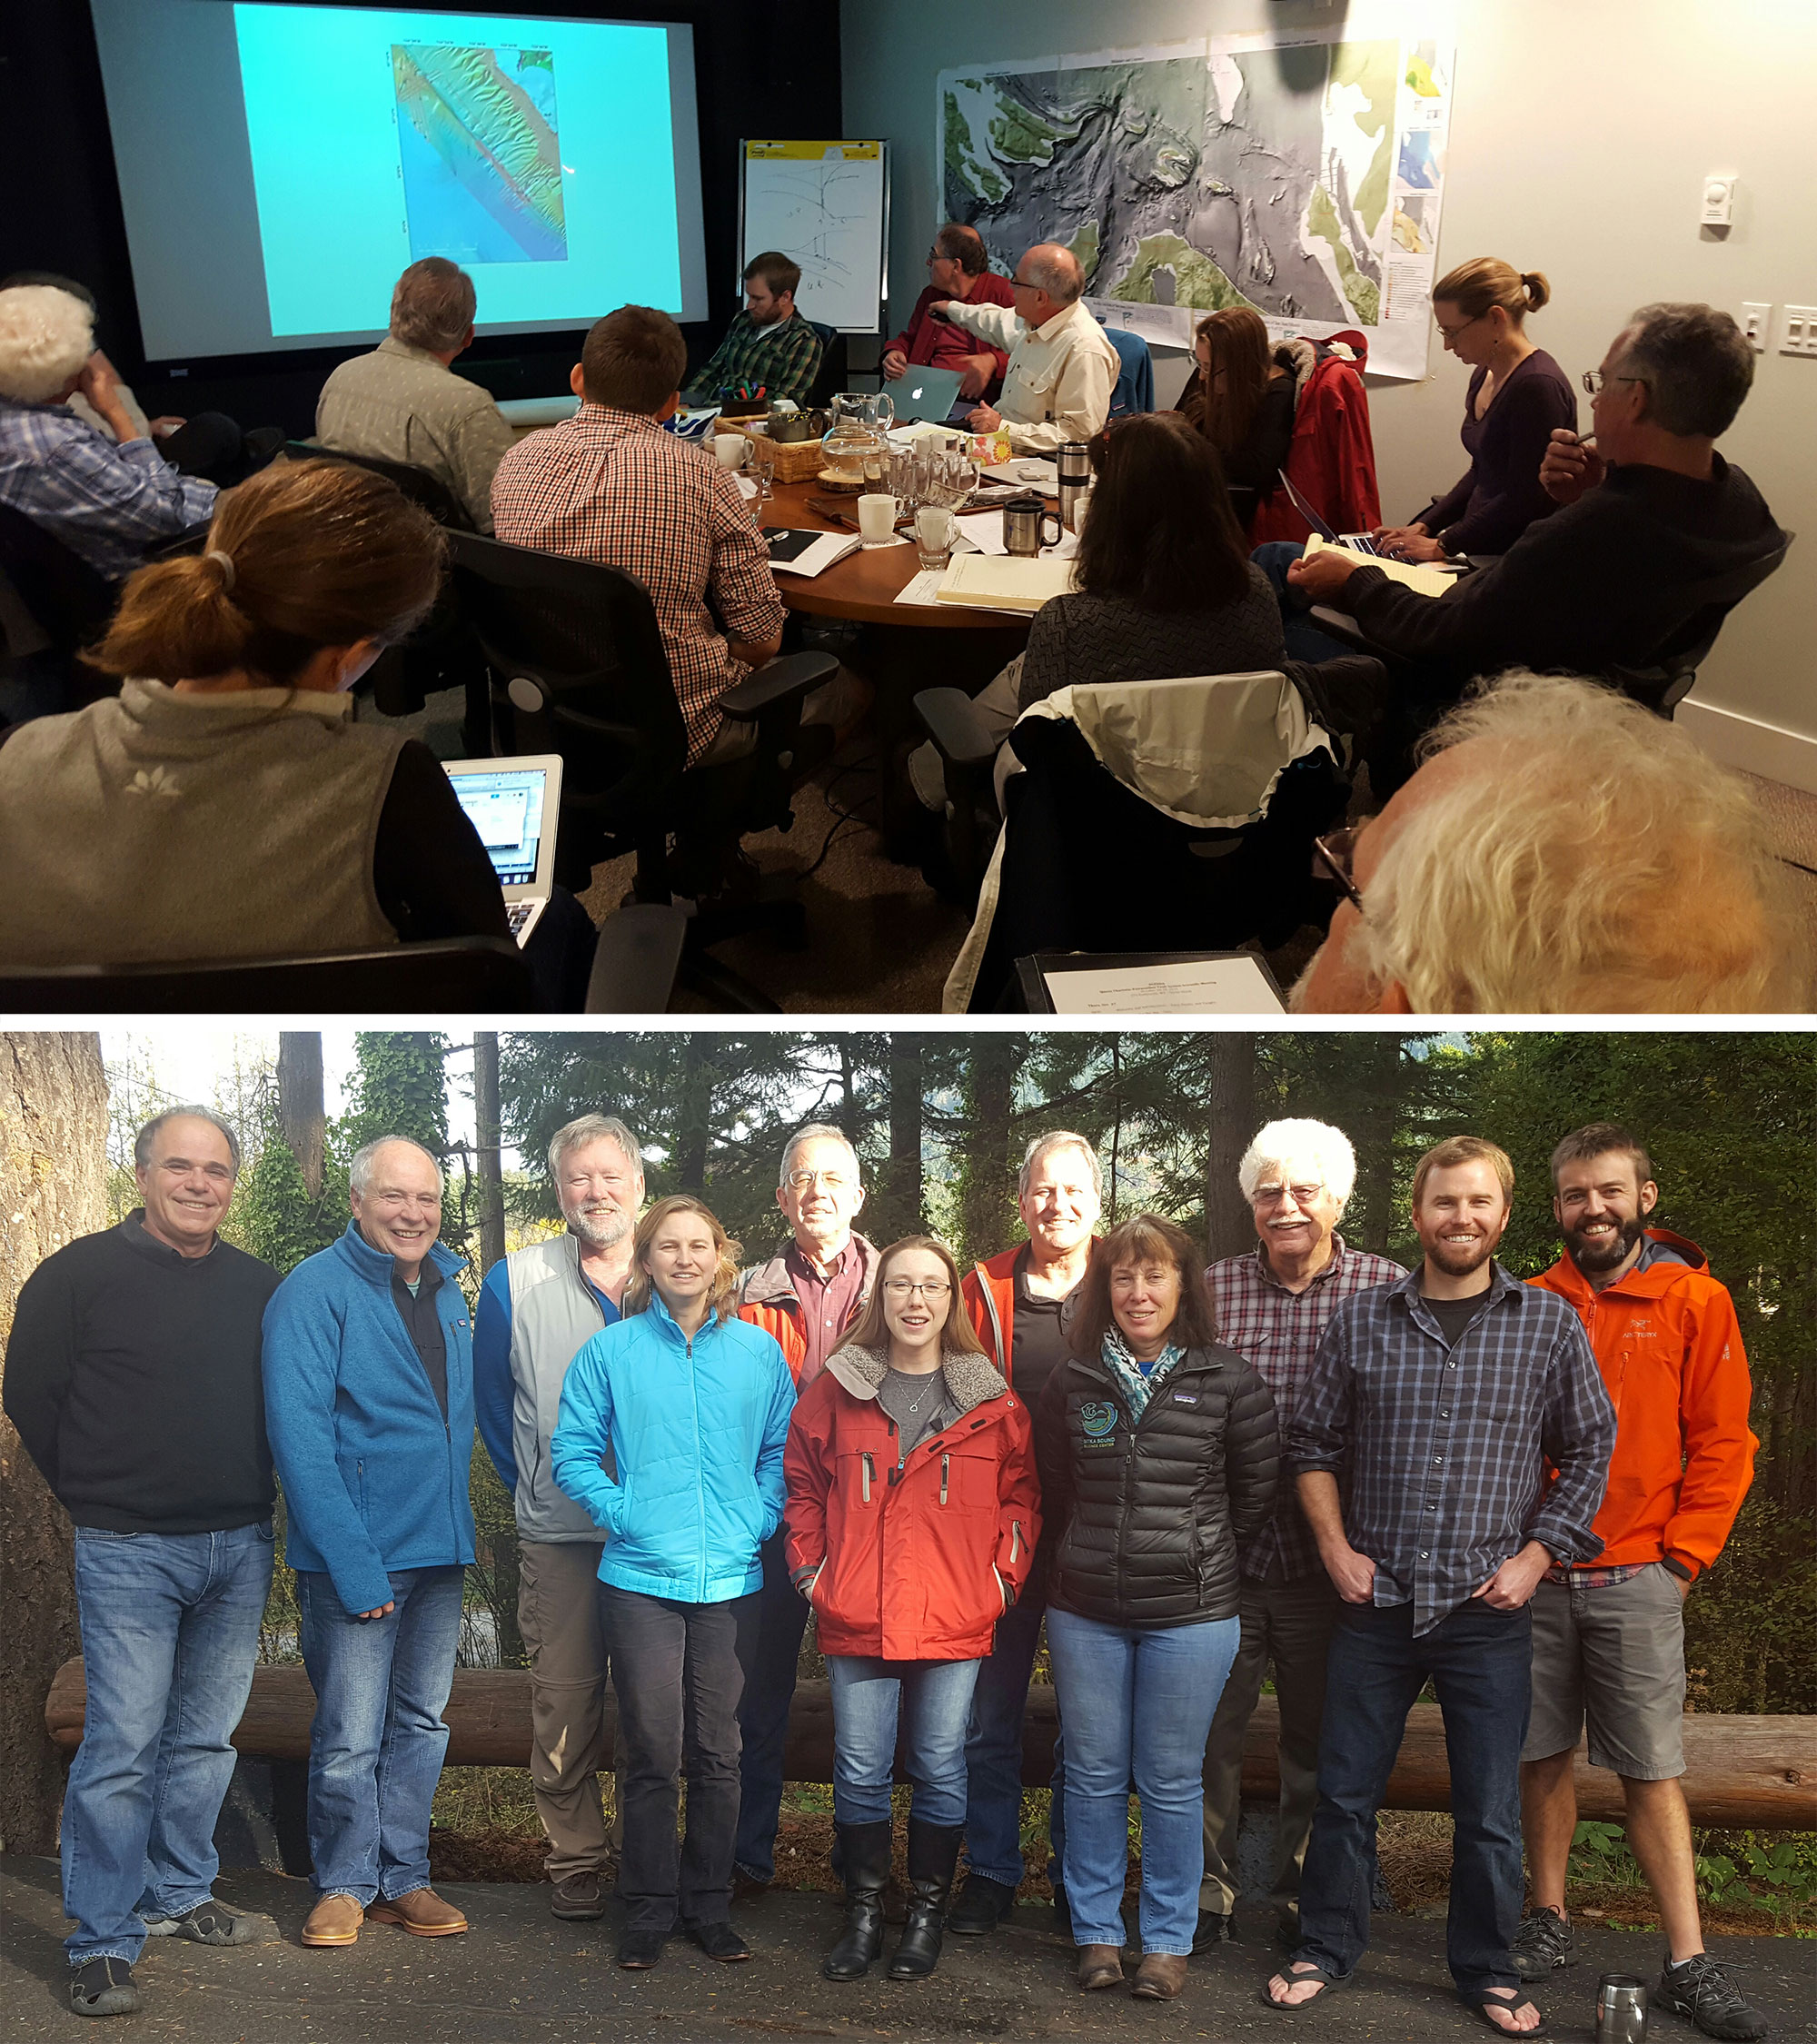
Top: Photograph from the workshop in October, 2016.
Bottom: Workshop participants, back row, left to right: Uri ten Brink (USGS), Vaughn Barrie (Geological survey Canada), Kim Conway (Geological Survey of Canada), Stu Nishenko (PG&E), Jamie Conrad (USGS), Gary Greene (Moss Landing Marine Lab), and Nathan Miller (USGS); and front row, left to right: Amy East (USGS), Katie Coble (USGS), Tory O'Connell (Sitka Sound Science Center), and Danny Brothers (USGS). [Larger version]
USGS scientists and colleagues held a workshop to share recently acquired marine data on the Queen Charlotte-Fairweather fault in southeast Alaska and to plan 2017 research cruises. Participants from USGS, Geological Survey of Canada, Sitka Sound Science Center, Moss Landing Marine Lab, and Friday Harbor Laboratories met October 25-29, 2016, on Orcas Island, Washington.
Like California’s San Andreas fault, the Queen Charlotte-Fairweather fault (QCFF) is a strike-slip fault separating the Pacific and North American tectonic plates. The QFCC lies mostly offshore southeast Alaska and British Columbia. It has experienced seven major earthquakes in the past 100 years, including a 1949 magnitude-8.1 event, Canada’s largest recorded earthquake.
The workshop participants are collaborating to fill gaps in knowledge about this extremely active fault and the hazards it poses to communities in Alaska and Canada.
Contact: Danny Brothers, [email protected], 831-460-7460

At the 2016 AGU Fall Meeting, USGS geophysicist Stephanie Ross (right) speaks with Interior Secretary Sally Jewell about ways to help decision makers, emergency responders, and other stakeholders use scientific findings about tsunamis. Photo credit: USGS.
A Washington Post article published December 15, 2016, includes a photo of Secretary of the Interior Sally Jewell talking with USGS geophysicist Stephanie Ross at the American Geophysical Union (AGU) Fall Meeting in San Francisco. Ross was showing the Secretary her poster on how to engage decision makers, emergency responders, and other stakeholders in using scientific findings about tsunamis, titled: "Get People Talking: Sharing Tsunami Science Beyond the Web".
View the Washington Post article.
Contact: Stephanie Ross, [email protected], 650-329-5326.
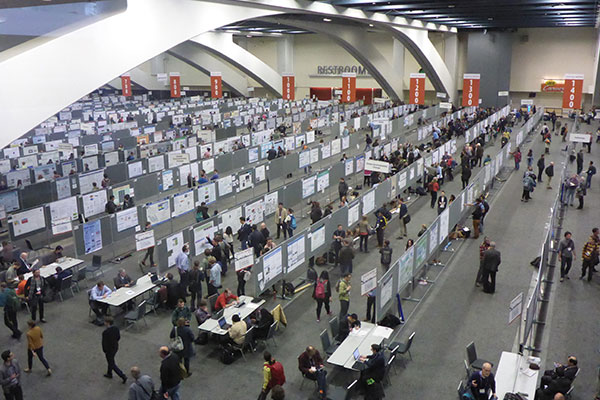
Looking down on the large poster hall at the AGU Fall Meeting. Many rows of posters on boards with people reading and walking. Photo by Rex Sanders, USGS
USGS News Release, Dec. 8, 2016
By Rex Sanders
Their days often start with breakfast meetings and end with working dinners. They give presentations to hundreds of their peers, debate fine points in crowded poster halls, and catch up with colleagues in long refreshment lines.
USGS scientists also broaden their scientific horizons, get ideas for new projects, and plant the seeds for collaborations that might change the way we think about the Earth.
Read the entire USGS News Release.
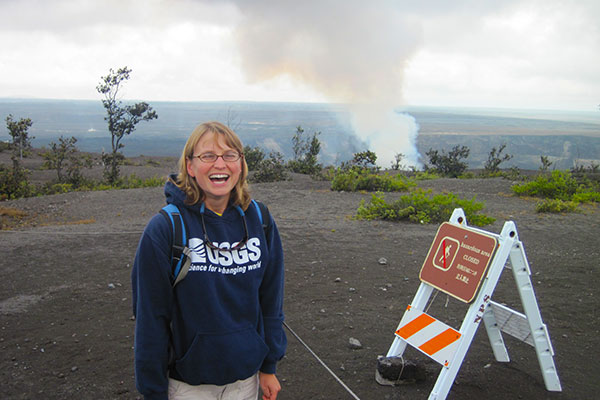
Amy East wears her "I love geology!" face as Hawaiʻi's Kilauea volcano steams in the background. Photo by Erin Todd, USGS.
USGS research geologist Amy East of the Pacific Coastal and Marine Science Center in Santa Cruz, California, spoke October 14, 2016, at an independently organized TED talk event (known as TEDx). East addressed students at Santa Catalina School, an all-girls’ high school in Monterey, about the importance of Earth science and diversity in the sciences. Each year the school’s student-led TEDx team lines up engaging and diverse speakers from the local community. East is one of seven who spoke at this year’s two-hour event. View her talk, “Adventures on Planet Earth,” on the TEDx YouTube channel.
Contact: Amy East, [email protected], 831-460-7533
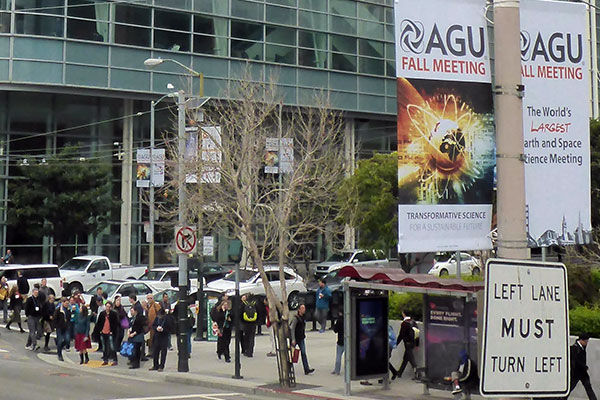 The American Geophysical Union plans to live-stream three 2016 Fall Meeting sessions that include talks by USGS coastal and ocean scientists. AGU On-Demand provides free access to selected sessions via videos live-streamed during the meeting and archived for later viewing. Viewers do not have to be members to sign up. Visit the AGU Fall Meeting web site and click “AGU On-Demand.” The three sessions featuring USGS coastal and ocean science are:
Contact: Rex Sanders, 831-460-7555, [email protected].
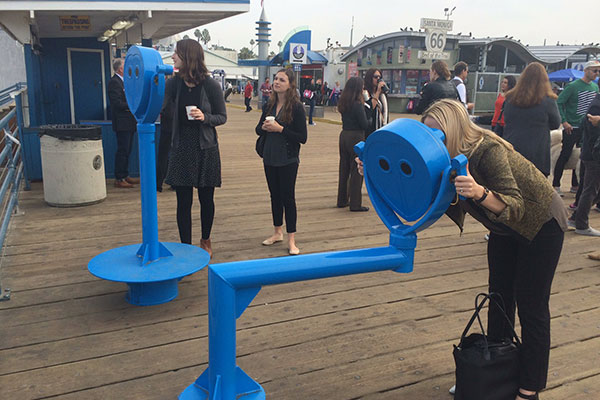
Above: Visitors on Santa Monica Pier look through “Owls,” virtual-reality viewers that show how the beach beside the pier will look when future storms and sea-level rise raise water levels. Photo courtesy of USC Sea Grant.
Below: View through the Owl: At today’s sea level, a big storm together with a high tide could cover almost the entire beach.
See a larger version.
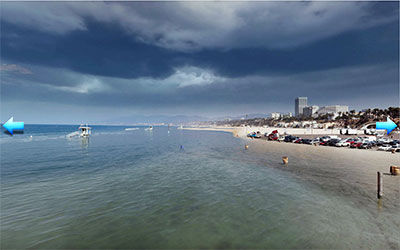
Visitors to the Santa Monica Pier in southern California can now see what the beach might look like when future storms and sea-level rise raise water levels. Two virtual-reality viewers, named “Owls” for their distinctive appearance, show the projected extent of flooding by a big storm at high tide, by sea-level rise, and by both together. The projections come from the USGS Coastal Storm Modeling System (CoSMoS). The viewers also show how communities can adapt to sea-level rise through nature-based coastal-planning projects, such as enhanced dunes. The City of Santa Monica developed the Owls (one ADA-accessible) in partnership with the USGS, Owlized, and the USC Sea Grant program. The Owls will operate from November 7, 2016, to January 7, 2017; a public celebration was held November 16 to coincide with “King” high tides.
View more photographs on our Facebook page (USGS Coastal and Ocean Science)
Contact: Juliette Finzi Hart, [email protected], 424-241-2457.
Screenshot of Janet Watt from CBS This Morning news segment. ©CBS
A camera crew from CBS This Morning visited the USGS Pacific Coastal and Marine Science Center on November 10, 2016, to interview Janet Watt about her discovery of a connection between the Hayward and Rodgers Creek faults, two of the most hazardous earthquake faults in California’s San Francisco Bay area. In addition to a sit-down interview, they filmed Watt and her team—Mary McGann, Katie Maier, and Tom Lorenson—processing sediment cores collected along the fault beneath San Pablo Bay. CBS News correspondent Mireya Villareal asked about what led to the discovery, what it means for Bay Area earthquake hazards, and how the team plans to use microfossils from the cores to date movement on the newly discovered fault strand.
View the segment, which aired November 18.
View b-roll video of USGS scientists and technicians working to collect samples from San Pablo Bay, California.
Contact: Janet Watt, [email protected], 831-460-7565.
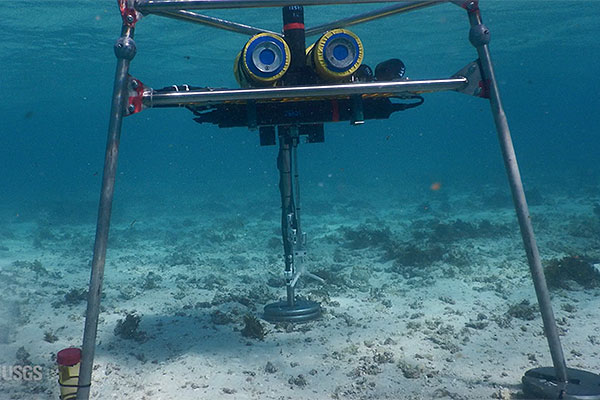
Tripod holding instruments and cameras used to measure and study aspects of sediment movement in and around the reef.
A new video, “Breaking Down Reefs, Building Up Beaches,” follows coral reef experts from the USGS and the University of Western Australia as they conduct the largest-ever hydrodynamic study of how coral reefs shape coasts. The scientists spent two weeks in May 2016 installing instruments to measure currents and sediment movement in and around Australia’s largest fringing reef, in the Ningaloo Coast UNESCO World Heritage Site, Western Australia. Over the next two months, the instruments collected massive amounts of data that will give scientists great insight into the protective role of reefs and will help the USGS forecast what could happen to U.S. fringing reefs in the face of climate change and sea-level rise. View the video. Contact: Curt Storlazzi, [email protected], 831-460-7521.

Three-dimensional view of western Santa Barbara Channel. Rainbow colors are seafloor surface, with red for shallowest depths. Cutaway is vertical view (seismic profile) of sediment layers (red lines) beneath the seafloor. Note landslides (far end) and long crack in seafloor. Gas seep location is based on sonar mapping of bubbles in the water column. [Larger version]
From September 11 to October 5, 2016, USGS scientists used high-resolution sonar to map the seafloor and image bubbles from natural gas seeps near Santa Barbara, California. They also collected high-resolution seismic profiles of sub-seafloor sediment layers. They are investigating the causes and history of underwater landslides, which can damage offshore oil platforms and pipelines, and generate local tsunamis. The scientists worked from two research vessels: the R/V Snavely (USGS) and the R/V Shearwater (NOAA Channel Islands National Marine Sanctuary). They will combine the new data with older data to evaluate changes in seafloor topography and to map active faults, old and new landslides, and oil and gas pathways that could weaken slopes and set them up for future slides. The team plans to present preliminary results at the 2016 AGU Fall Meeting in December. Contact: Jared Kluesner, [email protected], 831-460-7547.
Learn more on the USGS project page, "Underwater Landslides off Southern California."
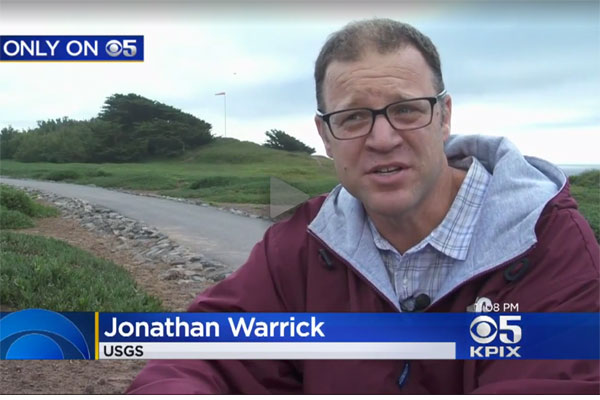
Screen capture of Jon Warrick, from the KPIX story video. © KPIX
USGS geologist Jonathan Warrick appeared in a TV newscast about his use of historical photos to measure cliff erosion at Fort Funston in San Francisco, California. On October 28, 2016, Warrick met Andria Borba of KPIX 5, a CBS affiliate, at Fort Funston. He showed her how easily the cliff crumbles, explained how overlapping photos enabled his team to measure erosion rates, and noted that the results can help scientists forecast future erosion. “Geologists Get 3-D Pictures Of Beach Erosion On California Coast,” aired that night and on the web. A recent press release and journal article by Warrick and others prompted the interview. Contact: Jon Warrick, [email protected], 831-460-7569.
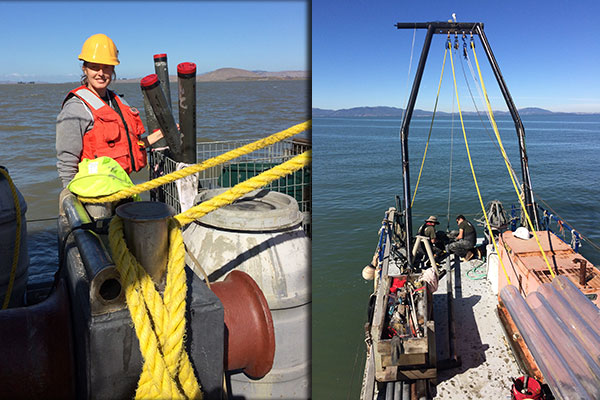
On research vessel Retriever (right), USGS scientists led by Janet Watt (left) collected core samples of bayfloor sediment along the Hayward-Rodgers Creek fault zone in San Pablo Bay, California, to investigate the history of faulting beneath the bay.
From October 17-21, 2016, USGS scientists collected 20 core samples of bayfloor sediment along the Hayward-Rodgers Creek fault zone in San Pablo Bay, a northern extension of San Francisco Bay, California. The longest core measures nearly 4 meters. Detailed radiocarbon dating of benthic forams (one-celled microorganisms) in the core samples will aid in unraveling the history of faulting in the bay and constraining the age of the most recent surface-rupturing earthquake along this part of the fault zone. Recent high-resolution acoustic imaging revealed a direct link between the Hayward and Rodgers Creek faults and provided a framework for targeted sampling of offset sediment layers, unconformities, and peculiar gas pockets. Contact: Janet Watt, [email protected], 831-460-7565.

Institute For Figuring's Crochet Coral Reef project, 2005-ongoing. Photo © the IFF.
Research oceanographer Curt Storlazzi (Pacific Coastal and Marine Science Center) served as a shallow-water coral expert in a panel discussion titled “Understanding Coral Reefs through Marine Science and Woolly Sculptures.” The free public event took place October 20, 2016, at the Seymour Marine Discovery Center, affiliated with the University of California, Santa Cruz (UCSC). Storlazzi was joined by deep-sea coral expert Matt McCarthy of UCSC and science communicator Margaret Wertheim. Wertheim’s projects include Crochet Coral Reef, the largest participatory art/science project in the world. The panel explored the interweaving of science and art, with a focus on coral reefs and the challenges that sea-level rise, climate change, and human-driven stressors pose to their health and sustainability. Contact: Curt Storlazzi, [email protected], 831-460-7521.
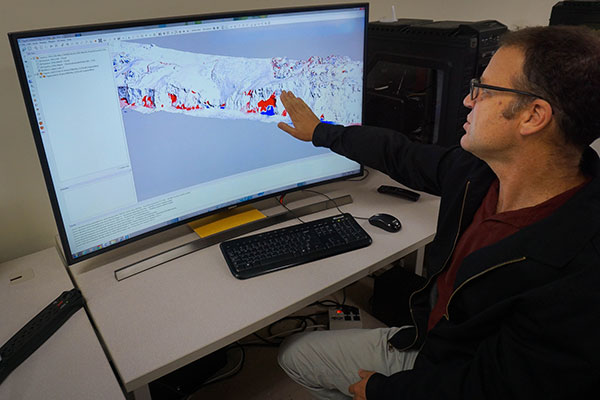
USGS research geologist Jon Warrick explains a “difference map” constructed from structure-from-motion data. Red areas indicate loss of material (erosion); blue areas show addition of material (deposition). Photo by Amy West, USGS
U.S. Geological Survey scientists and their coauthors from the California Coastal Records Project have found a way to use historical aerial photographs to accurately measure coastal erosion. Applying a low-cost technique called “structure-from-motion” to five sets of oblique aerial photos spanning the years 2002 to 2010, the scientists measured the volume of material eroded from coastal cliffs at Fort Funston, on the westernmost edge of San Francisco. Their results were published October 21, 2016 in the Journal of Coastal Research. Quantifying coastal change is essential for calculating trends in erosion, evaluating processes that shape coastal landscapes, and predicting how the coast will respond to future storms and sea-level rise, all critical for communities along the California coast.
To learn more, read the USGS news release or contact Jon Warrick, [email protected], 831-460-7569. Also, watch Jon's interview which aired on CBS SF Bay Area, October 28th.
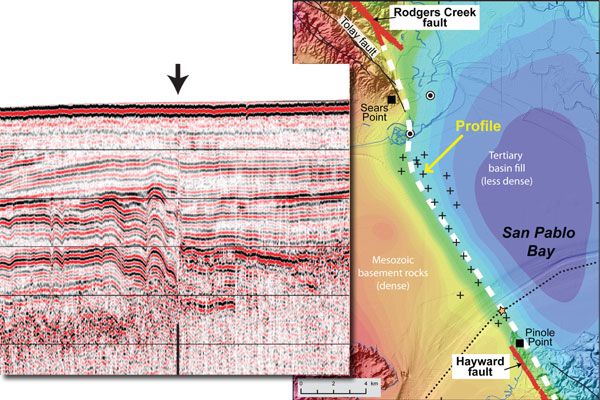
Above, left: Seismic-reflection profile created by bouncing sound waves off sediment layers beneath San Pablo Bay. Note deformation of layers by Hayward fault (black arrow). Above, right: Variations in gravity caused by differences in rock density under the bay. Sharp change in gravity values (dashed white line) lies close to sites where seismic-reflection profiles imaged the Hayward fault (plus signs).
USGS scientists used a suite of complementary techniques to image sediment layers beneath San Pablo Bay, California, revealing an active fault beneath the bay that links two of the most urbanized and hazardous strike-slip faults in the San Francisco Bay area. The discovery, first announced December 2015 at the American Geophysical Union Fall Meeting, is detailed in “Missing Link between the Hayward and Rodgers Creek Faults,” published October 19, 2016, in Science Advances. Longer fault ruptures produce larger earthquakes, so understanding how fault segments connect with one another is critical to assessing the earthquake hazards they pose. This study demonstrates the importance of integrated, high-resolution mapping of sub-seafloor layers for characterizing the often-subtle deformations (as small as a few centimeters) where fault segments meet. Contact: Janet Watt, [email protected], 831-460-7565.
Learn more about the USGS study, "Offshore Faults along Central and Northern California"
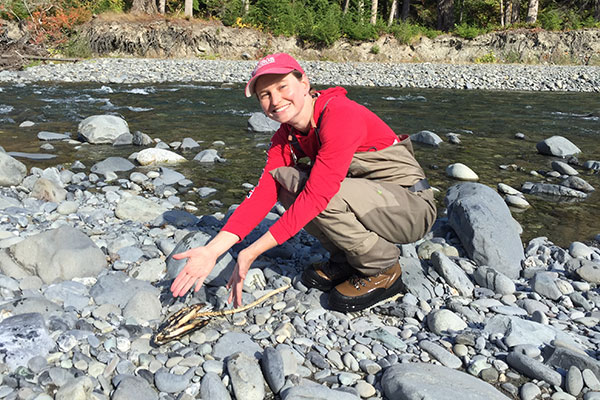
USGS geologist Amy East was delighted to observe a Chinook salmon carcass upstream from two dams recently removed from the Elwha River in Washington State. River restoration has allowed salmon to reach upstream spawning grounds for the first time in more than a century.
For the first time in more than a century, salmon have reached stretches of the Elwha River upstream from two dams built in the early 1900s and recently removed. In August 2016, fisheries biologists observed live salmon there. In September 2016, USGS scientists doing topographic surveys found carcasses of Chinook salmon that died after migrating from the ocean to above the upper dam site, completing their natural life cycle. Although dam removal concluded in 2014, a boulder jam remained a fish barrier until fall 2015, when NPS dynamited the boulders. Now, fish are migrating into the upper watershed—a huge success for the Elwha River Restoration Project, recently honored as a finalist for the international Riverprize. Monitoring ecosystem recovery in the Elwha is a cooperative effort by Olympic National Park, Lower Elwha Klallam Tribe, U.S. Fish and Wildlife Service, USGS, NOAA, and Washington Department of Fish and Wildlife. Contact: Amy East, [email protected].
Learn more about USGS science supporting the Elwha River Restoration Project.
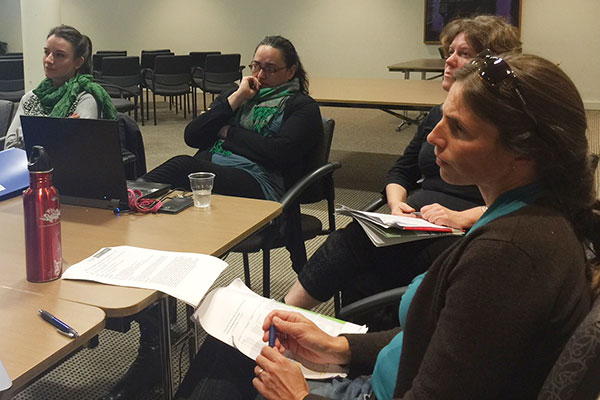
Melissa Foley (right) and colleagues preparing for the “Planning for Cumulative Effects in a Complex World” workshop, held 17 August 2016 in Wellington, New Zealand.
USGS research ecologist Melissa Foley served as an international science expert at the “Planning for Cumulative Effects in a Complex World” workshop held 17 August 2016 in Wellington, New Zealand. Cumulative effects are environmental stressors that overlap in space and/or time. Coastal and marine examples include sea-level rise, fishing, coastal development, and ocean acidification. Foley helped plan and execute the workshop, where participants discussed the challenges of assessing cumulative effects in coastal and marine systems, and ways to facilitate communication among scientists, funding agencies, and policy makers. Foley’s USGS research focuses on understanding how systems are connected, how human and natural disturbances affect those connections, and how science can be integrated with management strategies to address coastal and marine issues. Contact: Melissa Foley, [email protected], 831-460-7564.

Stretch of beach in Malibu, California, vulnerable to flooding from storms and sea-level rise. Cropped from image 201309712 in California Coastal Records Project.
USGS science turned up in an unexpected place: The Hollywood Reporter, which ran the story “Underwater in 40 Years? Which L.A. Beach Homes Are at Risk” in its August 12, 2016, issue. The piece describes how projected sea-level rise could inundate expensive areas and homes, and how flooding could be higher during a major winter storm. The reporter relied on data and maps from the USGS Coastal Storm Modeling System (CoSMoS). CoSMoS makes detailed long-range forecasts of coastal erosion and flooding caused by climate change, sea-level rise, and storms. Several California agencies used preliminary results from a CoSMoS update to plan for possible storm flooding and erosion during last year’s El Niño. Contact: Patrick Barnard, [email protected], 831-460-7556.
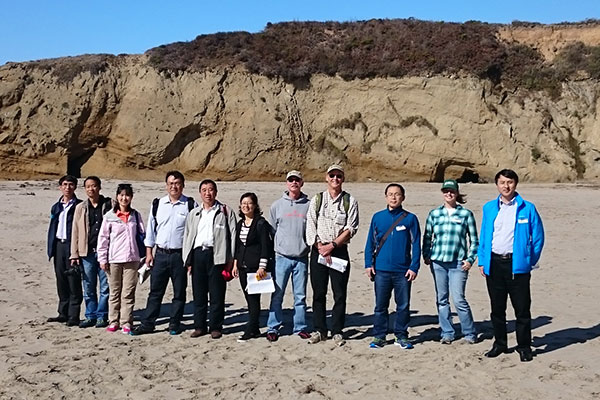
Chinese visitors and USGS hosts during a field trip stop at Cove Beach in Año Nuevo State Park. Photo by Stephen Hartwell, USGS.
Eight scientists from the China Geological Survey (CGS) and affiliated organizations visited the USGS Pacific Coastal and Marine Science Center in Santa Cruz, California, on September 14 and 15, 2016. The Chinese visitors and their USGS hosts discussed their respective coastal research programs and possibilities for future cooperation. During a one-day workshop on September 14, scientists from both groups described research to address various coastal issues, including flooding, erosion, seafloor habitats, sediment movement, offshore earthquakes, and wetland loss. On September 15, the visitors learned more about USGS studies during a field trip to coastal areas north and south of Santa Cruz. Ms. Ping Yin, professor at Qingdao Institute of Marine Geology and coordinator of a new CGS coastal geology program, initiated the visit to further cooperation between CGS and USGS scientists. Contact: Bob Rosenbauer, [email protected], 831-460-7401.
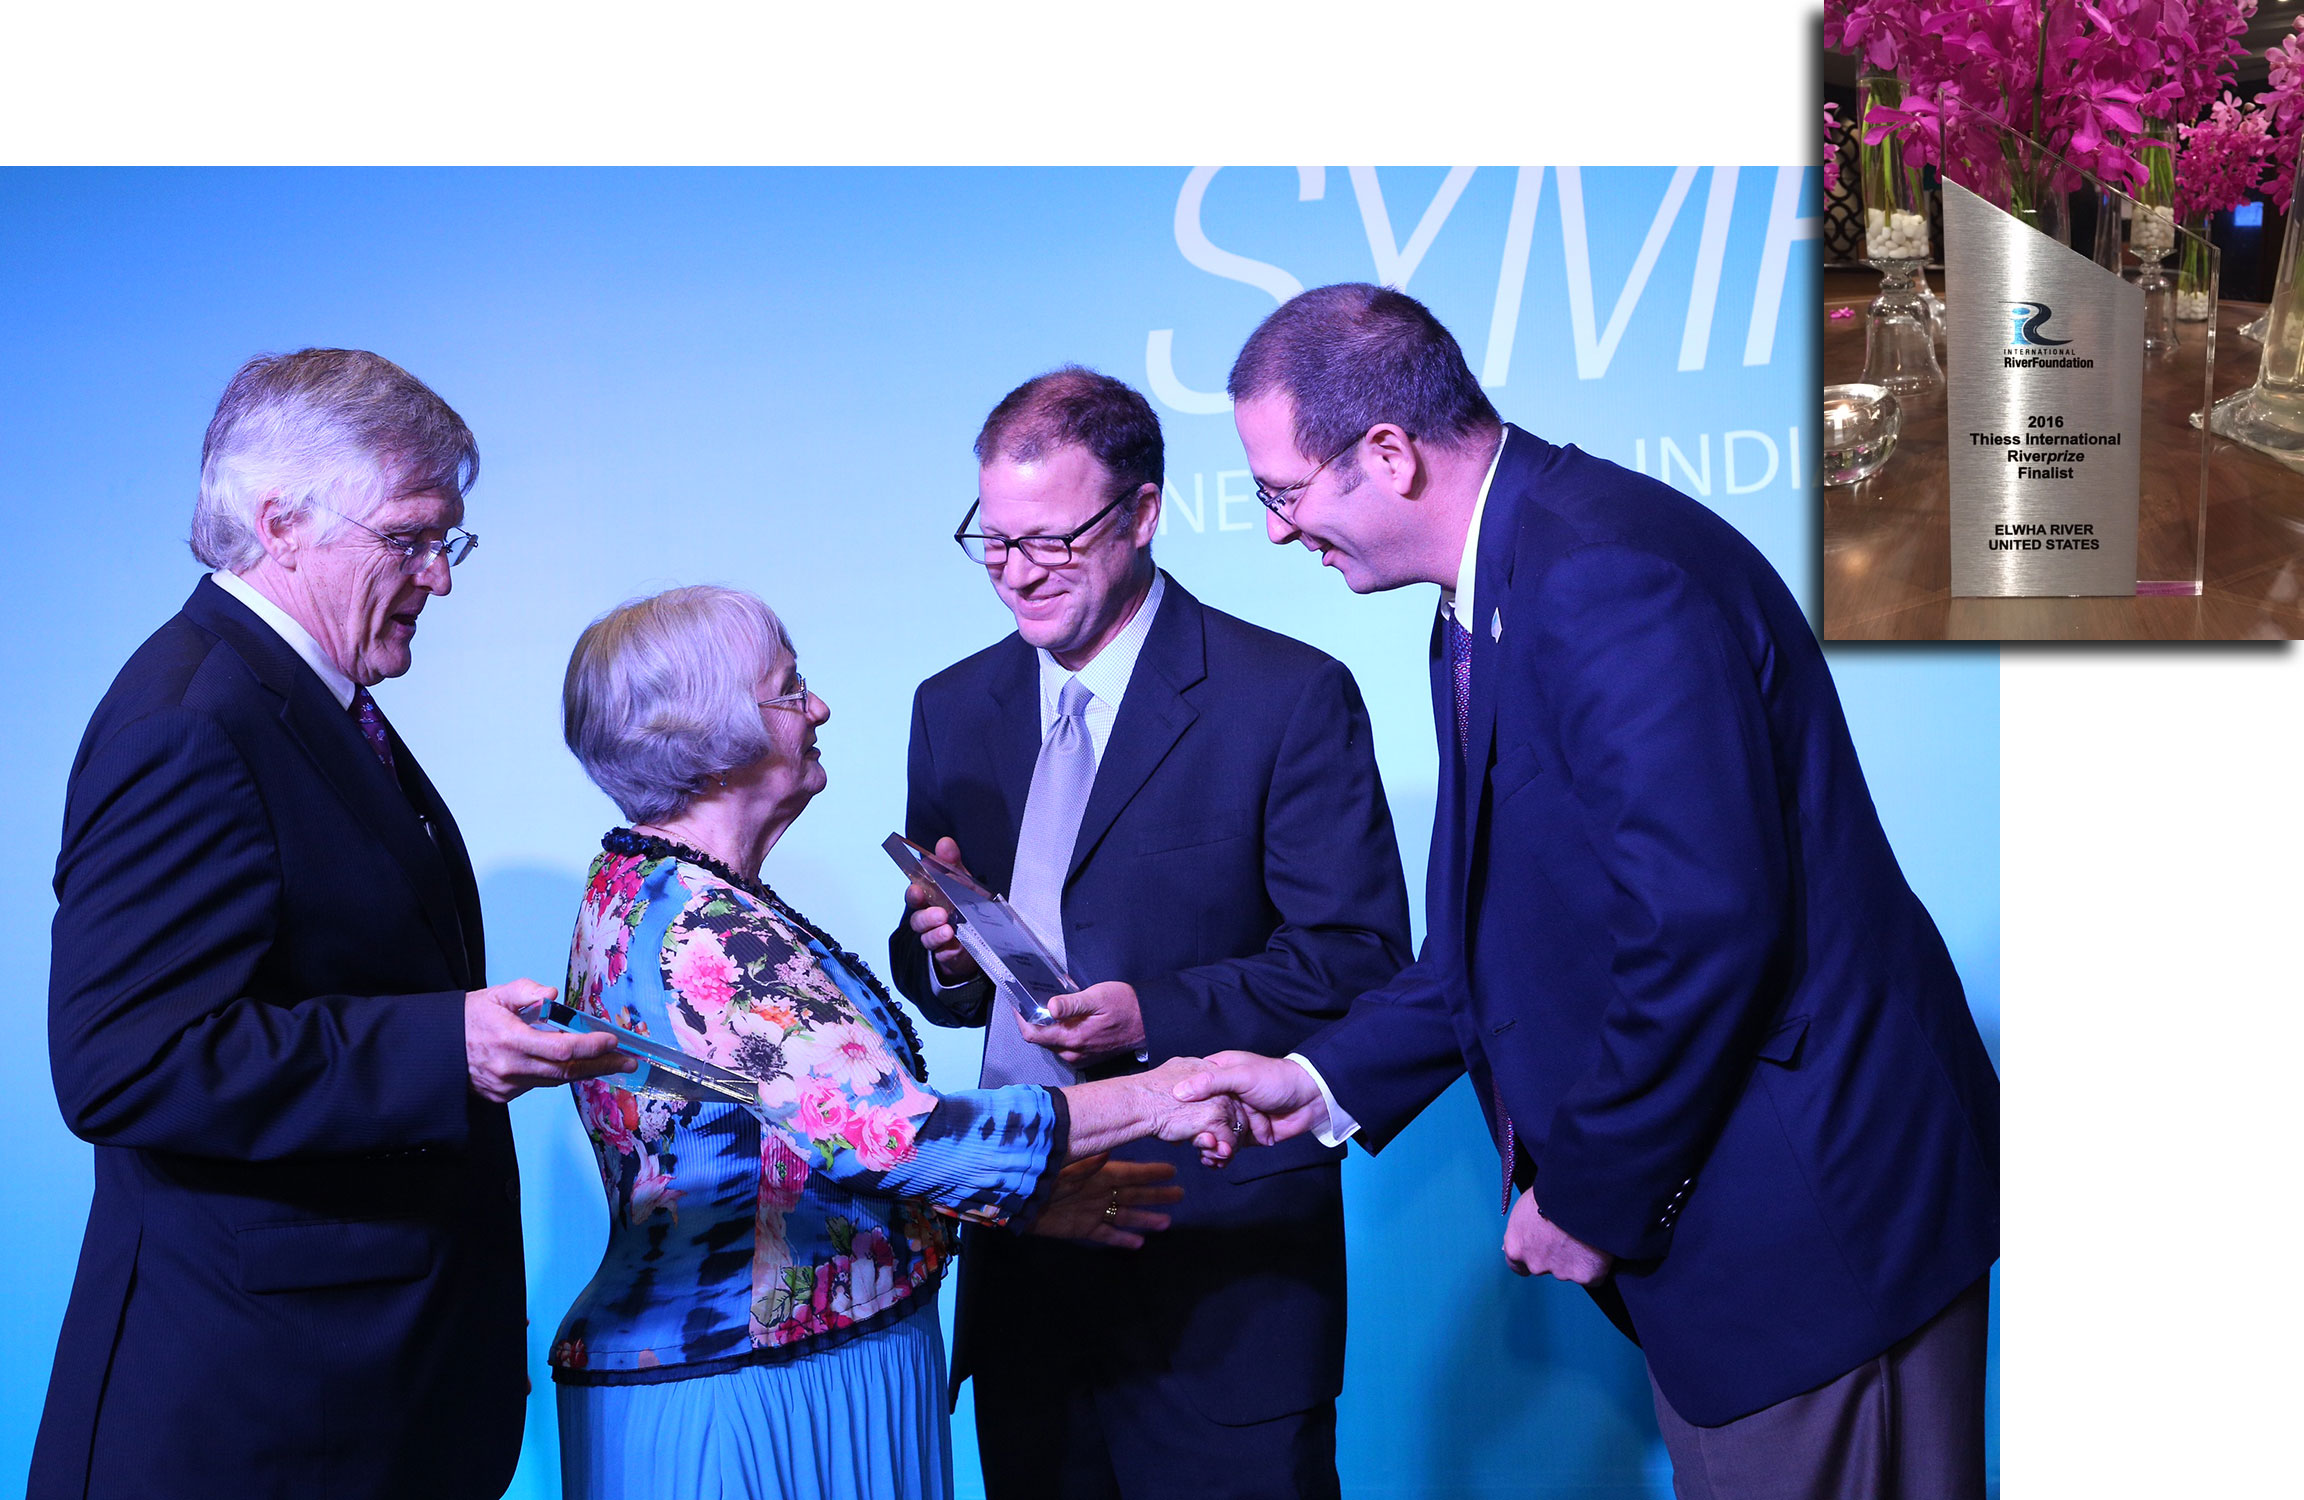
USGS scientists Jonathan Warrick and Jeff Duda receiving Riverprize recognition in New Delhi, India. Inset: Plaque recognizing the Elwha River Restoration Project as one of three finalists for the 2016 Thiess International Riverprize. Images courtesy of International Riverfoundation. [Larger version]
Collaborative work by the U.S. Department of the Interior and the Lower Elwha Klallam Tribe to restore the Elwha River of Washington, USA, was honored during the awarding of the 2016 Thiess International Riverprize. The International RiverFoundation awards the Riverprize annually to support premier examples of river-restoration management. Research geologist Jonathan Warrick (USGS Pacific Coastal and Marine Science Center) and research ecologist Jeff Duda (USGS Western Fisheries Research Center) represented DOI at the 2016 awards ceremony, held September 14 at the 19th International River Symposium in New Delhi, India. The Elwha River Restoration Project was recognized for its unprecedented approach to restoring salmon populations and other ecosystem elements through the largest dam removal project in history. The three finalists were the Segura River of Spain, and the Niagara and Elwha Rivers of the USA. The Buffalo Niagara Riverkeeper project won the Riverprize.
For more information, read the USGS News Release, or contact Jonathan Warrick, [email protected], 831-460-7569.
Visit the USGS Science to Support the Elwha River Restoration Project web site.

Left to right: Curt Storlazzi, Peter Swarzenski, and Christina Kellogg during a 2015 survey of the field area in Kauai, to which Storlazzi and Kellogg returned for more concentrated work in summer 2016. Photo by Amy West, USGS. [Larger version]
Newspaper and radio reporters in Kauai, Hawaiʻi, interviewed USGS researchers on possible causes of a black band coral disease outbreak on the island’s north shore. In an article in the Garden Island newspaper, research geologist Curt Storlazzi of the Pacific Coastal and Marine Science Center explained that fresh groundwater entering the ocean from seafloor seeps could stress nearby corals. He led a USGS team July 29–August 5 to gather evidence for submarine groundwater discharge, collect water samples to test for nutrients and contaminants, and measure currents to determine how they might concentrate or disperse groundwater after it enters the ocean. Storlazzi’s collaborator Chris Kellogg, research microbiologist with the St. Petersburg Coastal and Marine Science Center, spoke about the black band work on Hawaii Public Radio. Contact: Curt Storlazzi, [email protected], 831-460-7521.
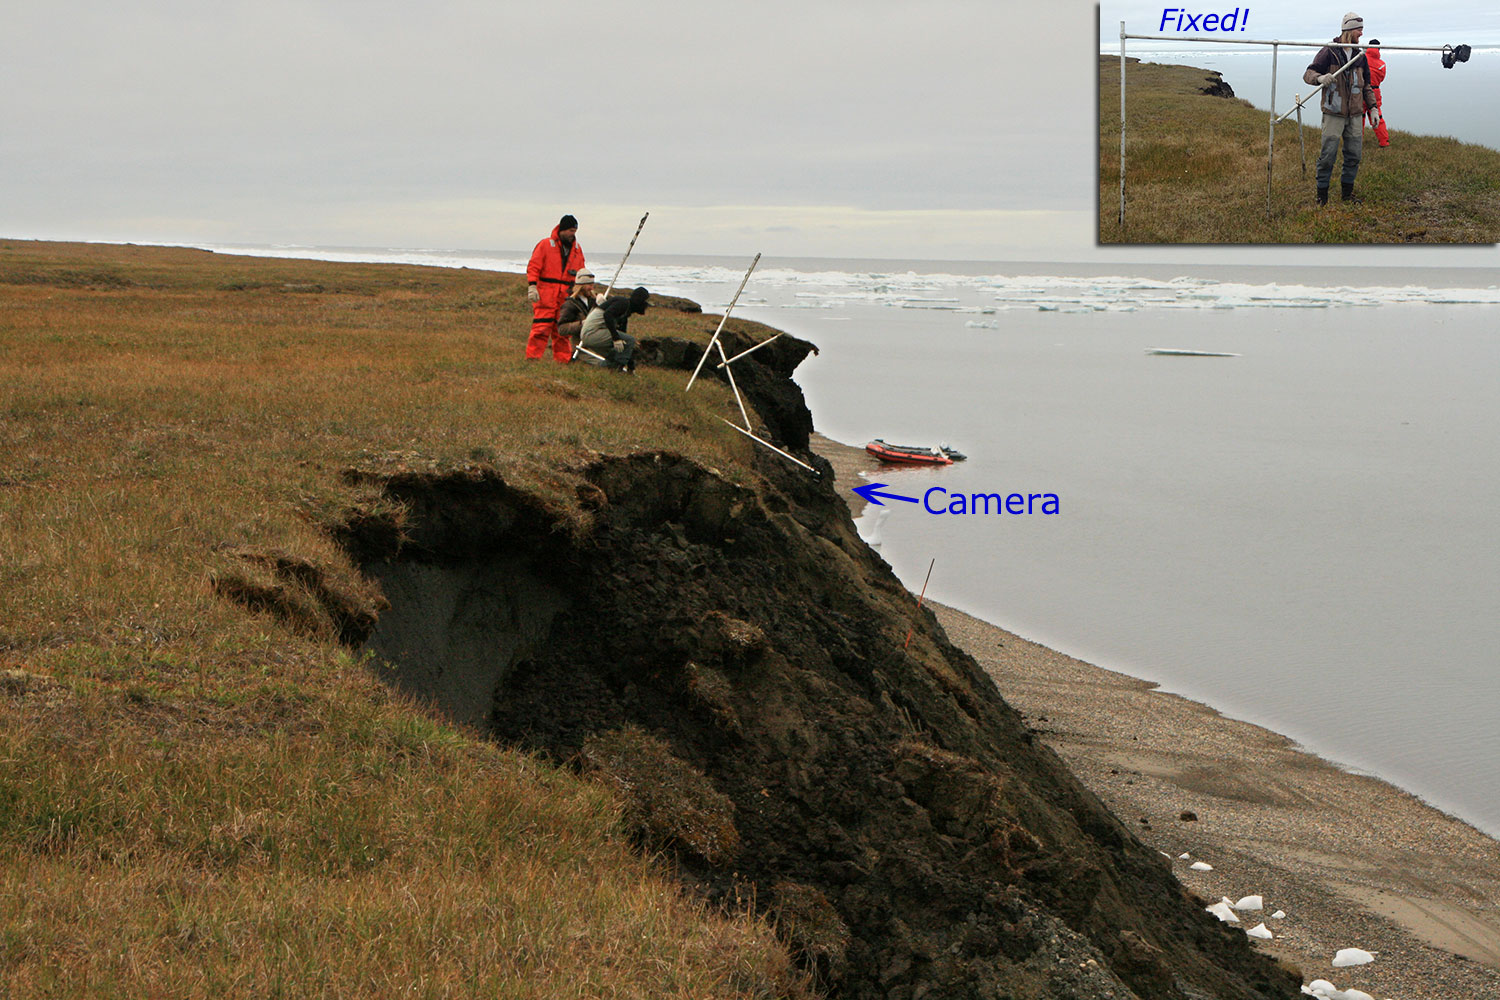
Craig Crutchfield (Office of Budget and Management, left), Will Wiese (Arctic refuge biologist, Fish and Wildlife Service), and Arctic Refuge volunteer Justine Heseltine recover a USGS erosion-monitoring camera west of Kaktovik. [Larger version]
Brian Glaspell, refuge manager of the Arctic National Wildlife Refuge (U.S. Fish and Wildlife Service), requested information about USGS work on Barter Island, Alaska, from scientists at the Pacific Coastal and Marine Science Center (PCMSC). In early August, Glaspell led members from the Department of the Interior and the Office of Management and Budget around the village of Kaktovik to discuss coastal erosion in the Arctic and building resilience in rural Alaskan communities. During the land and sea tour, the group saw chunks of ice and earth collapsing from coastal bluffs and recovered a fallen USGS time-lapse camera. Just a year before with Glaspell on Barter Island, USGS PCMSC scientist Bruce Richmond described the science of coastal erosion along the North Slope to U.S. Senators Tim Kaine (VA) and Martin Heinrich (NM), along with FWS Director Dan Ashe.
Contact: Bruce Richmond [email protected], 831-460-7531.
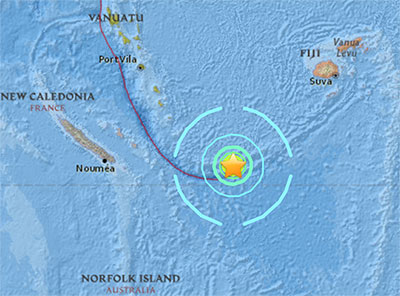
Epicenter (star) of magnitude 7.2 earthquake that generated a small tsunami in the southwest Pacific Ocean on August 12, 2016. Learn more.
Rowena Lindsay of the Christian Science Monitor interviewed research geophysicist Eric Geist of the Pacific Coastal and Marine Science Center on Friday, August 12, about a magnitude 7.2 earthquake that generated a small tsunami when it hit the Pacific Ocean near New Caledonia the previous day. Her article, posted August 12, quotes Geist explaining how undersea earthquakes produce tsunamis. He also observed that the tsunami was larger than expected for a strike-slip earthquake of magnitude 7.2 and noted that a quake-triggered landslide or movement of a steep slope might explain the tsunami's size. Contact: Eric Geist, [email protected], 650-329-5457.

Tim Elfers (USGS) preparing to launch a personal watercraft equipped with GPS and sonar for mapping the bottom close to shore. Photograph by Andrew Stevens, USGS. [Larger version]
In the last two weeks of August 2016, USGS scientists from the Pacific Coastal and Marine Science Center will collect bathymetric (seafloor depth) and topographic (land elevation) data from Washington and Oregon beaches near the mouth of the Columbia River. The data will help them document the effect of the recent El Niño on Pacific Northwest beaches as well as monitor long-term coastal changes. One goal of monitoring is to determine whether sediment dredged from the river's navigation channel and placed on the seabed is helping to counter beach and jetty erosion. The USGS is working closely with the states of Washington and Oregon, the U.S. Army Corps of Engineers, and Oregon State University to provide decision makers with the best available scientific information on sediment management.
Contact: Guy Gelfenbaum, [email protected], 831-460-7417.

View north toward the Fairweather Range during 2015 mapping of the Queen Charlotte-Fairweather fault off Glacier Bay National Park and Preserve. The fault is directly beneath the vessel. Fieldwork in 2016 will extend mapping southeast to near the U.S.-Canada border. Photo by Danny Brothers, USGS. [Larger version]
Scientists from the Pacific Coastal and Marine Science Center are mapping shallow sediment layers along the Queen Charlotte-Fairweather fault offshore southeast Alaska from August 8-24 (see more details on the Field Activity page). The seaward side of this major earthquake fault moves northwest relative to the landward side at an average rate of about 2 inches per year. This fast slip rate provides a rare opportunity to document deformation caused by individual earthquakes, and examine fault evolution in areas that have generated large historical earthquakes. In May and June, USGS scientists mapped approximately 200 miles of the seafloor along the fault for the first time. They used data from that survey to choose targets for the current survey.
Contact: Danny Brothers, [email protected]; or Bob Rosenbauer, [email protected], 831-460-7401.

Dan Ebuna (University of California, Santa Cruz; left) and Jackson Currie (USGS) work on research vessel Norseman amid thick fog on Resurrection Bay. They are preparing equipment that will be towed behind the vessel to image sediment layers beneath the seafloor. [Larger version]
Scientists from the Pacific Coastal and Marine Science Center were testing equipment in Resurrection Bay, Alaska, on August 8 when their research vessel received a distress signal from a small boat about 3 miles away. The privately owned R/V Norseman steamed to the location and found three people stranded on a rocky beach after capsizing a skiff in the surf. Three Norseman crewmembers deployed a rubber raft to rescue the boaters. Due to the large swells, one of the crew swam to the beach and pulled the victims to the raft one by one in survival suits. Soon the boaters were aboard Norseman, wrapped in blankets and drinking hot coffee. After dropping the boaters off in Seward, the scientists departed for their two-week cruise to map a major earthquake fault off southeast Alaska. Learn more about the USGS research cruise.
Contact: Danny Brothers, [email protected]; or Bob Rosenbauer, [email protected], 831-460-7401.
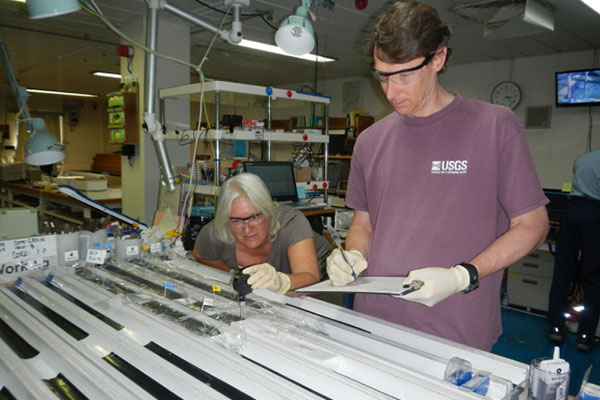
USGS Scientists Dr. Pamela Swarzenski (left) and Dr. William Waite making measurements on sediment cores recovered from Indian Ocean during the National Gas Hydrate Program Expedition 02.
USGS scientists from the Central Energy Resources Science Center, the Woods Hole Science Center, and the Pacific Coastal and Marine Science Center assisted the Government of India in the discovery of large, highly enriched accumulations of natural gas hydrate in the Bay of Bengal. This is the first discovery of its kind in the Indian Ocean that has the potential to be producible. Natural gas hydrates are a naturally occurring, ice-like combination of natural gas and water found in the world’s oceans and polar regions. The amount of gas within the world’s gas hydrate accumulations is estimated to greatly exceed the volume of all known conventional gas resources. Contact: Bob Rosenbauer, [email protected], 831-460-7401.
Read the entire USGS news release.
Also, read the USGS Energy Resources Program's news page on "Results of the India National Gas Hydrate Program Expedition 02."
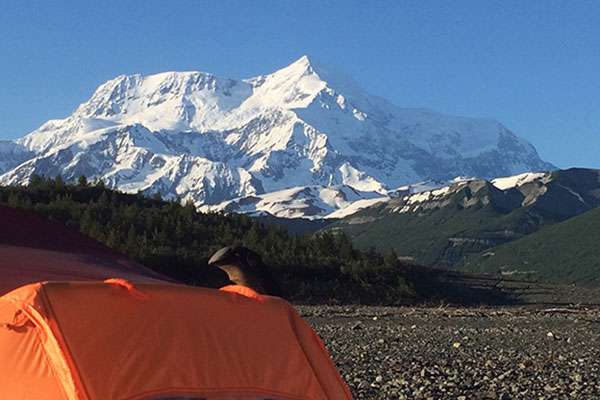
In Icy Bay, Alaska, photograph of Taan Fiord base camp near sea level with the 18,000' Mt. St. Elias in the background. The tent is pitched on one to two meters of 8-month-old tsunami deposits. Much of the barren landscape was former forest.
Southeast Alaska’s 18,000-foot Mount Saint Elias rises behind a USGS tent pitched on sandy gravel left by a tsunami 8 months ago. On October 17, 2015, a rain-soaked mountainside slid into Taan Fiord on Icy Bay, sending a giant wave more than 500 feet up the opposite slope. Large tracts of barren landscape along the fiord margins used to be forest. USGS scientists study recent tsunami deposits to better understand how tsunamis work, recognize ancient tsunami deposits, and improve natural-hazard assessments.
For more information, contact Bruce Richmond, [email protected], 831-460-7407.
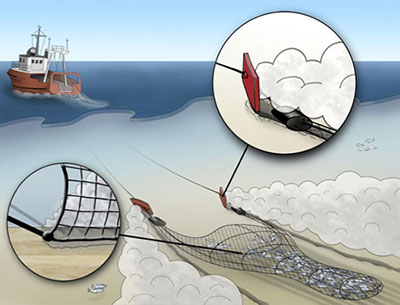
Conceptual drawing of bottom trawling from a fishing boat, showing a net and metal plate being dragged along the seafloor behind a boat on the surface. Image credit: Ferdinand Oberle, 2014.
Recent research outlines the severe consequences that bottom trawling has on loose sediment on the ocean floor. Bottom trawling is a widespread industrial fishing practice that involves dragging heavy nets, large metal doors, and chains over the seafloor to catch fish. Although previous studies have documented the direct impacts of bottom trawling on corals, sponges, fishes, and other animals, an understanding of the global impact of this practice on the seabed remained unclear until now. The first calculation of how much of the seabed is resuspended (or stirred up) by bottom-trawling shows that the sediment mass is approximately the same as the amount of all sediment being deposited on the world’s continental shelves by rivers each year (almost 22 gigatons).
Read the entire Sound Waves newsletter article.
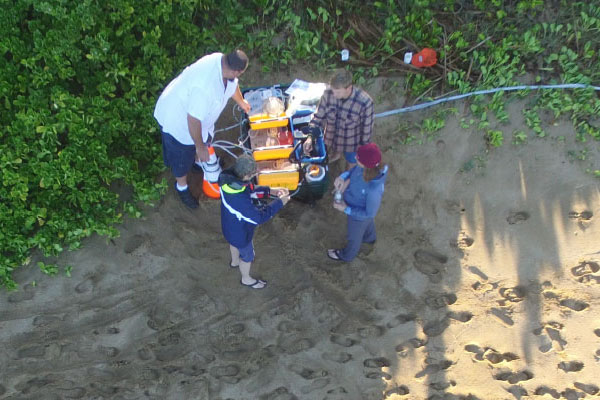
Aerial view (taken by a drone) of the USGS team sampling seawater for carbonate chemistry along the reef of Kāʻanapali, west Maui. Clockwise from left: Nate Smiley, St. Petersburg, Chris Gallagher and Nancy Prouty, Santa Cruz, and Kim Yates, St. Pete. Photo courtesy of a passerby.
USGS scientists focused on understanding the link between land-based pollutants and coral reef health along the coast of west Maui in the Hawaiian Islands. Many reefs in this area are being overgrown by invasive seaweeds, a concern since the late 1980s. The algal growth has been linked to pollutants from the land, including elevated levels of nutrients—such as nitrogen and phosphorus—in water from wastewater injection wells. This nutrient-rich water enters the groundwater system and then discharges into the ocean near the reefs. In 2014, the federal district court in Honolulu ruled that Maui County’s use of injection wells at the Lahaina Wastewater Reclamation Facility violates the federal Clean Water Act and imposed civil penalties for the county’s violations.
Read the entire Sound Waves newsletter article.
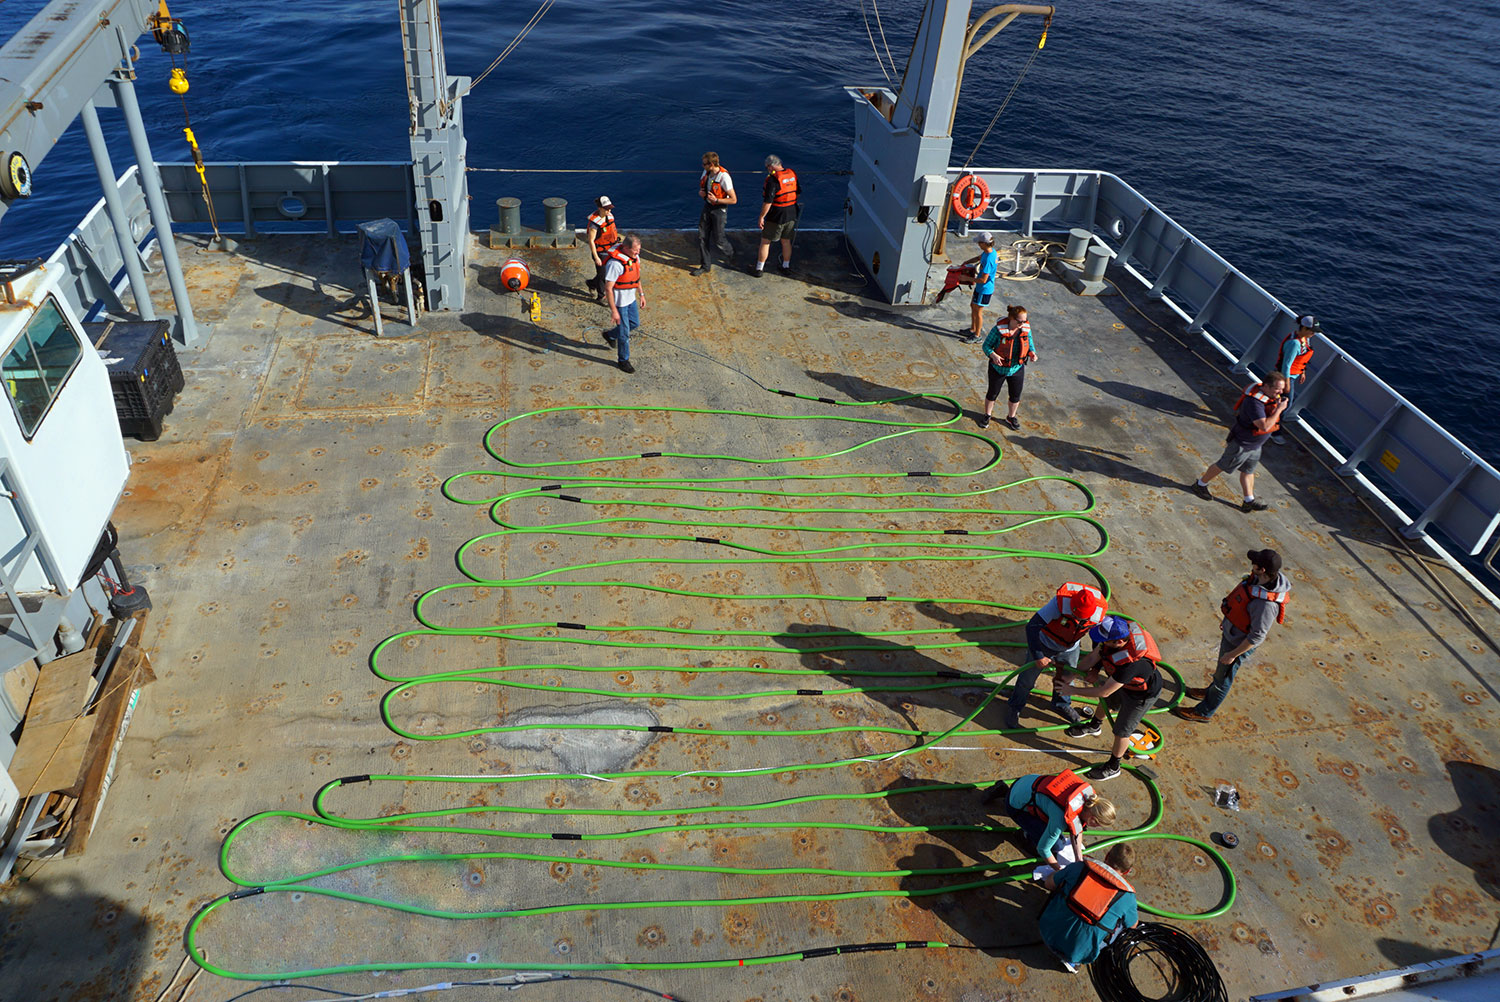
As part of the USGS studies of Los Angeles’ offshore hazards, students from the University of Washington, USGS scientists, and ship’s crew gather on the stern of the research vessel Thompson to haul in the seismic “streamer.” This green cable is full of hydrophones that record the sound generated from a minisparker. These are used together by scientists to help them map layers of sediment and rock beneath the seafloor between Catalina Island and San Clemente Island off Southern California, an area with two active faults. [Larger version]
Offshore earthquakes, undersea landslides, and tsunamis were among the hazards discussed during a USGS briefing for Congressman Adam Schiff’s staff in Southern California on June 9. Other topics included storms, landslides, wildfires, groundwater, volcanoes, onshore earthquakes,and early warning for debris flows. Geologist Jamie Conrad (Pacific Coastal and Marine Science Center) described USGS studies of the offshore hazards, highlighting recent seafloor mapping off Los Angeles, autonomous underwater vehicle (AUV) and remotely operated vehicle (ROV) surveys done with the Monterey Bay Aquarium Research Institute, and findings offshore the San Onofre Nuclear Generating Station. Congressman Schiff represents California’s 28th district in the Los Angeles area. The day-long briefing was held at the USGS Pasadena Office.
For more information, contact Jamie Conrad, [email protected], 831-460-7407.
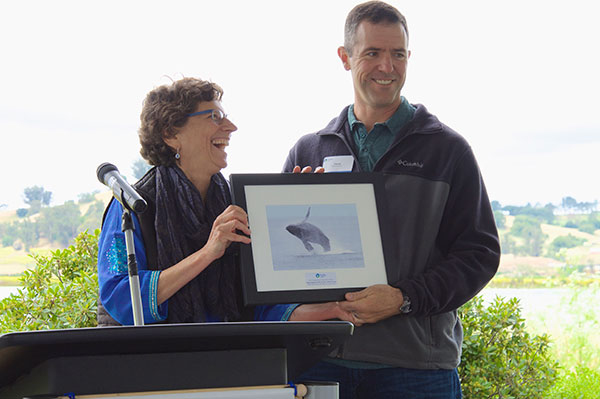
USGS Research Geologist Patrick Barnard accepting the award for the 2016 Outstanding Conservation Partner from Point Blue Conservation Science's President and CEO, Ellie Cohen, in Petaluma, CA, at the NGO's annual meeting.
Photo credit: Cathy Summa-Wolfe Photography
The USGS CoSMoS (Coastal Storm Modeling System) team has won the 2016 Point Blue Outstanding Partner Award from Point Blue Conservation Science. CoSMoS makes detailed predictions about coastal flooding due to both sea-level rise and storms driven by climate change. Thanks to a 7-year partnership with Point Blue, CoSMoS-based interactive flood maps for the San Francisco Bay region are available at Our Coast Our Future to aid resource and land-use managers planning for sea-level rise and storms. CoSMoS has been applied along additional stretches of the California coast in southern and northern California. The USGS CoSMoS team received the award at the Point Blue Annual Meeting on May 22 at Point Blue offices in Petaluma, California.
For more information, contact Patrick Barnard, [email protected], 831-460-7556.
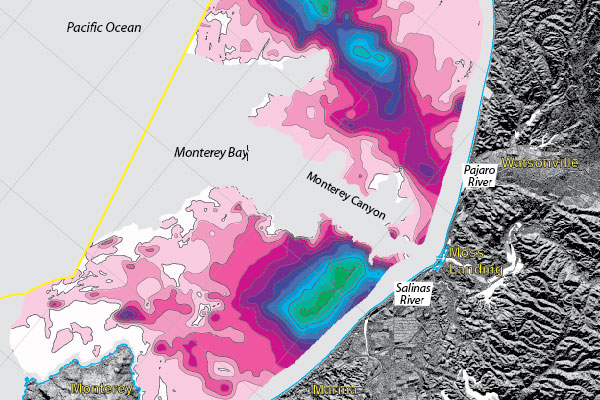
Map of unconsolidated sediment thickness in Monterey Bay, excluding Monterey Canyon: There is a very large sediment deposit at the mouth of the Salinas River (blue and green colors), but otherwise the inner continental shelf is mostly underlain by bedrock (white) or has only a thin sediment cover (pink). The thickness of offshore sediment is an important factor in understanding and forecasting coastal erosion in this area, and in devising strategies for dealing with sea-level rise. Excerpt from USGS California State Waters Map Series — Offshore of Monterey Map Area, Sheet 9.
On May 31, 2016, scientists from the Pacific Coastal and Marine Science Center in Santa Cruz, California, spent two hours briefing Congressman Sam Farr (U.S. Representative for California central coast) on the center’s seafloor mapping and coastal-change-hazard studies. Congressman Farr requested a briefing after reading the USGS news release about newly published maps of the Monterey Bay seafloor. The briefing took place at the Monterey Bay National Marine Sanctuary (MBNMS) Main Office in Monterey, California. Bill Douros, Regional Director of West Coast Sanctuaries, and some MBNMS staff also attended.
Contact: Bob Rosenbauer, [email protected], 831-460-7401.
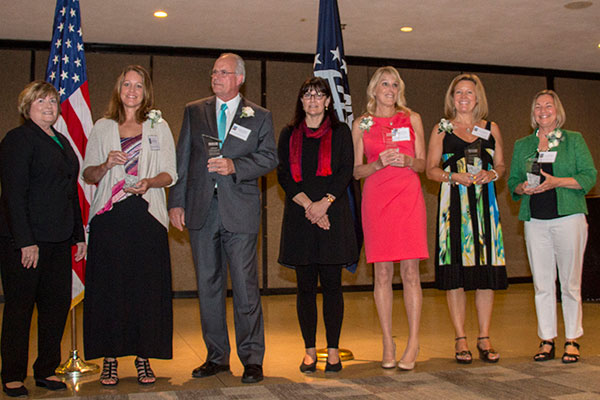
USGS Director Suzette Kimball and Kerry Rae, Chief of Staff from the USGS Office of the Assistant Secretary for Water and Science, with the CMGP web team members at the USGS Awards Ceremony in Reston, Virginia, on May 3rd, 2016. From left: Ms. Kimball, Jolene Gittens, Greg Miller, Ms. Rae, Andrea Toran, Laura Torresan, and Ann Tihansky.
The USGS Coastal and Marine Geology Program (CMGP) website, developed by Jolene Gittens, Greg Miller, Andrea Toran, Laura Torresan, and Ann Tihansky, won the Shoemaker Award for Communication Excellence in the internet product category.
The website content is designed to reach diverse internal and external audiences, who are curious about changes to the ocean and coasts. The site improves access to both current and historical coastal and ocean research information, including research projects, laboratory and technical capabilities, field activities, data, publications, news, outreach activities, and personnel information. The site allows users to browse research by theme or topic, as well as search by key words.
The website is a holistic presentation of USGS coastal and ocean science, and represents a successful collaboration of effort among the three science centers within CMGP. CMGP offices are located in Santa Cruz, California, St. Petersburg, Florida, and Woods Hole, Massachusetts.
Visit the site at http://marine.usgs.gov.
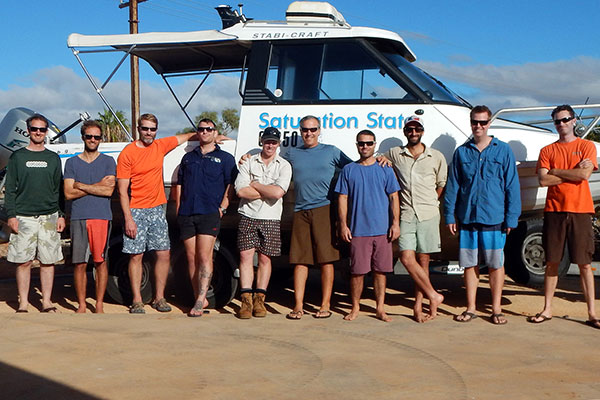 Collaborative Study in the Ningaloo Reef
USGS Researchers from the Pacific Coastal and Marine Science Center in Santa Cruz, California, have just completed a collaborative effort with the University of Western Australia, at Jurabi in the Ningaloo UNESCO World Heritage Site in Western Australia. This was the largest, most intensive study of coral reef hydrodynamics, ever!
To lern more about this collaborative work, watch the video titled, “Breaking Down Reefs, Building Up Beaches”
Contact: Curt Storlazzi.
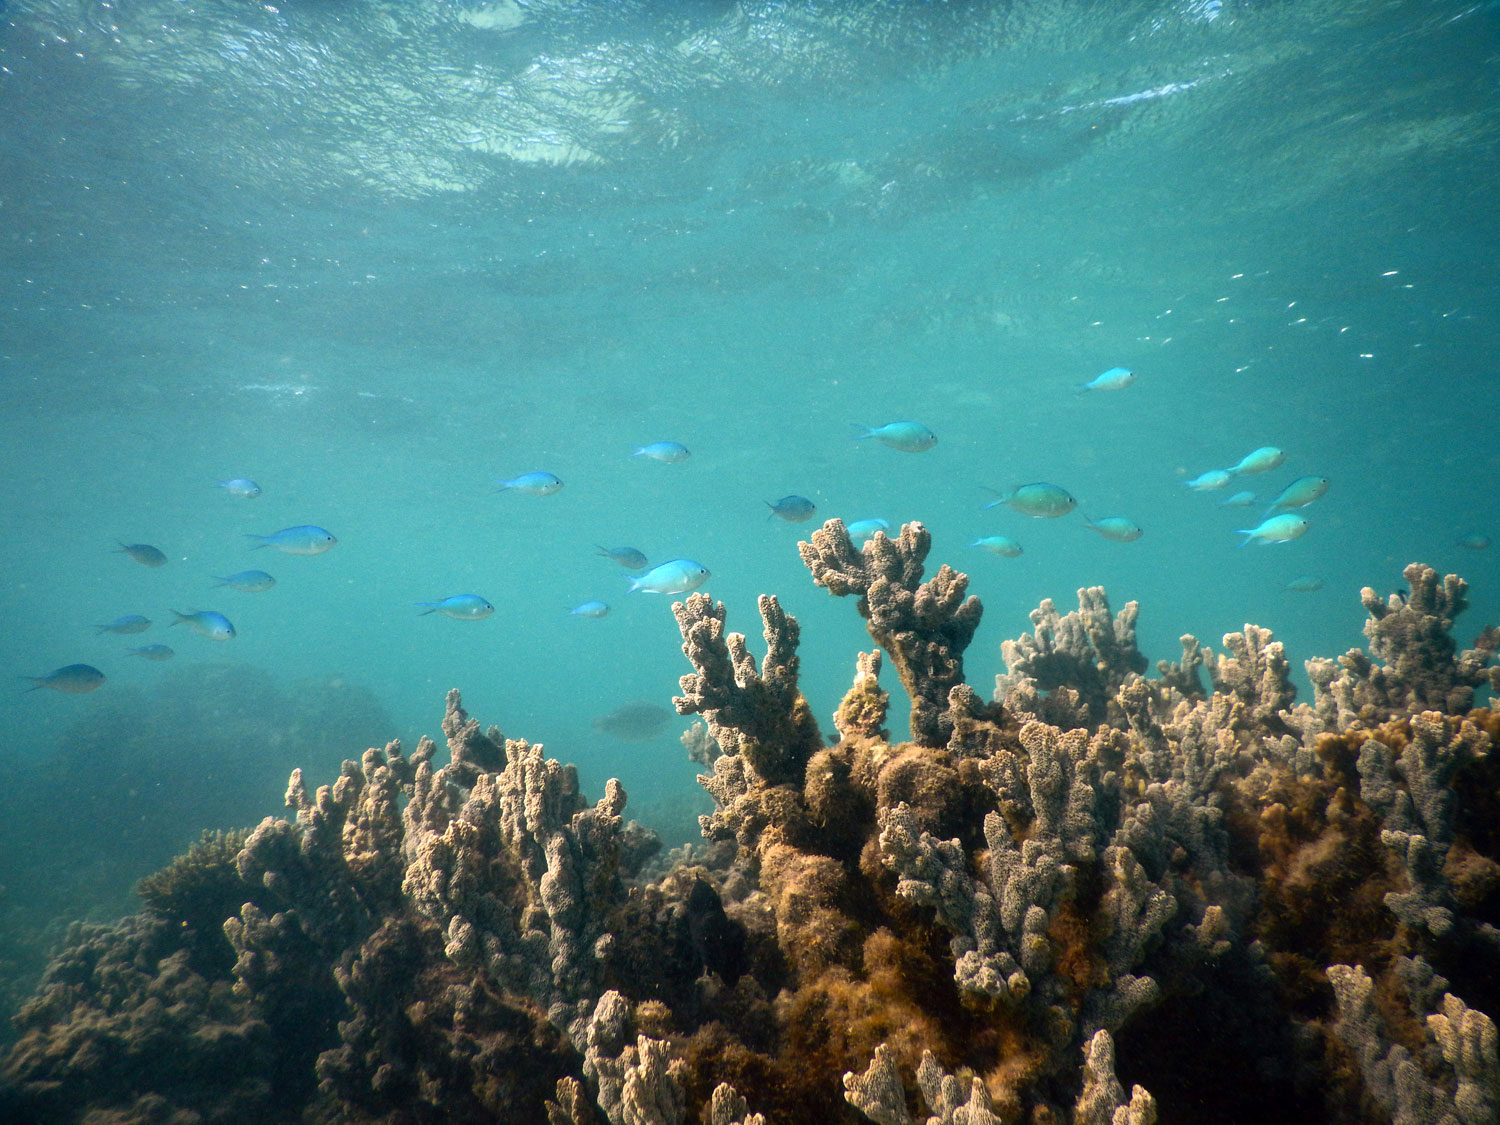

View across the San Lorenzo River eastward of the winter beach of the Santa Cruz Beach Boardwalk amusement park in Santa Cruz, California, January 7, 2016. Photo by Andy O'Neill, USGS. [Larger version]
USGS oceanographer and meteorologist Andy O’Neill was quoted in a Monterey Herald article about the 2016 Monterey Bay Economic Partnership Regional Economic Summit held April 26. O’Neill represented the USGS in an exhibit area where she spoke with attendees about how shifting beaches and rising sea level can affect certain sectors of the local economy. She explained that USGS data can be used to help plan for future contingencies.
Contact: Andy O’Neill, [email protected], 831-460-7586.
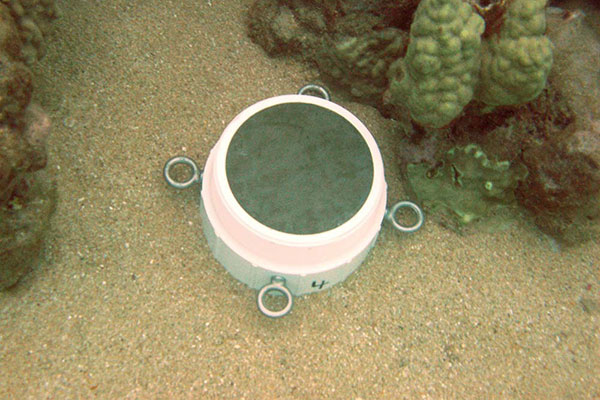
SedPods, like this one at Kawaihae, Big Island, Hawaiʻi, are low-cost collection devices that mimic coral surfaces and permit accurate measurements of net sediment accumulation during the time they are on the seafloor. Photo by Curt Storlazzi, USGS.
Pollution that stems from actions on land, such as coastal development and agricultural runoff, can harm the health of coral reefs. That’s why the U.S. Coral Reef Task Force (USCRTF), of which the USGS is a co-science lead, established a Watershed Partnership Initiative in 2009. Now the USCRTF Watershed Partnership Initiative has published two new tools to help coastal resource managers reduce the impacts of land-based pollution on coral reefs. The first is a set of indicators and measurements for assessing coral community health, water quality, and sediment. USGS scientists developed the methods for monitoring sediment impacts. The second tool is a checklist to help watershed coordinators implement a successful watershed management plan. Learn more.
Contact: Curt Storlazzi.
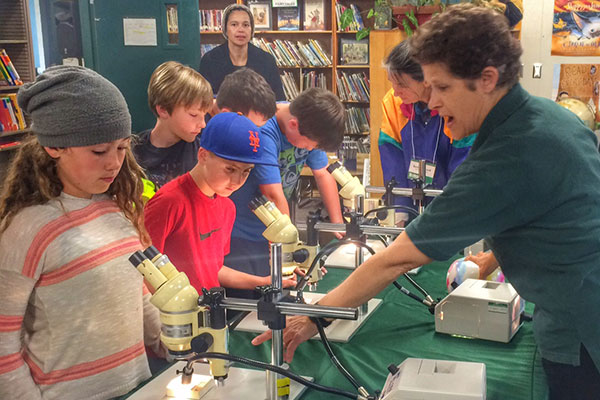
USGS researcher Mary McGann (right) instructs students on how to use the microscopes to view the shells of one-celled sea creatures called foraminifera.
A team from the USGS intrigued students at Mountain Elementary School in Soquel, California, with hands-on activities during the school’s April 22 Earth Day Celebration. First through fifth graders looked through microscopes to view the shells of one-celled sea creatures called foraminifera. The shells can tell scientists the age of the sediment in which forams are found, the ocean depths at which they lived, and what the seawater chemistry was like when they built their shells. Many students had never used a microscope and were astonished by the magnified views. The students learned topography by assembling clear plastic trays showing individual contour lines of Angel Island and Monterey Canyon. They also examined the stinky stomach contents regurgitated by albatrosses to see which of the undigested components are natural, like squid beaks, and which are unnatural, like toothbrushes, disposable lighters, and other plastic trash.
Contact: Helen Gibbons.
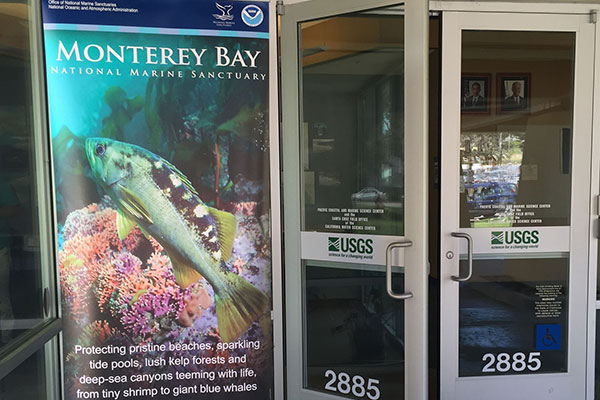
Banner of the Monterey Bay National Marine Sanctuary at the entrance to the USGS Pacific Coastal and Marine Science Center. Photo by Rex Sanders, USGS.
The Pacific Coastal and Marine Science Center in Santa Cruz, California, hosted a meeting of NOAA’s Monterey Bay National Marine Sanctuary Advisory Council on April 21, 2016. The advisory council, established by Federal law, assures continued public participation in the management of the sanctuary. The council meets bi-monthly in open sessions located throughout the almost 300-mile boundary of the Sanctuary. USGS is not a member of the advisory council, but works closely with the Sanctuary on many issues.
Contact: Helen Gibbons.
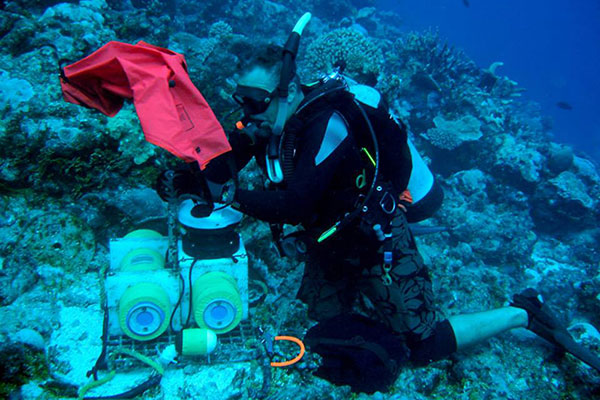
USGS oceanographer deploying an oceanographic instrument package in a patch of rubble on the coral reef off Roi-Namur Island, Kwajalein Atoll, in the Republic of the Marshall Islands.
In a recent report, the U.S. Geological Survey (USGS) took first place for science research credibility among ocean resource managers and interest group leaders. The study authors asked several hundred people to rank the research reputations of 12 government agencies and organization types on “marine resource management and environmental policy issues.” USGS also took second place overall (behind public research universities) for scientific research credibility. The article, published in Ocean & Coastal Management, analyzed 570 surveys returned by scientists, managers, and interest group leaders. The study also found that the top three indicators of credible scientists were “quality of the methodology used in their scientific research,” “scientific data and information they generate in their research,” and “experience and knowledge of the management of marine resources.” USGS has a long history of high-quality research methods and data sharing, combined with experienced and knowledgeable ocean research staff.
Contact: Rex Sanders.
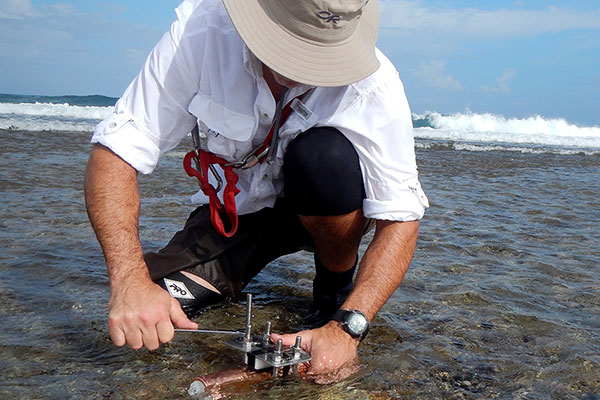
USGS oceanographer Curt Storlazzi deploying an oceanographic instrument package on the reef flat off Roi-Namur Island, Kwajalein Atoll, in the Republic of the Marshall Islands (RMI).
On the morning of May 3, 2016, USGS oceanographer Curt Storlazzi (Pacific Coastal and Marine Science Center) briefed the Department of Defense on coral reefs and climate change in the Pacific Ocean. That afternoon, he briefed the Department of the Interior and its Office of Insular Affairs. Storlazzi leads the USGS Pacific Coral Reefs project. Recent results show that climate change may reduce the ability of coral reefs to protect tropical islands against wave attack, erosion, and salinization of drinking-water resources (read the article). Storlazzi’s briefings described these and other findings, including the likely impacts of sea-level rise and climate change on Pacific atolls.
Contact: Curt Storlazzi.
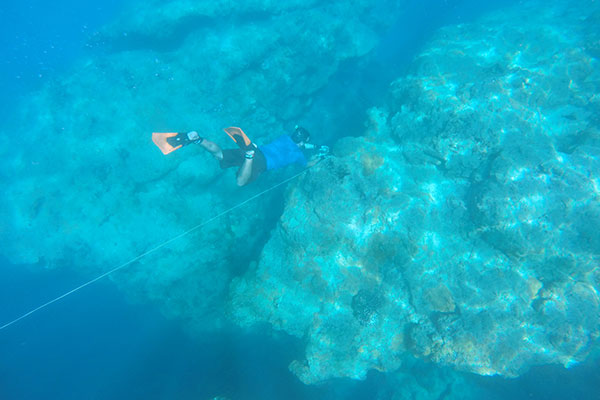
Curt Storlazzi free dives to attach a temperature sensor along the reefs in Kauai. USGS wants to understand the local oceanography when investigating why disease has struck Kauai’s corals.
A new video, “Exploring Causes of Coral Disease,” follows USGS researchers as they investigate potential causes of black band disease affecting corals on the Hawaiian island of Kauai. In spring 2015, scientists from the Pacific Coastal and Marine Science Center (Santa Cruz, California) and the St. Petersburg Coastal and Marine Science Center (St. Petersburg, Florida) ran initial surveys to check water temperature, salinity, and whether water running off the land may be affecting coral health. An expanded team will return this summer for more in-depth work. Healthy reefs protect the shore from wave damage, provide shelter for important fish species, and are vital to tourism.
For more information, contact Curt Storlazzi, [email protected], 831-460-7521; or Chris Kellogg, [email protected], 727-502-8128.
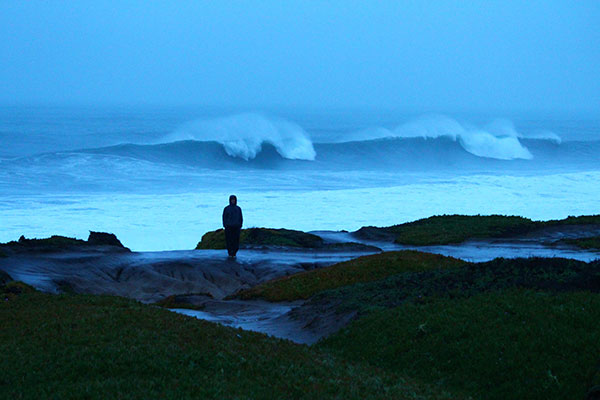
Photograph of the San Mateo County coastline on January 17, 2016, during a very high tide and storm event; photo by Laura Zink Torresan.
USGS research geologist Patrick Barnard (Pacific Coastal and Marine Science Center) was interviewed on April 5, 2016, by reporter Carina Woudenberg of the Half Moon Bay Review for a story about coastal erosion. Woudenberg’s article, “The Crumbling Coastside”, includes quotes from Barnard on rising coastal erosion rates in San Mateo County and factors that make the county’s coastline the most rapidly eroding section in California.
For more information, contact Patrick Barnard, [email protected], 831-460-7556.
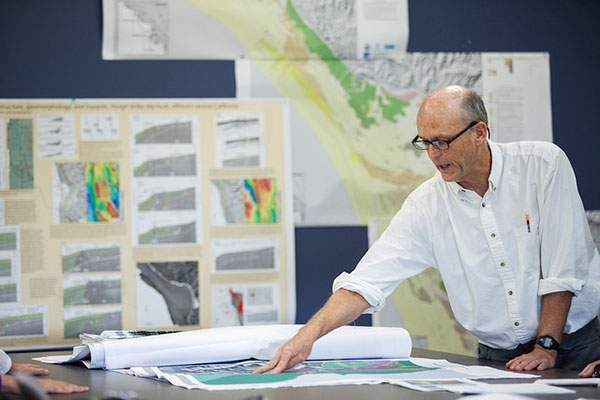
Geophysicist Samuel Johnson checks out the new maps at the USGS Marine Geology Mapping center, Thursday, June 11, 2015, in Santa Cruz, California.
New seafloor maps from Monterey Bay north to Pigeon Point are the subject of a front-page article in the Santa Cruz Sentinel published April 9, 2016. The latest maps released by the California Seafloor Mapping Program reveal complex details of the ocean floor, including new seafloor faults and unexpected patches of bare bedrock. The short faults could be sources of small earthquakes, and the bare patches suggest that the region has less offshore sand than previously thought for replenishing sand eroded from beaches. Read the article, and learn more about the maps in a USGS news release.
For more information, contact Sam Johnson, [email protected], 831-460-7546.
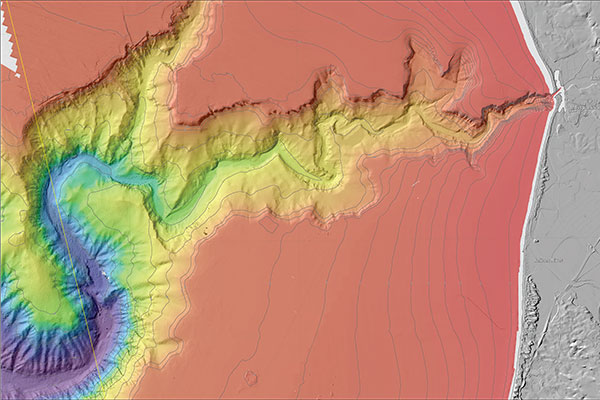
Bathymetry of Monterey Canyon and the Soquel Canyon tributary: Monterey Canyon is one of the largest and deepest submarine canyons in the world, reaching depths of 1,520 m (5,000 ft) at the State Waters boundary. Upwelling through the canyon provides nutrients for the highly productive marine ecosystem of Monterey Bay. Excerpt from USGS California State Waters Map Series—Monterey Canyon and Vicinity Map Area, Sheet 1.
March 29th, 2016
Six new sets of maps reveal the diverse and complex range of seafloor habitats along 130 kilometers (80 miles) of the central California coast from the Monterey Peninsula north to Pigeon Point. The publicly available maps can be used by a large stakeholder community to understand and manage California’s vast and valuable marine resources.
Read the rest of the USGS Newsroom State/Local News Release, posted March 29th, 2016.
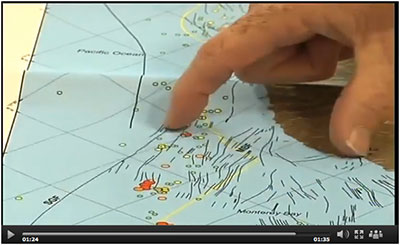
Clip from the KION-TV story video.
KION-TV in Salinas, California, interviewed USGS research geologist Sam Johnson about new California Seafloor Mapping Program (CSMP) maps for the Monterey Bay region. Several maps highlight the San Gregorio fault, which is capable of a magnitude 7 earthquake. CSMP is a cooperative program to create comprehensive coastal and marine bathymetric, geologic, and habitat base maps for all of California’s State Waters. CSMP has released more than 230 map sheets with a digital database, covering 30 percent of the coast, with more maps under development. The 1:35 video is online.
For more information, contact Sam Johnson, [email protected], 831-460-7546.
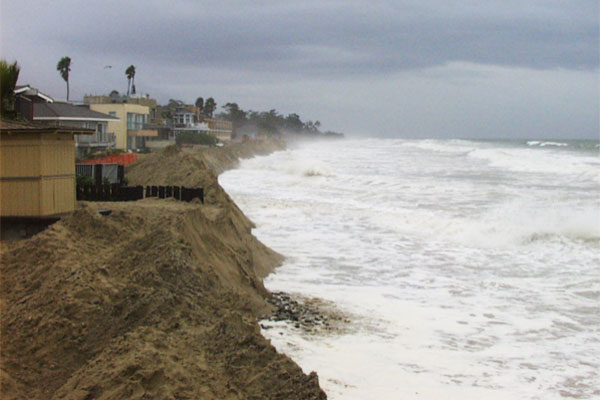
Photo of extreme event threatening erosion of the coast in Carpenteria, CA.
Reporter Aaron Orlowski from the newspaper Orange County Register interviewed USGS scientists Patrick Barnard and Patrick Limber for a potential story on sea level rise in southern California. Barnard leads the Coastal Storm Monitoring System (CoSMoS) project, which predicts coastal flooding and cliff erosion based on climate change forecasts and different storm scenarios. Limber is the project’s expert on cliff erosion. Coastal resource managers in southern California are using CoSMoS forecasts based on zero sea level rise to prepare for El Niño storm damage.
For more information, contact Patrick Barnard, [email protected], 831-460-7556, or Patrick Limber, [email protected], 831-460-7548.
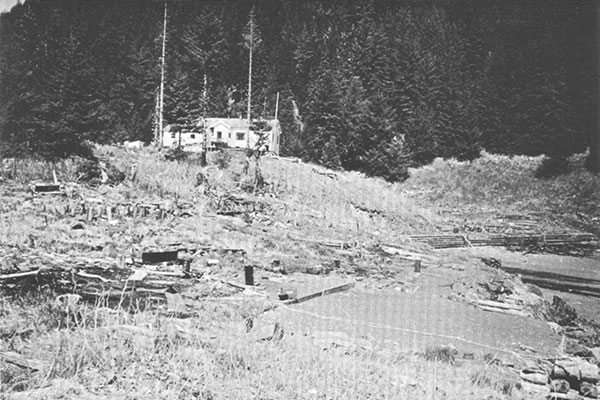
Main part of the Chenega village site in Alaska. Pilings in the ground mark the former locations of homes swept away by tsunami waves. Schoolhouse on high ground was undamaged. Photograph taken 1964.
Minutes after the 1964 magnitude-9.2 Great Alaska Earthquake (see “The Great Alaska Earthquake and Tsunami of March 27, 1964”), a series of tsunami waves swept through the village of Chenega in Prince William Sound, destroying all but two of the buildings and killing 23 of the 75 inhabitants. Fifty years later, detailed seafloor images revealed the likely cause of the tsunami: a large set of underwater landslides. USGS scientists and their colleagues from Boise State University and the Alaska Department of Fish and Game collected the images while mapping the seafloor in May 2014. Their findings, published in January 2016 in the journal Earth and Planetary Science Letters, underscore the tsunami hazard that submarine landslides can pose in fjords around the world where communities and ports are commonly located.
Read the entire Sound Waves newsletter article.
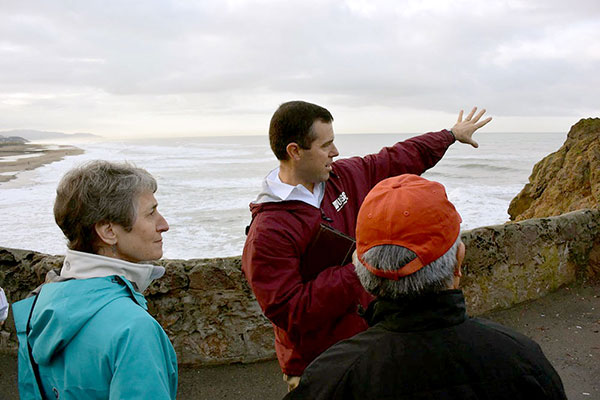
USGS geologist Patrick Barnard tells Secretary of the Interior Sally Jewell and San Francisco Mayor Ed Lee about the coastal hazards facing Ocean Beach. Photo taken December 18, 2014 by Tami Heileman, U.S. Department of the Interior.
Researchers with the USGS Coastal and Marine Geology Program study coastal hazards like beach erosion and cliff collapse at many locations over years and decades. By comparing conditions before, during, and after this year’s very strong El Niño, these scientists hope to improve forecasts of coastal changes during future events.
Read the entire Sound Waves newsletter article.
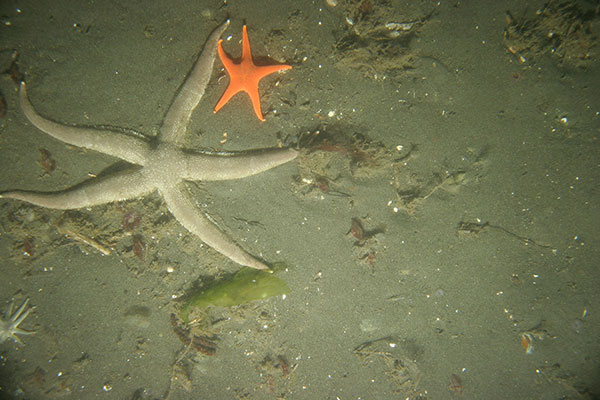
This photograph is of the Puget Sound seafloor and shows a sandy area with partial hydroid and algae cover occupied by sea stars and small filter feeding worms. This image was collected as part of USGS efforts to help with rockfish recovery in the Puget Sound. Scientists are mapping their ecosystem and habitat to understand population distribution.
The USGS has completed the second phase of releasing thousands of photos and videos of the seafloor and coastline through their Coastal and Marine Video and Photography Portal.
Most of these marine and coastal scenes have never been seen before or mapped at this level of detail. A more accurate perspective of these areas helps coastal managers make important decisions that range from protecting habitats to understanding hazards and managing land use.
Read the entire Sound Waves newsletter article.
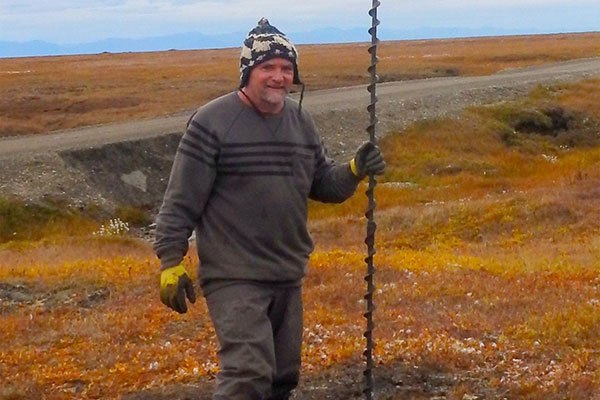
Peter Swarzenski doing fieldwork on Alaska’s Barter Island, summer 2015.
“Atoms for Peace” is the mission of the International Atomic Energy Agency (IAEA), where USGS research oceanographer Peter Swarzenski will take a post as head of the Radioecology Laboratory in Monaco.
Read the entire Sound Waves newsletter article.

USGS scientist uses a personal watercraft fitted with GPS and an echo sounder to survey the seafloor off Santa Cruz, California. Recurring surveys monitor sand movement to improve predictions of coastal change. Photograph taken October 20, 2014, by Andrew Stevens, USGS PCMSC.
Research geologists Patrick Barnard and Jon Warrick and oceanographer Dan Hoover (all from the Pacific Coastal and Marine Science Center) were interviewed for a story about coastal erosion that appeared March 2, 2016, in the Good Times, a weekly paper in Santa Cruz, California. “Living on the Edge” describes ongoing USGS studies of coastal erosion and sand movement along the coast from San Francisco to Monterey. For more information, contact project leads Patrick Barnard ([email protected], 831-460-7556) and Jon Warrick ([email protected], 831-460-7569).
Scientists from the USGS Coastal and Marine Geology program plan to present 36 talks or posters at the 2016 Ocean Sciences Meeting, February 21 to 26, in New Orleans. Presentation topics range from forecasts of vanishing California beaches to marshland carbon sequestration in Chesapeake Bay. The conference, held every two years, is a joint meeting of three scientific societies: American Geophysical Union (http://agu.org), Association for the Sciences of Limnology and Oceanography (http://aslo.org), and The Oceanography Society (http://tos.org).
| Takeaway message | Presentation number, title, and link | Presenters |
|---|---|---|
| Stable wetlands sequester carbon, unstable wetlands lose carbon in Chesapeake Bay | EC14B-0967: Quantifying organic matter fluxes in an era of wetland instability | Neil Ganju |
| Cape Cod salt marshes keep up with sea level rise | EC14B-0976: Carbon Burial in Salt Marshes: Impacts of Sea Level Rise and Marsh Restoration | Meagan Gonneea |
| Healthy seagrass meadows in Maryland could reduce wave action by 40 percent | EC14C-1015: Modeling the Hydrodynamic Effects of Seagrass Meadows in a Shallow, Back-barrier Estuary | Alexis Beudin |
| Southern California beach cliffs could erode much faster as ocean rises | MG14A-1924: Forecasting sea cliff retreat in Southern California using process-based models and artificial neural networks | Patrick Limber |
| USGS researchers to receive NOPP Excellence in Partnering Award | 1:00 - 2:30 PM, Room 223: National Oceanographic Partnership Program--2015 Excellence in Partnering Awards Ceremony | Principal Investigators: Amanda Demopoulos, Cheryl Morrison, Nancy Prouty, Christina Kellogg |
| Rising oceans lead to more big waves washing over Pacific islands | EC23A-02: Wave Transformation over a Fringing Coral Reef and the Importance of Low-Frequency Waves and Offshore Water Levels to Runup and Island Overtopping | Olivia Cheriton |
| One in four Southern California beaches could vanish by 2100 | MG23A-05: Development and Application of a Long-term Shoreline Change Model for Assessing Climate Change Impacts | Sean Vitousek |
| Coral reefs wonÕt protect Pacific islands from sea level rise flooding | EC24C-1121: The influence of corals, coral reef morphology, and climate change on waves and wave-driven water levels along reef-lined coasts | Curt Stolazzi |
| Uneven effects of El Ni–o and climate change on Pacific Ocean coastlines | EC31A-01: Recent Pacific Ocean basin coastal response to inter-annual climate variability with implications for future climate change impacts | Patrick Barnard |
| Artificial dunes in Louisiana vanish quickly but help anyway | MG44B-1992: Morphological controls on barrier-island response and recovery following natural and anthropogenic perturbations, northern Chandeleur Islands, Louisiana | Julie Bernier |
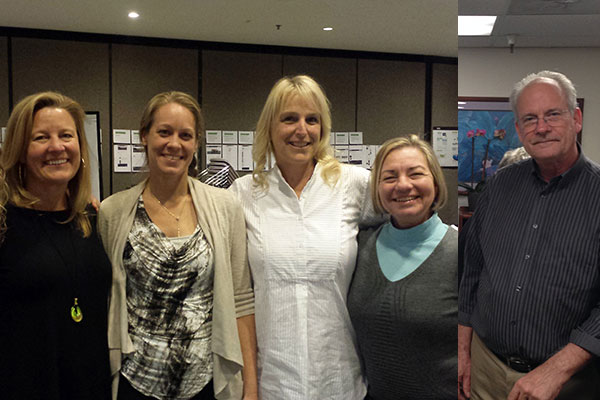
Left to right: CMGP web design team Laura Torresan, Jolene Gittens, Andrea Toran, Ann Tihansky (team lead), and Greg Miller (web developer/programmer).
The USGS Coastal and Marine Geology Program (CMGP) website has won a USGS 2015 Shoemaker Award for Communication Product Excellence in the Internet Product category. This award recognizes products that effectively convey complex scientific concepts to non-science audiences. The re-designed website offers science, data, and news from the three Coastal and Marine Geology Science Centers. The design team — coordinator Ann Tihansky (Coastal and Marine Geology Program), Jolene Gittens (St. Petersburg Coastal and Marine Science Center), Greg Miller (Woods Hole Coastal and Marine Science Center [WHCMSC]), Andrea Toran (WHCMSC), and Laura Torresan (Pacific Coastal and Marine Science Center [PCMSC]) — will be celebrated at the USGS Honor Awards ceremony in Reston, Virginia, on May 3. Laura Torresan also was on the team that won a 1998 Shoemaker Award for what is now the PCMSC web site.
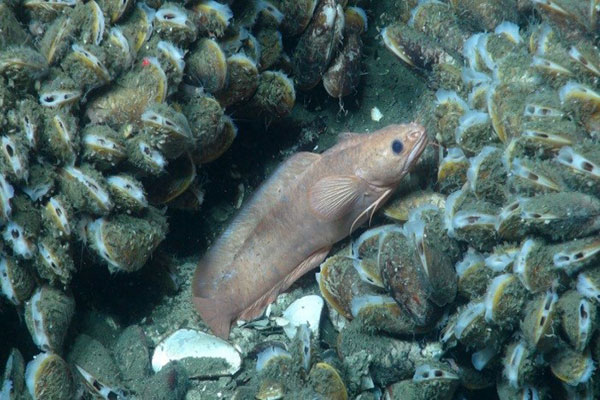
Methanotrophic mussels with rockling fish. Image Credit: Atlantic Canyons: Pathways to the Abyss, BOEM/NOAA OER/USGS.
USGS scientists and collaborators from more than a dozen research institutions will receive the National Oceanographic Partnership Program (NOPP) 2015 Excellence in Partnering Award on February 23, 2016, at the Ocean Sciences Meeting in New Orleans. The award recognizes the research team’s Atlantic Canyons: Pathways to the Abyss project. The team received another major award in January 2014, when Secretary of the Interior Sally Jewell presented them with the DOI Partners in Conservation Award. USGS scientists on the team studied underwater canyon geology, oceanography, ecology, and biology.
For more information, contact principal investigators Amanda Demopoulos (project chief), [email protected], 352-264-3490;
Nancy Prouty, [email protected], 831-460- 7526;
Cheryl Morrison, [email protected], 304-724-4464; or
Christina Kellogg, [email protected], 727-502-8128.
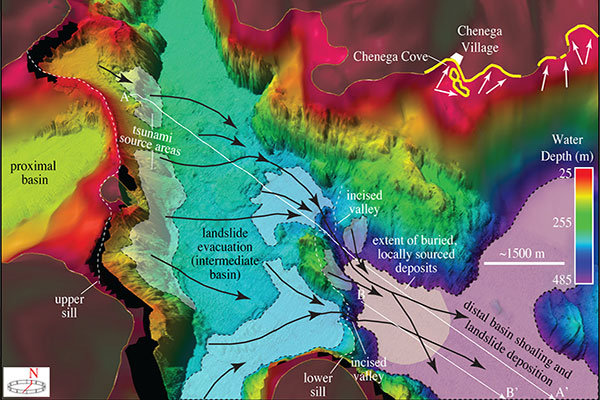
3-D perspective view of shaded relief bathymetry offshore Chenega village. Shaded patches of seafloor depict areas that experienced dramatic changes in water depth between 1957 and 2014. Read more in the USGS Newsroom.
Minutes after the 1964 magnitude-9.2 Great Alaska Earthquake began shaking, a series of tsunami waves swept through the village of Chenega in Prince William Sound, destroying all but two of the buildings and killing 23 of the 75 inhabitants. Fifty years later, scientists from the U.S. Geological Survey revealed the likely cause of the tsunami, a large set of underwater landslides. The scientists used detailed seafloor images not only clear up a decades-old mystery, but also underscore the tsunami hazard that submarine landslides can pose in fjords around the world where communities and ports are commonly located.
Read the entire News Release from February 1, 2016.
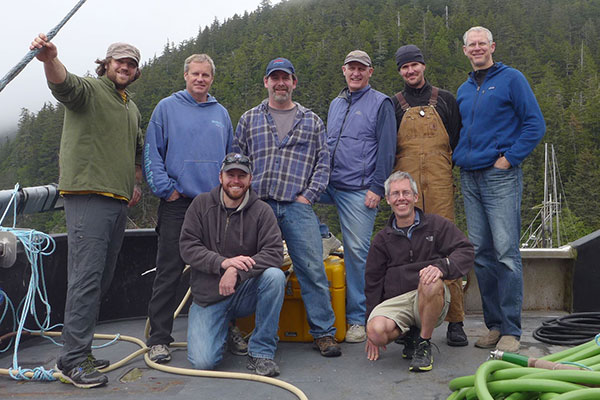
Survey team on fantail of research vessel (R/V) Solstice: James Weise (Alaska Department of Fish and Game [ADFG]), Pete Dartnell (USGS), Dave Anderson (ADFG), Rob Wyland (USGS), John Crowfts (ADFG), and Peter Haeussler (USGS). Kneeling, left to right: Danny Brothers (USGS) and Gerry Hatcher (USGS). [Read more]
A team of USGS scientists—Danny Brothers, Pete Dartnell, Gerry Hatcher, and Rob Wyland from the Pacific Coastal and Marine Science Center and Peter Haeussler from the Alaska Science Center (see photo, above)—led multibeam bathymetry and multichannel seismic-reflection surveys along the northernmost offshore section of the Queen Charlotte-Fairweather fault, between Cross Sound and Icy Point.
Read the entire article in the Sound Waves newsletter.
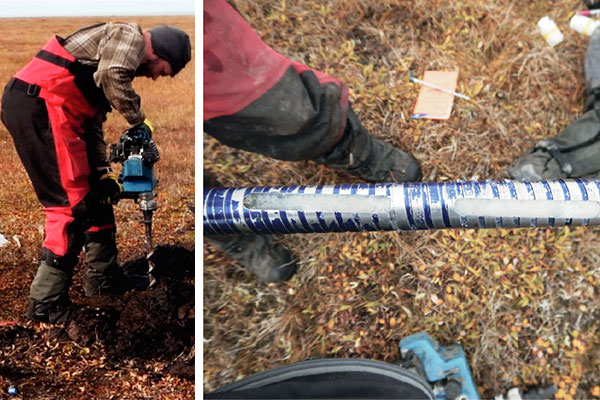
Left, Cordell Johnson drilling and coring the interior of the bluff to ground-truth geophysical methods. Right, a core section filled mostly with ice. [Read more]
In September 2015, scientists from the U.S. Geological Survey (USGS) and the University of California, Santa Cruz (UCSC) surveyed rapidly eroding permafrost bluffs on Barter Island, a remnant of low-elevation tundra on Alaska’s Arctic coast. Warming air and sea temperatures in the Arctic are leading to longer periods of permafrost thaw and ice-free conditions during the summer months, which can weaken the coastal bluffs and increase their vulnerability to storm surge and wave impacts. The 2015 survey is part of a long-term effort to document seasonal to decadal coastal-bluff change on the island’s north coast.
Read the entire article in the Sound Waves newsletter.
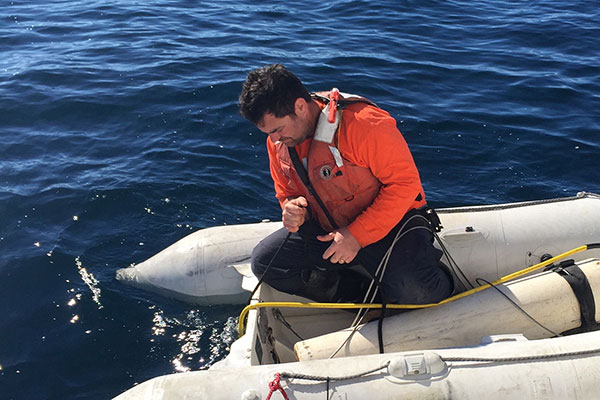
Pete Dal Ferro deploying the bubbler system from an inflatable vessel. [Read more]
In November 2015, scientists from the U.S. Geological Survey (USGS) conducted an experiment using in-house equipment to image artificially created gas plumes offshore of Santa Cruz, California. The experiment is part of our preparation for a 2016 survey of California’s Santa Barbara Basin, where we plan to map the seafloor, image sediment layers beneath the seafloor, and detect and map seafloor seeps. One of the goals of the upcoming Santa Barbara Basin study is to better understand the relationship between sub-seafloor fluid flow, faults, and submarine landslides.
Read the entire article in the Sound Waves newsletter.

USGS research vessel Parke Sanvely and USGS scientist operating a personal watercraft equipped with echosounders used for mapping the nearshore region. [Larger version]
Scientists from the Pacific Coastal and Marine Science Center plan to survey the mouth, beach, and nearby seafloor of the Elwha River in Washington, February 15–19, 2016. The survey will continue to document changes triggered by the 2011–2014 removal of two large dams upstream. Scientists on the research vessel Parke Snavely will map the seafloor using swath sonar. Others, on smaller vessels, will map close to shore and about 1 kilometer up the river using echosounders. Scientists onshore will survey the beach using backpack GPS receivers. A crew on the research vessel Frontier will collect sediment samples to measure grain-size. Similar surveys, conducted regularly since 2004, recorded major changes to the area.
Visit the web page USGS Science to Support the Elwha River Restoration Project.
For more information, contact
Jon Warrick, [email protected], 831-460-7569, or
Andrew Stevens, [email protected], 831-460-7424.
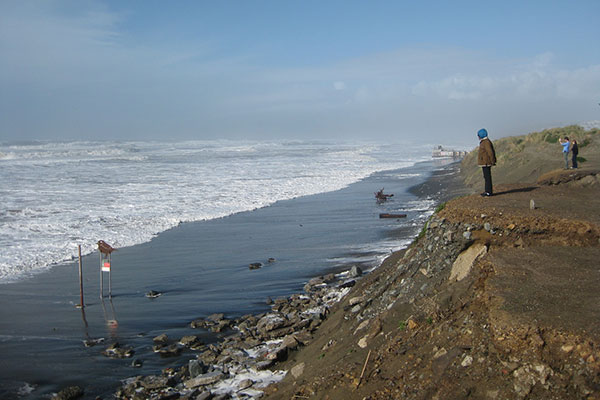
Severe coastal bluff erosion, along the southern end of Ocean Beach, San Francisco, California. This storm damage occurred during the 2009-2010 El Niño, which, on average, eroded the shoreline 55 meters that winter. Photo taken on January 20, 2010 by Jeff Hansen, USGS.
Although the U.S. Geological Survey doesn’t directly study or forecast the weather (our sister agency, NOAA, and its National Weather Service do), the USGS studies and documents the effects and impacts of long-term climate changes and weather phenomena across the U.S. and globally. In particular, the USGS monitors streamflow, floods, landslides, erosion, sea-level rise, and many other earth processes that affect communities and that are often affected by El Niño weather patterns. USGS closely monitors these effects to assist the NWS in its responsibilities for hazard warnings and to assist communities across the country in their preparation, response, and recovery activities.
Learn more about USGS El Niño studies in this article featured as a Top Story in the USGS Newsroom.
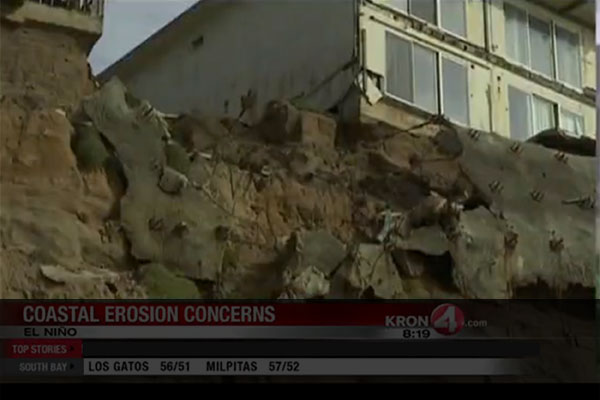 USGS oceanographer in KRON4-TV story about possible beach-cliff erosion from El Niño storms in San Francisco, California
USGS oceanographer Dan Hoover (Pacific Coastal and Marine Science Center) was interviewed by Charles Clifford of KRON4-TV for a story about coastal-cliff erosion that could occur on beaches in and near San Francisco, California, during El Niño storms this winter. Hoover met Clifford on January 12, 2016, at Mussel Rock Park in Daly City. He explained that wave energy typically increases by about 20 percent during an El Niño winter, and storm waves combined with high tides could reach the base of cliffs and cause erosion. He noted that bluffs on different beaches differ in the geology and hydrology that affect how they will fail, making them challenging to study. The interview, broadcast that night, can be viewed at:
http://kron4.com/2016/01/12/video-powerful-el-nino-storms-could-lead-to-erosion/.
For more information, contact Dan Hoover, [email protected], 831-460-7544.
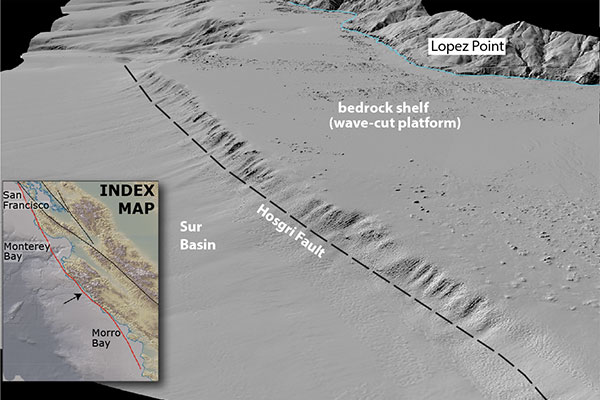
Perspective view offshore of the Big Sur coast. The steep slope beside the Hosgri fault results from uplift along the fault, which is part of the strike-slip fault system that forms the boundary in California between the Pacific and North American tectonic plates.
Sam Johnson of the Pacific Coastal and Marine Science Center and David Schwartz and Lind Gee of the Earthquake Science Center were interviewed January 13, 2016, by KION, the CBS TV affiliate out of Salinas, California, for a program on earthquake hazards in central California. Johnson was interviewed about offshore faults and seafloor imaging. Schwartz discussed earthquake probabilities and forecasting and how a large earthquake could impact the state and the central coast. Gee described how the USGS monitors earthquakes in California. The story aired February 7 after the Super Bowl.
For more information, contact Sam Johnson, [email protected], 831-460-7546.
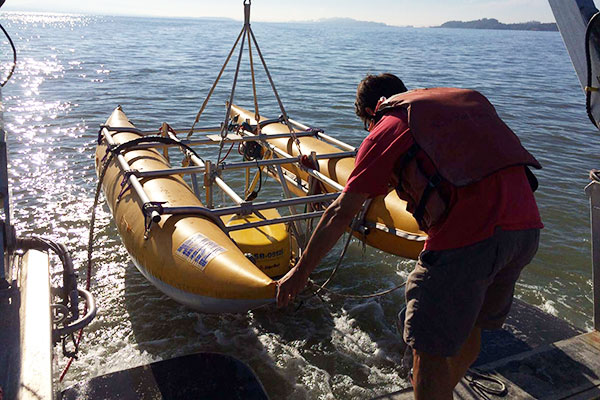
USGS scientist deploying seismic equipment from Research Vessel Parke Snavely in San Pablo Bay, CA.
New USGS mapping shows that two earthquake faults, the Hayward and Rodgers Creek faults, may be directly connected deep beneath San Pablo Bay, a northern extension of San Francisco Bay, California. Such a connection could increase total fault-rupture length and resultant shaking during an earthquake. USGS research geophysicist Janet Watt, who led the mapping effort, was interviewed by San Francisco Chronicle science editor David Perlman on December 15 at the American Geophysical Union Fall Meeting, where she presented the new findings. Perlman’s article, published December 31st, led to additional interviews of Watt and her colleagues by CBS/KPIX television, KCBS radio, the Marin Independent Journal, KRON-4 television, Talk 910 AM radio, USA Radio Network News, Univision, KTSF Channel 26, the Contra Costa Times, and the San Jose Mercury News.
For more information, contact Janet Watt, [email protected], 831-460-7565.
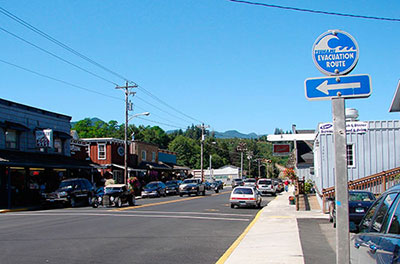
Internationally adopted tsunami-evacuation sign in the city of Nehalem, Oregon.
Stephanie Ross (USGS Pacific Coastal and Marine Science Center and Science Applications for Risk Reduction [SAFRR]) was the USGS coordinator for a National Tsunami Hazard Mitigation Program (NTHMP) workshop, February 1-2, 2016, in Boulder, Colorado. NOAA’s NTHMP provides a customer-based, grass-roots approach to tsunami-hazard assessment and mitigation. The workshop’s goal was to improve collaboration between NTHMP and USGS to provide better tsunami-preparedness products for coastal communities. Topics included: identification and cataloging of tsunami sources (potential earthquakes and landslides); standardized tsunami sources for scenario calculations; and tsunami-vulnerability assessments. About 30 USGS participants and 30 participants from other federal agencies and tsunami-vulnerable states and territories attended the workshop, scheduled just before the NTHMP annual meeting. Stephanie Ross and Nate Wood (USGS Western Geographic Science Center) are the USGS representatives to NTHMP.
For more information see http://nws.weather.gov/nthmp/2016annualmeeting/ or contact Stephanie Ross, [email protected], 650-329-5326.
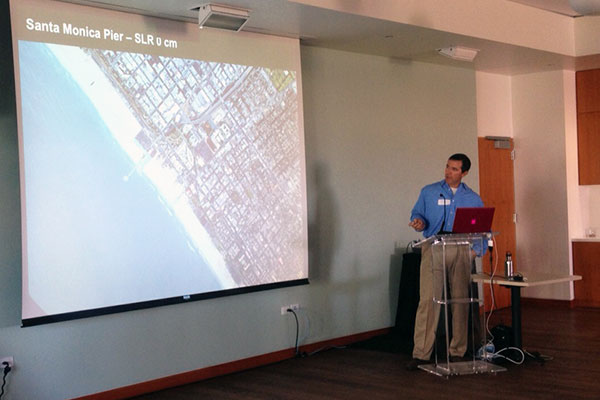
Patrick Barnard presents the initial results from the new CoSMoS 3.0 model for Southern California. Photo by Holly Rindge, USC Sea Grant.
On January 21, 2016, USGS research geologist Patrick Barnard discussed initial hazard maps that show potential flooding in the Orange County region from a 100-year storm combined with four scenarios of sea-level rise. The maps are generated by the latest version of the Coastal Storm Modeling System (CoSMoS 3.0), a USGS-led modeling system that projects coastal flooding and erosion due to both sea-level rise and storms driven by climate change. Many California agencies are using CoSMoS data to plan for coastal impacts from El Niño storms. The webinar “Sub-Regional Coastal Storm Modeling Results: Orange County” was broadcast live on January 21 and is now available as an archived recording.
For more information, visit the CoSMoS website, read more on the USC Sea Grant web page, or contact Patrick Barnard, [email protected], 831-460-7556.
Back to the top of the page.

