 |
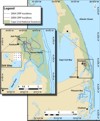 |
Figure
1: Location map showing the study area, sampling-site locations,
and tracklines where continuous resistivity profiling (CRP) data
were collected. |
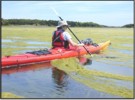 |
Figure
2: Bloom of Cladophora sp. macroalgae in Nauset Marsh,
Cape Cod National Seashore, June 13, 2004. Photo by Marcus C. Waldron,
USGS MA-RI Water Science Center. |
 |
Figure 3:
Location map showing piezometer and core locations in the Salt Pond
study area, and the profile line and projected piezometer and core
locations used in Figure 11.
The profile location approximates 2006 CRP line L6. The adjusted sample
locations represent the closest position along the profile line where
the actual sample location falls. This adjustment allows the sample
locations to be plotted in Figure 11. |
 |
Figure 4:
3D view created using Fledermaus software showing onshore topography
and offshore resistivity values from the 2004 CRP survey lines collected
closest to the shore in the Atlantic Ocean. Resistivity values are
in ohm-m. |
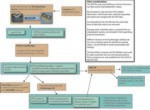 |
Figure
5: Flow diagram of the steps involved in processing CRP data. |
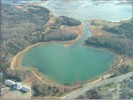 |
Figure 6:
Oblique aerial view of Salt Pond and Nauset Marsh (Salt Pond Bay)
facing toward the southeast. Salt Pond Visitor Center, Cape Cod
National Seashore, is visible in the lower left corner, and U.S.
Route 6 can be seen in the lower right corner. Photo by Barbara
Dougan, National Park Service, Cape Cod, Massachusetts. |
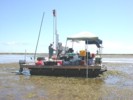 |
Figure
7: The USGS ATV-mounted drilling rig used to advance an electrical
conductance probe and piezometers for ground-water sampling was
operated from a contract barge platform, shown here on a mudflat
in Nauset Marsh during low tide. Photo by John Bratton, USGS Woods
Hole Science Center. |
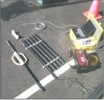 |
Figure 8:
Geoprobe System's Direct Image Electrical Conductivity equipment
including slide hammer, probe, probe rod, probe cable, power source,
and field computer. Photo by Timothy McCobb, USGS MA-RI Water Science
Center. |
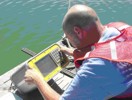 |
Figure 9:
Operating the EC field computer at Salt Pond, Cape Cod, MA. Photo
by John Bratton, USGS Woods Hole Science Center. |
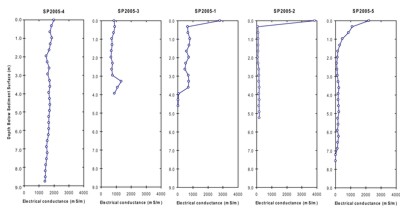 |
Figure
10: Electrical conductance profiles from each of the probe locations
indicated in Figure
3. The Y-axis is the depth below the surface in meters, with
the X-axis representing the electrical conductance in mS/m (millisiemens
per meter). Click on the image for a larger version of the plot. |
 |
Figure
11: Salinity cross section based on piezometer, Geoprobe, and
core data from locations in Figure
3 as well as 2006 CRP data from line L6. |
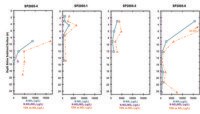 |
Figure
12a: Profiles of concentrations of nitrogen species (ammonium
[NH 4+, measured as NH 3], nitrate/nitrite
[NO 3-/NO 2-], and total
dissolved nitrogen [TDN]) in ground water for samples collected
from piezometers (see Figure
3 for locations). Profiles are plotted in order from the northernmost
(left) to southernmost (right). |
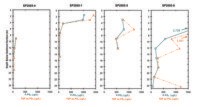 |
Figure
12b: Profiles of concentrations of phosphorus species (phosphate
[PO 43-] and total dissolved phosphorus [TDP])
in ground water for samples collected from piezometers (see Figure
3 for locations). Profiles are plotted in order from northernmost
(left) to southernmost (right). |
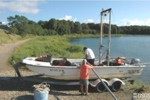 |
Figure
13: The contract boat used for collecting vibracores is shown
here prior to launching at the Salt Pond boat ramp. The boat was
equipped with a frame for supporting coring tubes and vibrations
apparatus, as well as a moon pool that allowed coring to be done
through the hull of the boat beneath the frame. Photo by Dann Blackwood,
USGS Woods Hole Science Center. |
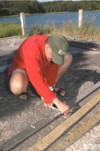 |
Figure
14: Vibracores were returned to shore immediately after collection,
split, and described as shown here. Photo by Dann Blackwood, USGS
Woods Hole Science Center. |
Table 1: Summary of data collected
at individual Salt Pond sites (Figure
3).
Table 2: Summary of CRP survey
details.
Table 3: Sample DEP file headers
for each CRP survey.
Table 4: Processing parameters
used for 2006 CRP data.
Table 5: Electrical conductance
probe data.
Table 6: Field and laboratory
data for groundwater samples.
Table 7: Sedimentologic data
from vibracores.
Table 8: Vibracore pore-water
salinity data.
|