USGS Coastal and Marine Hazards and Resources Program
Historical Shoreline Changes at Rincón, Puerto Rico, 1936-2006
|
The shoreline change data are discussed here in the context of the long- and short-term trends within the reaches identified in the study area. These analyses are limited by the lack of historical bathymetric data, detailed knowledge of the local geologic framework and sediment thickness, and physical oceanographic information. The shoreline changes are interpreted to reflect a multitude of potential underlying causes, including but not limited to
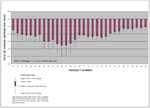
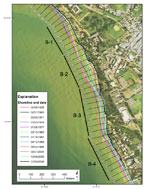
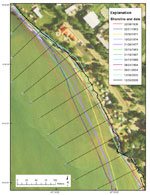
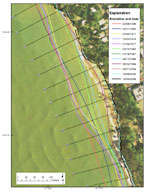
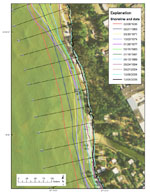
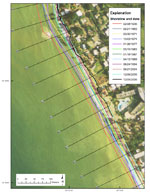
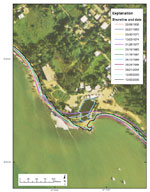
Reaches A and DThe long-term (1936-2006) and short-term (1994-2006) shoreline changes in Reaches A and D suggest a generally stable to slowly eroding coast in these areas. The average rate of change in Reach A indicates very slow long-term erosion. The average rate of change in Reach D is centered around zero and is not statistically significant within the resolution of the data and methods used in this study. In Reach A, the beach is a prism of sand overlying a rocky substrate that appears to erode and accrete in response to storms and seasonal variations in wave energy. The temporal spacing of the data, however, does not resolve such events. A 200 m stretch of coast near the “Steps” surfing beach (transects 27-31) shows a short-term trend of statistically significant erosion, but this could be due to a seasonal difference between the August 1994 survey and the December 2006 survey, recent storm history, or other factors. The coast in Reach D has a similar geological setting. South of Córcega, the seaward extension of the Cerros de San Francisco appears to provide an underlying rocky substrate on which the beach is perched. The northern half of this reach (transects 119-139) may be backed by alluvial sediments and receive sediment input from Quebrada Grande de Calvache. Statistically significant long-term and short-term rates of shoreline change also are present in this area. As discussed below, it is possible that coastal erosion in updrift reaches (Reaches B and C) could be contributing sediment to this downdrift segment of the coastal system. If so, this could result in the “masking” of a real underlying trend of erosion owing to a greater than normal supply of sediment. Reach BHistorical shoreline changes in Reach B are quite complex. The long-term average erosion rate for the entire reach is -1.1 m/yr, but there is substantial alongshore variability (fig. 5). Reach B can be considered to have four subdivisions (fig. 15), on the basis of examination of shoreline positions through time.
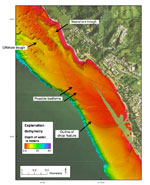
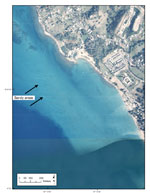
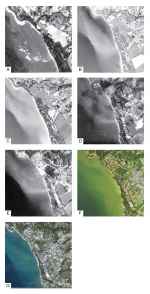
Reach B-1 (transects 55-61; fig. 16) comprises the Balneario de Rincón. This sub-reach appears to have had a generally fluctuating shoreline position since 1936. A large erosional event is recorded by the 1971 shoreline, with substantial recovery by 1974. The data indicate erosion occurred from 1974 to 1983. The shoreline was stable from 1983 through 1994. Since 1994, erosion has predominated at the north end of this sub-reach. Hard stabilization at transect 61 has pinned the shoreline in place since 1989. Reach B-4 (transects 78-85; fig. 20) marks a transition from the complex shoreline behavior of Reaches B-1 to B-3 to the more consistent trend of Reach C. Long-term rates of erosion average just over -0.5 m/yr and decrease to the south. The varied shoreline changes in Reach B and its subdivisions can be interpreted in the context of the nearshore and offshore geology of the area, as well as the history of human modification of the shoreline and impacts on the local sediment budget. In the southern end of Reach A, from Punta Ensenada to transect 54, clear-water aerial photography [for example, the 1997 CRIM photography (see fig. 14) or the imagery currently available in Google Earth (see http://earth.google.com)] shows the presence of nearshore rocky/reefal outcrops. The relatively stable coast in this area may be due to the influence of this shallow, underlying geologic framework, which is similar to the coastal stability observed north of Punta Ensenada. Such framework is not apparent between transects 55-75. Nearshore rock/reef also is present south of the mouth of Quebrada los Ramos, where the magnitude of the shoreline changes decreases. There is not an obvious explanation for the fluctuating shoreline position in Reach B-1. It is possible that this area is impacted preferentially by storms or wave events coming from the south or west that move sand from the upper beach to the shallow nearshore. Over time, the sand is likely to be returned to the upper beach by fair-weather wave processes. This location also may receive episodic influxes of sediment from alongshore or offshore. As shown in figure 13, the large offshore shoal feature appears to attach to the beach in Reach B-2. It may be that the historical shoreline stability here is due to onshore or obliquely alongshore sediment transport from the shoal. It is possible that the substantial erosion, indicated by the 1983 and later shorelines, is due to the impacts of the jetty/breakwater system at Punta Ensenada, which is consistent with that proposed by Thieler and others (1995). In this scenario, sediment flux along the beach could have been impounded by the marina and the volume of longshore transport reduced by the associated dredged material removal. It is also possible that the construction of the seaward jetty/breakwater on the rocky platform seaward of the historical “ambient” shoreline position of Punta Ensenada (fig. 21) is causing sediment to be deposited into deeper water where it is not able to return in substantial quantity to the beach. Accurate historical bathymetry and other data such as offshore sediment distribution and thickness would be required to test this speculation. Unfortunately, the requisite data apparently do not exist. The offshore shoal body appears to exert a substantial influence on the nearshore wave energy in Reach B-2. As shown in figure 22, historical aerial photography shows a very complex pattern of reflected, refracted, and diffracted waves in this area that is not present in the other coastal reaches. This pattern was present at least periodically during large wave events since at least 1951 and could be a long-term feature of the nearshore oceanography of this region. It is unclear what impact on shoreline change such complex wave patterns and associated sediment transport may have. The spatial and temporal association of the wave patterns and shoreline change history, however, suggests a possible, albeit unknown, linkage. It is possible that physical oceanographic measurements (waves, currents, sediment transport) and modeling studies could provide insight into what linkages may exist here. The consistent erosional trend in Reach B-3 from 1936 to 1983 could represent normal background erosion in this area. The period of shoreline stability from 1983 to 1989 could be due to a temporary increase in sediment supply from erosion of the updrift coast. As described above, much of this shoreline has been stabilized recently with a rock revetment. As described above, Reach B-4 appears to mark a transition from the complex shoreline behavior of Reaches B-1 to B-3 to the more consistent trend of Reach C. Reach CThe long-term (1936-2006) erosion trend in Reach C averages -0.4 m/yr (fig. 5). The trend is very consistent over time, and consequently the error estimates of the regression used to compute the rates are small. Short-term (1994-2006) erosion rates average -0.7 m/yr, which is nearly double the long-term average. It is possible that the short-term rates are biased by seasonal or storm-related influences; at least four named tropical systems (Dennis, Emily, Alpha, and Gamma) passed to the south of Puerto Rico during the late summer and fall of 2005. Local observers reported substantial erosion in Reach C from these storms, although by the time of field surveys in December 2005, a great deal of beach recovery (seaward progradation and volume gain) had taken place. The long-term trend of erosion can be expected to continue; it probably reflects the ongoing “background” erosion rate in this reach due to variations in sediment supply, sea-level change, and other factors. |
Click on figures for larger images.
|