Woods Hole Science Center

![]() Title |
Introduction |
Setting |
Methods |
Results |
Discussion |
Data Catalog |
Acknowledgments |
References |
Figures |
Contacts
Title |
Introduction |
Setting |
Methods |
Results |
Discussion |
Data Catalog |
Acknowledgments |
References |
Figures |
Contacts
 |
||
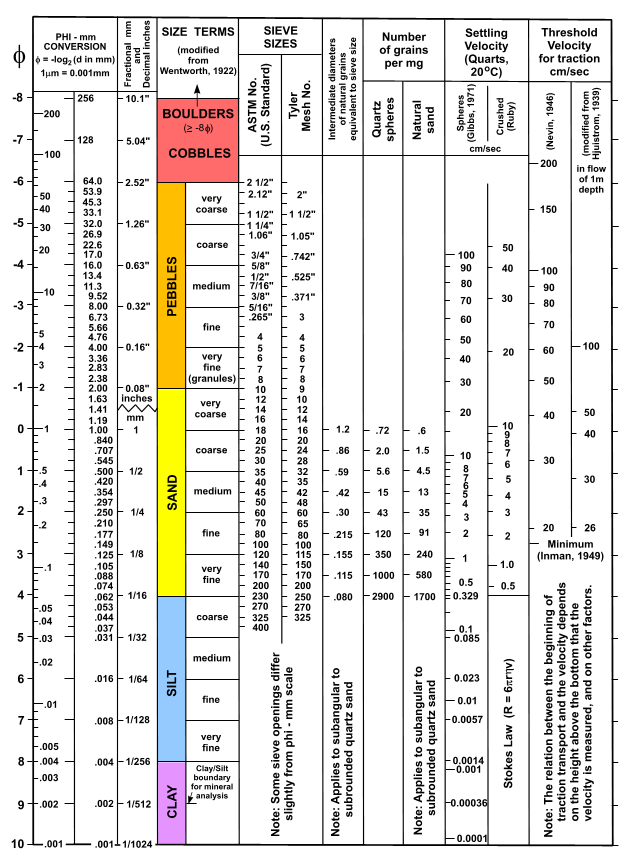
Figure 11. Correlation chart showing the relationships between phi sizes, millimeter diameters, size classifications (Wentworth, 1922), and ASTM and Tyler sieve sizes. Chart also shows the corresponding intermediate diameters, grains per milligram, settling velocities, and threshold velocities for traction. | ||