Woods Hole Science Center
|
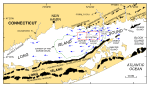
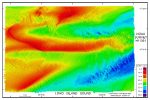
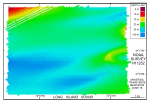
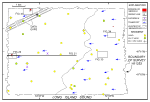
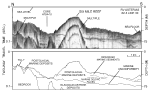
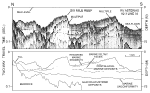
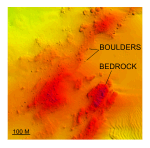
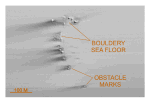
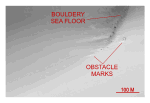
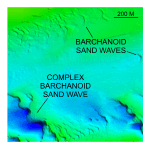
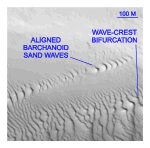
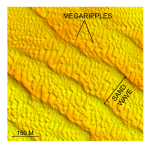
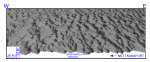
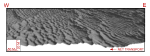
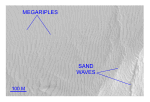
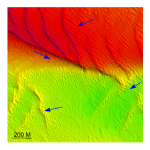
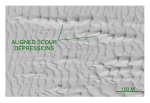
The multibeam bathymetric data (figs. 13 and 14) reveal distinctive patterns in sea-floor morphology, which can be correlated with the effects of modern processes and the underlying, seismically-detected geologic units within the study area. These correlations have been used to construct the interpretive maps presented in figures 15 and 16. These maps show where bedrock, moraine, glaciolacustrine, and postglacial marine deposits are inferred to crop out or subcrop at the sea floor. The maps also document the effects of strong tidal currents that drive coarse bedload transport and intense scour around obstructions. Bedrock and Glacial MorainesPaleozoic bedrock crops out in two areas along the northern edge of the study area, centered near 41°12.8'N, 72°30.0'W and 41°12.75'N, 72°26.3'W (figs. 15, 17, 18, 19, 20), and, possibly, along the western edge of the study area near 41°10.85'N, 72°38.55'W (figs. 16, 21, 22). Characteristics used to identify these outcrops as bedrock include the presence of an irregular seismic reflector inferred to be acoustic basement, erosion resistant outcrops or subcrops that influence the morphology of the sea floor, morphologic orientation parallel to onshore glacial striations and streamlined hills, a smooth surface on larger outcrops suggesting the absence of boulders, and bottom video observation. Onshore in the adjacent Old Lyme, Essex, Clinton, and Guilford quadrangles glacial striations and glacially-smoothed bedrock ridges have average trends of 165-180° that parallel the interpreted direction of ice movement (Flint 1971, 1975; Stone and others, 2005). Groups of outcrops visible on the bathymetry exhibit a similar trend; however, some individual outcrops appear to trend 230-250°. We believe this apparent difference results from ice-plucking during glaciation, which created a 'stoss and lee' effect along the ridge crests. Erosion of the southern and southeastern extents of the highest points on a ridge would give a slight southwestern elongation to the remnants that now extend above the surrounding marine sediments. Outcropping morainal deposits are difficult to distinguish from bedrock on subbottom profiles. Both are represented by a strong seismic reflector whose surface forms acoustic basement, and the two units can occur in close proximity to each other (figs. 17, 18, 19, 21). However, we interpret some outcrops of acoustic basement within the study area to be till deposited in end moraines because there are abundant boulders on the sea floor (figs. 20, 23), and earlier work showed that till caps many bedrock highs in this part of the Sound (Williams, 1981; Lewis and Needell, 1987). Outcrops of till are located along the northern edge of the study area (figs. 15, 20), at some of the exposures along its western edge (fig. 22), and in its northwestern corner (fig. 23). The morainal deposits follow the trends of recessional moraines mapped across southeastern Connecticut (Stone and others, 2005) and probably represent their offshore extensions. The till outcrops along the northern edge of survey H11361 and western edge of the study area probably represent extensions of the Old Saybrook moraine (fig. 1). The outcropping till in the northwestern corner of the study area lies north of the strike of the other outcrops of this lithology and, therefore, is probably an extension of the Hammonasset-Ledyard moraine. Low relief of the morainal deposits over the surrounding sea floor and the abundance of isolated boulders suggest erosion during the marine transgression and removal of the till's finer grained sediment. Glaciolacustrine DepositsA unit, seismically characterized by finely laminated, rhythmic, parallel internal reflectors that drape the underlying acoustic basement, lies beneath most of the study area and crops out or subcrops along the eastern edge of the study area (figs. 15, 17, 18, 19). The largest exposure of this unit is northeast of Six Mile Reef, but other exposures occur southeast of the shoal. Numerous smaller exposures of this facies may also be exposed at the sea floor in the troughs of large sand waves where scour has cut into the underlying laminated deposits (figs. 15, 24). A sediment core (AT84-10) from an earlier stratigraphic study of the eastern Sound targeted this unit (figs. 15, 17; Lewis and Needell, 1987; Poppe and others, 2002a). The core penetrated 2.9 m of layered gray to dark brown silty clay and clayey silt interlayered with thin lenses of silty sand beneath 1.7 m of Holocene coarse sand and gravelly sand. Based on seismic character and lithology of the core sample, the rhythmic muddy deposits that underlie much of the study area are interpreted to be varved glaciolacustrine sediments that record deposition in glacial Lake Connecticut. Regional mapping of surficial sediments shows that the overlying gravelly sediments apparently armor the underlying glaciolacustrine sediments and coarsen eastward (Poppe and others, 2000). Post-glacial Marine DepositsDeltaic Deposits -- Marine sediments overlie the glacial drift and form two distinct units (figs. 17, 18). The marine strata in the lower unit are variably composed of clayey silt, silty sand, sand, gravelly sediment, and gravel and have a distinctive seismic signature typified by westward-dipping reflections in progradational configurations on seismic profiles collected parallel to the Connecticut coast and by the presence of gas-charged sediment (fig. 18; Lewis and Needell, 1987). This lower unit, which forms the core of Six Mile Reef (Lewis and Stone, 1991), reaches maximum thicknesses on the shoal of 41 m, 46 m on the southwest-trending elongate bathymetric high located about 3 km south of the shoal, and averages 17-22 m thick on the intervening sea floor (figs. 17, 18). The lower unit pinches out eastward of Six Mile Reef into thin lag deposits, as shown by the rapid thinning of the 10-m thick wedge of sediment north of Six Mile Reef and east of the exposed Old Saybrook moraine segment discussed above (fig. 19), and also thins westward of the shoal to about 10 m along the western edge of the study area (fig. 21). Seismic reflections from this lower marine unit record deltaic facies that form the core of Six Mile Reef and show that this deposit is a remnant of the material eroded from the lakebed of drained glacial Lake Hitchcock and transported down the Connecticut River (fig. 1; Lewis and Stone, 1991; Lewis and DiGiacomo-Cohen, 2000). Concurrent with the thinning of this unit toward the western edge of the study area is a flattening of the internal reflectors that suggests a transition to more distal deltaic facies (fig. 21). The seismic profiles also show that the shoal is strictly a sedimentary deposit, lacking structural control. Modern Reworked Sediments -- The upper marine unit is relatively unstratified, appearing homogeneous on the seismic profiles (figs. 17, 18, 19, 21, 24). This internal seismic character and the close association of this unit with large bedforms suggest that virtually all of these surficial sediments have been reworked from the underlying glaciolacustrine and postglacial marine deltaic deposits. Poorly sorted gravelly sand is the dominant surficial sediment adjacent to the shoal in the eastern part of the study area. Undulatory and linguoid current ripples are common, except in areas of shell hash and gravel pavements. The coarse lithology and thin nature of these deposits, which armor the underlying glaciolacustrine deposits discussed above, reflect a sedimentary environment characterized by long-term erosion or nondeposition. Sediments on Six Mile Reef and around the central and western parts of it are primarily moderately to well sorted, medium-grained sand with mud contents that average about 1%. Asymmetrical ripples, megaripples, and sand waves are ubiquitous. Ripple crests are typically sharp and range from straight to undulatory. Shell debris collects in ripple troughs; "pea" gravel is concentrated in the troughs of the sand waves. Much of the bottom appears mobile; infaunal burrows are rare to absent. The sea bed in this area reflects sedimentary environments of coarse bedload transport. The sediments in the western part of the study area are primarily poorly sorted, very fine-grained sands with mud contents that range between 3 to 25%. Although the sands within this area are rippled, the ripples are small (wavelengths <15 cm) and degraded. The crests are irregular, rounded, and confused giving the bottom an undulating appearance. Animal tracks and infaunal burrows are common. This sea bed reflects sedimentary environments of sorting and reworking, and a much lower energy level than areas farther east. Barchanoid Sand WavesBarchanoid sand waves occur both north and south of the shoal in the deeper waters of the eastern part of the study area, and cover more than 13% of the sea floor (figs. 13, 25, 26). These waves commonly align into elongate fields having smaller isolated waves concentrated in the eastern ends. Individual barchanoid sand waves average less than 100 m wide, but can exceed 150 m. Westward within barchanoid wave fields wavelengths increase, the fields widen, and the barchanoid waves become larger and coalesce into complex forms and highly-curved ridges. In places, barchanoid waves grade laterally into transverse morphologies (fig. 26). The slip faces of both small individual and large complex barchanoid sand waves are at or near the angle of repose (about 32°), but the stoss slopes are slightly shallower for the smaller sand waves (7° versus 9°). Although the coalesced forms retain their arcuate slip faces and relatively gentle stoss slopes, the horns are shortened, widened, and rounded. Regardless of size, location, and complexity, all of the barchanoid sand waves are concave westward indicating westward sediment transport (Mckee, 1966; Cacchione and others, 1987). Asymmetry of adjacent straight-crested sand waves and of scour marks around nearby boulders also indicates net westward transport. Relief of individual barchanoid waves and complex forms averages 1-2 m and 3-5 m, respectively. However, isolated scour depressions, which cut into the underlying glaciolacustrine deposits (fig. 24), commonly occur in the troughs within the convex areas of the larger waves. If trough-to-crest amplitudes are measured from these depressions the waves appear much larger, and individual barchanoid waves have average amplitudes of 2-3 m, complex forms that have coalesced into ridges have average amplitudes of 10-15 m, and some giant waves exceed 20 m. The presence of "blow-out" depressions is evidence for intense scour that occurs on the down-current sides of the barchanoid sand waves. This scour, which may be related to roll vortexes, supplies a mechanism for the continued erosion of the armored glaciolacustrine sediments and creates another source of fine-grained sediment for the Sound. Transverse Sand WavesTransverse bedforms dominate many parts of the study area and exhibit an almost continuous spectrum of amplitudes and crestline lengths. Current ripples occur on the flanks of the megaripples, megaripples occur on the flanks of sand waves, and sand waves occur on the flanks of larger sand waves (fig. 27). Many transverse sand waves exceed 1.5 km in length, and one is longer than 2.2 km. Together, fields of transverse megaripples and sand waves account for over 70% of the sea floor within survey H11361 and over 38% of the sea floor within survey H11252. These fields reflect the strength of the bottom currents and can be used to indicate directions of net sediment transport (Ludwick, 1972; Allen, 1980). Asymmetry of the transverse sand waves is typically pronounced with slip faces that are oriented toward the west and southwest (figs. 28, 29). This asymmetry suggests a flow-transverse crest orientation and net sediment transport toward the west and southwest. Wave-crest morphology is variable and sand-wave fields with relatively straight, smoothly sinuous, undulating, curved, and bifurcating crest forms occur. Borders of sand-wave fields can be rather abrupt. Bifurcation of the wave crests, where present, is most common near abrupt edges of the fields (fig. 26). Stoss slopes of the transverse sand waves range from 2-9°; slip faces are steeper, ranging from 10-26°. Wavelengths of the sand waves range from 45-270 m. Megaripples having average wavelengths of about 26 m are commonly present on the stoss slopes and between the transverse sand waves. Megaripples typically mimic the asymmetry of the sand waves, but not necessarily their orientation. For example, although megaripple crests parallel the crests of adjacent sand waves west of Six Mile Reef (fig. 30) and on the bathymetric high south of that shoal, crests of megaripples in the bathymetric low southwest of Six Mile Reef and on the shoal do not. Sand-wave crests in the bathymetric low southwest of the shoal trend 310-320°, but megaripple crests trend roughly north (fig. 27). Crests of the megaripples on Six Mile Reef trend 320-330°, regardless of sand wave orientation (fig. 31). Megaripples on barchanoid waves are much less common. Characteristics of the transverse sand waves on Six Mile Reef vary by location, but all have gently curved convex-westward crests owing to a change in orientation relative to the trend of the shoal. Sand waves just off and atop the shoal are perpendicular to its trend; those on the flanks are oblique. Sand waves on top of the central part of the shoal are much more symmetrical and smaller than the waves on the flanks or ends (fig. 32). In a few places, the waves on top of the shoal display a symmetrical trochoidal form, having both slopes convex upward and a peaked crest. Sand waves on the central part of the shoal have average 2-3 m amplitudes and 140-150 m wavelengths. Waves on the flanks and ends of the shoal are asymmetrical, having most slip faces oriented to the west. Some have amplitudes that exceed 8 m (fig. 29). Transverse sand waves on the bathymetric high south of Six Mile Reef are also smaller than those on its flanks. Here curved crests of the waves are convex eastward, and the waves are all asymmetrical (figs. 15, 28). Regardless of location, our acoustic data collected along adjacent lines during opposite tides show that gross asymmetry of the sand waves and megaripples does not change orientation with the tide. Sand-wave asymmetry is reversed adjacent to the southwestern flank of Six Mile Reef (fig. 31). In this area slip faces are oriented toward the east. Bottom currents within the area just southwest of the shoal have steepened its flank, bent its trend to the northwest, and are transporting sediment eastward to where the currents are deflected away from the shoal by currents flowing westward along its southern flank. A southward tapering wedge of sediment, whose tip is curved westward, has been deposited where these currents meet. Northwest of the shoal (fig. 33) sand-wave morphology also suggests that long-term transport to the east. Together, the counter currents that produced the bedforms in these areas help shape the shoal and are important to its maintenance. Isolated scour depressions also occur in the troughs of transverse sand waves (fig. 34). These features are best developed just west of Six Mile Reef and the smaller bathymetric high located about 2.5 km to the southwest, and are configured into groups of 3-10 depressions that are aligned normal to the crests of the adjacent sand waves in a roughly east-west direction. The depressions, which are 4-7 m deeper than the sea floor in the adjacent part of the same trough, are deepest at the base of the slip slope of the up-stream sand wave. Sand-wave crests between these depressions are deflected eastward and have lower relief, but only by 1-2 m. The amplitude and abundance of large bedforms decrease markedly westward of Six Mile Reef and the smaller nearby bathymetric highs (fig. 30). Sand waves grade into megaripples and are absent beyond about 1.5-2 km west of the shoal. Megaripples are no longer discernable in the acoustic data beyond about 2-4 km west of the shoal (figs. 14, 16). Obstacle MarksThe intensity of tidal-current scour is evidenced by depressions around obstructions that are visible in the bathymetry. Swirling currents develop around boulders and bedrock outcrops that protrude through surficial sediments. Turbulence causes increased flow velocity sufficient to scour the sea floor downstream from obstructions and to produce coarse-sediment floored sharp-pointed depressions called obstacle marks (Werner and Newton, 1975). Good examples of these bedforms, also known as comet marks, are present around outcrops of bedrock and moraine in the western part of the study area (figs. 22, 23). Obstacle-mark asymmetry indicates net westward sediment transport. Four shipwrecks lie within the study area. The most prominent wreck, south of the western tip of Six Mile Reef, is that of the Lake Hemlock, an 80-m long converted WW1 cargo ship that sank in 1957 (figs. 13, 15, 35). The strong oscillatory nature of the tidal currents is illustrated by conspicuous scour depressions that extend both eastward and westward from the wreck. However, asymmetry in the scour depression around the shipwreck is evidence of net sediment transport to the west. Overall length (0.6 km) and depth of the depression below the adjacent sea floor (>10 m) is evidence for the intensity of the scour. Our data also show another shipwreck just south of Six Mile Reef and two other unidentified shipwrecks in the western part of the study area (figs. 13, 14, 15, 16). Obstacle marks associated with these wrecks also indicate westward net sediment transport. |
Click on figures for larger images.
|
![]() Title |
Introduction |
Setting |
Methods |
Results |
Discussion |
Data Catalog |
Acknowledgments |
References |
Figures |
Contacts |
Disclaimers
Title |
Introduction |
Setting |
Methods |
Results |
Discussion |
Data Catalog |
Acknowledgments |
References |
Figures |
Contacts |
Disclaimers