 |
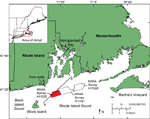
Figure 1. Location of National Oceanic and Atmospheric Administration (NOAA) survey H11322 study area (red polygon) in Rhode Island Sound, southeast of Point Judith, Rhode Island. Also shown are locations of NOAA surveys H11320 and H11321 and the seismic profile A-A' presented in figure 3. Inset shows location of study area off the northeastern United States. |
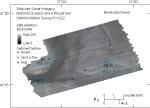 |
Figure 2. Sidescan-sonar image of National Oceanic and Atmospheric Administration survey H11322 in western Rhode Island Sound. Areas of high backscatter (lighter tones associated with generally coarser grained sediment) are observed on the bathymetric highs in much of the eastern, northwestern, and southwestern parts of the study area. Areas of low backscatter (darker tones associated with generally finer grained sediment) are observed in the troughs in the western and southern parts of the study area. Also shown are sediment sample locations (red, yellow, and blue circles) and locations of figures 10, 11, and 12 (blue rectangles). Area of image is shown in figure 1. |
 |
Figure 3. Stratigraphy interpreted from seismic subbottom profile across Rhode Island Sound. (Modified from Needell and others, 1983b, location of profile shown in figure 1.) |
 |
Figure 4. Location of end moraines (black polygons) and submarine ridges (dashed lines) in southern New York and New England (modified from Gustavson and Boothroyd, 1987) and location of study area (gray polygon). The Ronkonkoma-Nantucket end moraine represents the maximum advance of the Laurentide Ice Sheet about 20,000 years ago and the Harbor Hill-Roanoke Point-Charlestown-Buzzards Bay end moraine represents a retreated ice-sheet position from about 18,000 years ago (Uchupi and others, 1996). |
 |
Figure 5. Photograph of National Oceanic and Atmospheric Administration Ship RUDE at sea. (Photograph by NOAA.) |
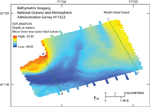 |
Figure 6. Bathymetric image of National Oceanic and Atmospheric Administration survey H11322 in western Rhode Island Sound. Bathymetric highs are located in the northwest, northeast, and southwest. Channels lie between the northern bathymetric highs and across their southern boundaries. Green lines indicate locations of seismic-reflection profiles B-B' and C-C', shown in figures 7 and 8, respectively. |
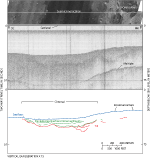 |
Figure 7. (Top) sidescan-sonar imagery from the western part of the study area, (middle) in the area of seismic-reflection profile B-B' (from Needell and others, 1983b) extending southeast to northwest, (bottom) with interpretation. Fluvial, estuarine, and transitional sediments overlie till in the channel and along the southern flank of the northwestern bathymetric high. The bathymetric high also shows small plateaus, which are visible as patches of high and low backscatter in the sidescan-sonar imagery and are interpreted to be erosional outliers. Location of seismic-reflection profile is shown in figure 6. |
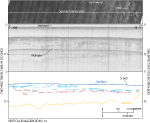 |
Figure 8. (Top) sidescan-sonar imagery associated with (middle) seismic-reflection profile C-C' (from Needell and other, 1983b) and (bottom) interpretation. The uppermost unit is composed of horizontal to gently dipping stratified sediments, interpreted to be glaciolacustrine deposits, which overlie till and bedrock. A small dip in the sea floor in the southern part of the profile occurs where small scarps cross the region. Sand waves are visible in the sidescan-sonar imagery northwest of the scarp. Location of seismic-reflection profile is shown in figure 6. |
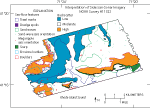 |
Figure 9. Interpretation of sidescan-sonar imagery of study area including low, moderate, and high backscatter; sand waves; sand-wave and megaripple axis orientation; scarps; erosional outliers; boulders; trawl marks; and dredge spoils. Location of study area shown in figure 1. |
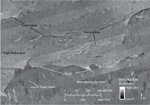 |
Figure 10. Detailed sidescan-sonar image of an area containing scarps, which show a sharp contrast in backscatter that continues along most of the southern slope of the eastern bathymetric high. Sand waves, oriented generally east-west, and higher backscatter are observed north of the scarp. Trawl marks can be seen in the area of moderate backscatter south of the scarp. Location of image shown in figure 2. |
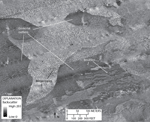 |
Figure 11. Detailed sidescan-sonar image showing erosional outliers in the northwestern part of the study area. Erosional outliers are characterized by low backscatter, presumably representing fine-grained fluvial and estuarine sediment, which form small plateaus about 1 meter high. Areas of high backscatter and megaripples are found between the erosional outliers. Location of image shown in figure 2. |
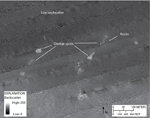 |
Figure 12. Detailed sidescan-sonar image showing dredge spoils in the southwestern part of the study area. An area of low backscatter can be seen in the northern part of the image. Boulders, characterized by high-backscatter targets with low-backscatter shadows, comprise some of the dredge spoils. Location of image shown in figure 2. |
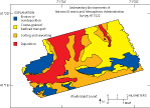 |
Figure 13. Sedimentary environments found in the study area include those characterized by processes of erosion or nondeposition, coarse-grained bedload transport, sorting and reworking, and deposition. Location of study area shown in figure 1. |
