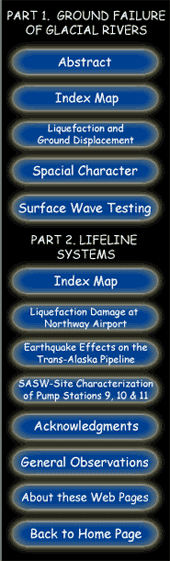
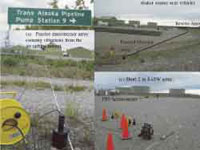
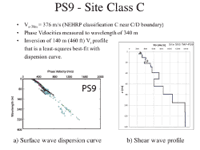
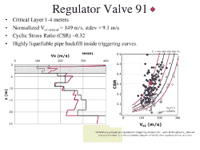
Click on image to view larger version
Abstract | Index Map 1 | Liquefaction and Ground Displacement | Spacial Character | Surface Wave Testing Index Map 2 | Liquefaction Damage at Northway Airport | Earthquake Effects on the Trans-Alaska Pipeline SASW-Site Characterization of Pump Stations 9,10 &11 | Acknowledgments | General Observations | About These Web Pages Geotech Home Page
geotech/denaligeoposter/sasw.html CONTACT: Robert Kayenlast modified 2018