
Brian Collins, Eric R. S. Moss, Nicholas Sitar
Dept Civil & Environ. Engineering, University of California at Berkeley, Berkeley, CA 94720
Gary Carver
Carver Geologic, Inc., PO Box 52, Kodiak, AK 99615
Reprinted from:
Proceedings: Fifth International Conference on Case Histories in Geotechnical Engineering, New York, NY. April 13-17, 2004
|
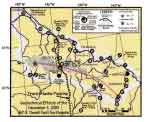
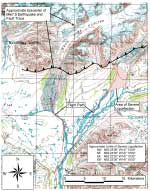
Contents: Abstract ABSTRACTThe M 7.9 earthquake of November 3, 2002 event ruptured more than 340 kilometers on three faults, causing widespread liquefaction in the fluvial deposits of steep alpine valleys of the Alaska Range and eastern lowlands of the Tanana River. The event occurred in a remote and largely undeveloped portion of the rugged Alaskan central range, with few seismometer recordings. The areas affected by liquefaction are largely confined to native Holocene river deposits, areas bounded by stiffer ground moraine, Pleistocene uplands, and bedrock. Liquefaction affected areas of alluvial river valleys draining mountainous and glacier-proximal rivers. The most noteworthy observations are that liquefaction damage was focused towards the eastern end of the rupture area. In the western portion of the rupture zone, localized liquefaction developed in recent deposits of the Susitna and Delta rivers in the immediate vicinity of the surface rupture of the fault. More abundant and severe liquefaction occurred on the eastern Robertson, Slana, Tok, Chisana and, especially, Nabesna Rivers. In the Tanana lowland, liquefaction features were sparse on the western bars of the Tanana River in the vicinity of Fairbanks to west of Delta, but became pervasive throughout the eastern region from Delta to Northway. Though liquefaction observations were abundant, there was a dearth of instrumental recordings useful to relate damage effects to measured intensity. To characterize soil properties and stiffness of liquefaction evaluation sites, we used a portable spectral analysis of surface waves (SASW) apparatus to profile the shear wave velocity of the ground. On the Nabesna and Delta rivers that cross the fault, we only observe liquefaction features in soil deposits where normalized shear wave velocities fall below 230 m/s. Severity of sand boils, fissuring and lateral displacement of liquefied ground dramatically increase in soils of lower shear wave velocity, especially below 170 m/s. Some of the most pronounced ground failures are far from the fault zone (60-100 km) in extremely loose, low velocity (~ 120 m/s) fine sands of the bars of the Tanana River. Strong motion instrumentation was sparse within 150 kilometers of the fault rupture and the seismometers of Alyeska pump stations PS9 (PGA=0.09), PS10 (PGA=0.36g), and PS11 (PGA=0.09) serve as the principal strong motion recordings. Insufficient strong motion instrumentation is available to identify areas of amplified ground motion. DENALI FAULT EARTHQUAKEOn the morning of November 3, 2003 an earthquake of moment magnitude M 7.9 ruptured across three faults: the Susitna Glacier, Denali, and Totschunda. The M 7.9 main shock was preceded by an M 6.7 foreshock on October 23, 2002 (Figure 1), on a 45-kilometer segment of the Denali Fault (Eberhart-Phillips, et al. 2003). The epicenter of the main shock was 22 km east of the foreshock. The main shock consisted of multiple subevents (Eberhart-Phillips et al. 2003). The first subevent was an M 7.2 thrust event at the epicenter near the Susitna Glacier. This event ruptured a 40 km segment of the previously unknown Susitna Glacier Fault. A second subevent (Figure 1) triggered a primarily dextral rupture on the Denali fault in the vicinity of the Black Rapids Glacier and Trans-Alaska Pipeline (TAP) and was equivalent to an M 7.3. The second subevent produced the large velocity pulse recorded nearby at the TAP pump station 10. The peak acceleration and velocity at PS 10 were the highest recorded for the earthquake at 0.36g and 114 cm/s (high pass filtered), respectively (Figure 1). The third subevent (Figure 1) was located about 140-220 kilometers east of the hypocenter in the region east of the TAP between the Canwell Glacier and Mentasta. This dextral offset had a large displacement pulse on the Denali Fault, followed by a right step-over zone to the Totschunda Fault and sharply diminished surface displacements over the 76 km portion on the Totshunda fault rupture. The total surface rupture was 340 kilometers, and seismic moment inverted from the geodetic and strong motion data is estimated to be between M7.8 and M7.9 (Eberhart-Phillips et al. 2003). The overall duration of shaking was about 140 s. with individual subevent displacement pulses having periods of 20-30 s. Because of the remote location of this great earthquake, the cost to lives and property were remarkably low. There were no fatalities, only one injury, and damage estimated at approximately $20 million dollars.
The fault ruptured beneath the route of the Trans-Alaska pipeline (TAPS) at pipeline mile marker 591 with about 5.5 m of dextral slip distributed across several en-echelon step-overs. The pipeline's Earthquake Monitoring System and Alyeska pipeline personnel initiated an automated shutdown after the earthquake. Within several kilometers of the rupture zone, eight horizontal support beams for the pipeline and nine anchor support structures were damaged where the pipe was elevated, causing the pipeline to sag in a few places. Where the pipeline was free to slide on the horizontal beam, via a Teflon shoe, pounding damaged vertical support bars. Some settlement of the pipeline occurred in liquefied back fill about 1.5 kilometers south of the fault rupture at regulator valve 91. The Trans-Alaska pipeline, designed to withstand 6.1 m of dextral slip, and durations and motions associated with a M 8.0 earthquake, withstood the earthquake with little damage and no spillage of oil. LIQUEFACTION and RELATED GROUND DEFORMATIONWidespread liquefaction within alluvial deposits of rivers and streams in and adjacent to the central Alaska Range generated lateral-spreading cracks and sand blows. Along with liquefaction-related features, landslides triggered by the earthquake were mainly rock falls and rock slides containing varying amounts of ice and snow (Harp et al., 2003). The most spectacular landslides were large rock avalanches that spread onto the glaciers, for example, the Black Rapids Glacier rock slides (Figure 2). With only one strong-motion seismometer recording near the earthquake rupture and felt reports from the thinly settled area sparse, the patterns of triggered landslides and liquefaction effects may be among the best indicators of the pattern of ground shaking.
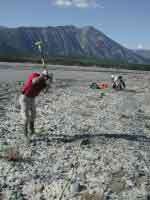
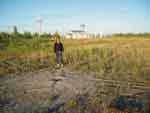
Liquefaction-induced ground failures were widespread throughout east-central Alaska, to distances well beyond the narrow 30 km limit of landslides straddling the rupture zone. Seismic triggering of soil liquefaction occurs in buried layers of unconsolidated, water-saturated silts, sand and gravely sand during prolonged shaking in an earthquake. In liquefaction, the sediment particles in the buried layer reorient themselves to occupy less space (contract) and force a reduction of water filled pore space. A transient elevation of pore water pressure and sharp loss of soil strength results from this contraction. Overlying layers that are unsaturated, more consolidated, or frozen find themselves rafted on the momentarily softened liquefied soil layer(s) and become destabilized, moving downhill (lateral spreading) and fracturing to allow the water to escape through sand boils and fissures. Liquefaction from the Denali Fault earthquake induced debris flows, lateral-spreading ground failures, sand boils and fissures. The distribution of liquefaction effects depended upon the location of susceptible deposits with respect to the fault. These deposits were mainly alluvium along the Alaska Central Range rivers and also included lake-margin sediment and artificial fill. Reconnaissance by air and by driving the road network from the Parks Highway into Yukon Territory, Canada suggested that liquefaction effects extended out from the surface rupture for approximately 100-120 km. In addition to liquefaction features, soil slides and flows were observed within fine-grained (glacial rock flour?) deposits along the banks of the Nelchina River south of the Glenn Highway, approximately 200 km from the zone of fault rupture (Harp et al. 2003). APPROACH and METHOD OF INVESTIGATIONImmediately following the earthquake, a reconnaissance team sponsored by the National Science Foundation (NSF) and the U.S. Geological Survey (USGS) was sent to the epicentral region to assess the geotechnical aspects of this event. The team's focus was to quantify the spatial extent and amplitude of damage of ground failures, soil liquefaction, and associated damage to lifeline systems and structures. During the November reconnaissance, three fixed-wing flights over the fault rupture region and river-systems draining the Central range were followed by a ground-level reconnaissance of the region accessible by car. During the flights we were able to document the broad spatial extent of liquefaction features on the Holocene river deposits of the central range, and the region of lake-ice cracking. These flights allowed us to target the locations of the ground-level investigation in November 2002 and July 2003.The abundance of liquefaction features, and the apparent severity of lateral deformations and fissures, observed from the air, was investigated on the ground in the second half of the November reconnaissance. We mapped the spatial pattern of fissures and location of sand boil fields using a digital mapping tablet and differential GPS unit. This allowed us to directly annotate DEM and DOQ files with survey tracklines and comment on the observed damage. The digital mapping system we used couples PENMAP and GEOMAPPER real-time mapping/monitoring software with a 32-bit tablet-computer with Windows graphical-user-interfaces (GUI), a survey-grade differential-capable global positioning system (GPS) unit, and a satellite-based GPS differential signal to obtain decimeter precision level during mobile positioning surveys. The mapping unit is lightweight and worn on a backpack. One surveyor was put in charge of conducting the GPS field surveys while the other members of the survey team performed sampling and measurement tasks (Figure 3).
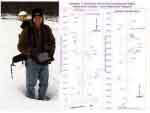
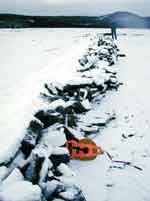
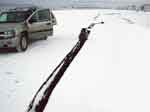
We characterized the resistance to liquefaction of the soil column at liquefaction evaluation sites by measuring the stiffness properties (shear wave velocity, Vs) of the upper 30 meters of the ground. To efficiently do this without invasively drilling at sites we used a variety of surface wave techniques: transient source-Spectral Analysis of Surface Waves (SASW); and continuous harmonic-wave SASW to capture the phase velocity-dispersion characteristics of the ground. From the dispersion data we compute, by inversion, the shear wave velocity structure. Many of the sites we tested are gravels and gravely sand, and surface wave methods are especially useful for profiling these deposits. Surface wave apparatus is lightweight, portable, and easily deployable by one or two people. For remote site investigations where transport by backpack or helicopter is necessary, we carry a sledgehammer source, 1-Hz seismometers, and a spectrum analyzer powered by car battery (Figure 4). For most locations a field vehicle could be driven within 100 meters of the site, and far cleaner phase-velocity data was obtained using a continuous harmonic-wave source (Figure 5).
Inversion of the phase velocity dispersion curve is a process of determining a theoretical shear wave velocity profile whose dispersion characteristics match the experimental dispersion measurements. This is done using a non-biased numerical approach that iterates toward a constrained least-squares fit between the theoretical and experimental data. The liquefaction assessment of ground using shear wave velocity is process in which the soil capacity to resist liquefaction is compared with the estimated loads put on the soil mass by earthquake shaking. Here, soil capacity is measured by shear wave velocity, and load is estimated using the commonly adopted cyclic stress ratio (CSR,Youd et al. 2001).
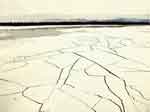
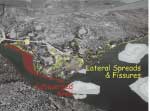
HOLOCENE RIVER DEPOSITSTANANA RIVER On the north side of the Alaska Range in the Tanana River valley, at 50 to 120 km from the zone of fault rupture, we saw extensive evidence of liquefaction where fluvial deposits of sand and silt were capped by a thin (<0.3m) frozen surface layer (Figure 1). Liquefaction within the Tanana River valley was widespread from isolated fissures and sand boils in Fairbanks, on the west, to at least several hundred kilometers eastward. Liquefaction damage became increasingly severe east of Delta Junction, even as distance from the fault increased. In the Tok area, nearly every river bar contained extensive liquefaction effects. Farther east, for many kilometers around the town of Northway, large continuous lowland areas of liquefaction and lateral-spread failures were observed (Figure 6). Two DGPS measured transects along the Tanana River at Tetlin bridge, west of Tok, showed lateral strains of 3-4% on sand bars across distances of 200 m (21 fissures) and 400 m (48 fissures) (Figure 6). In some places the frozen crust (<0.3 m) of separate lateral spreads decoupled from the underlying soil and collided, buckled and thrust over one-another resulting in contraction of as much as 4.5 m (Figure 7). Parallel fissures formed locally where the ground spread laterally toward the river. More commonly the frozen ground surface displayed randomly oriented sub-linear fissures, normally less than 10 cm-per-fissure in width, which formed polygon networks that could be traced for several kilometers (Figure 8). However, in most places the fissures in the frozen ground surface were sub-linear with random orientations forming networks of polygons that in places were continuous across many acres, and in some places kilometers. The dimensions of the polygons in our transect surveys ranged from 0.15-0.3 meters in thickness, and typically 8-10 meters across. In total, Tanana River bar ground failures covered a vast area east of Big Delta. Shear wave velocities of the Tanana River deposits at Tetlin Bridge for the critical layer of liquefied soil ranged from 110 m/s to 140 m/s.
TANANA-NABESNA-CHISANA RIVER CONFLUENCE In the Northway area, a region of lowlands with swamps, liquefaction-related ground failures were ubiquitous. The Northway area is 130-180 km from the section of maximum displacement on the Denali Fault and about 80 km from the closest point on the Totschunda Fault rupture. Lateral spreading rendered the airport at Northway unusable. The frozen surface layer and paved runway at Northway were cut by fissures, many 10-30 cm wide, with some 1 m wide or greater, spaced meters to tens of meters apart (Figure 8). Fractures as wide as 1 m and as long as 100 m opened along the perimeter of the runway and vented silt, coarse to fine sand, and pebbles. Associated with the sand vents were sinkholes as much as 4 m in diameter and 1 m deep. Anecdotal reports from residents describe water and soil spewing 2-4 m into the air. Parallel and polygonal patterns of lateral spreads similar to those observed in the Tanana River bars were observed at Northway, both in the paved runways and in the surrounding undeveloped areas. Away from the runway, houses and structures were unseated and tilted on their foundations, sand boils were ubiquitous, and road settlement bent and crushed drainage culverts (Figure 9). Shear wave velocities at three liquefied sites near Northway Airport for the critical layer of liquefied soil ranged from an extremely low 90 m/s to 150 m/s.
The Nabesna River emerges from its glacier approximately 20 km south of the Totschunda Fault, and drains northward as it crosses the fault zone. The flood plain of the Nabesna River crosses over the eastern-most end of the Totschunda Fault rupture. Along the path of the river the sediment deposits fine toward the north. From the glacier to within approximately 5 kilometers of the south of the fault, the flood plane is primarily gravels-to-gravely sand. In the vicinity of the fault crossing the sediment fines from gravely sand to medium sands. To the north, the sediment continues to drop its coarse fraction and in the vicinity of Northway Village the river is composed of primarily fine silty sand. The pattern of liquefaction triggering is asymmetrical about the fault crossing. North of Devils Mountain lodge area, about 5 kilometers south of the fault crossing, the soil abruptly transitions into a moderate-to-severely liquefied state across a narrow zone of 0.5 km. Southward of this location, toward the glacier, no liquefaction features were found. The most severe fissuring occurred immediately above the fault crossing, but liquefaction features in the form of fissures and sand vents continued at varying degrees of severity downstream all the way to Northway with localized non-liquefaction areas. We investigated the Nabesna River deposits at five sites near the fault zone and at three sites at Northway. South of the fault crossing, the texture of the near surface deposits noticeably fine toward the rupture zone. The shear wave velocities computed for five sites along the river south of the fault also show a steady decline in velocity on the upper 6 meters of the soil (Figure 10). In the-glacier proximal non-liquefied area (583NAB, 584NAB, 585NAB) shear wave velocities in the upper 6 meters are mostly above 190 m/s, whereas north of the edge of liquefaction triggering (580NAB, 581NAB) velocities fall below 160 m/s. The liquefied sites have effective stress normalized velocities in the range of 157-190 m/s in the critical layer.
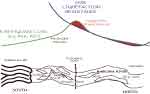
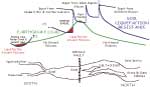
Conceptually, the abrupt transition into a liquefied state south of the fault and elongated zone of liquefaction observations to the north can be explained by the relation of the attenuating seismic loads about the fault rupture and northward declining soil capacity to resist liquefaction (Figure 11). South of the fault crossing, the load and resistance curves sharply intersect. Here, we expect the transition from no liquefaction areas into areas of moderate to severe liquefaction to be abrupt, consistent with the surface observations. On the other hand, northward of the fault crossing both the seismic load and soil capacity to resist liquefaction fall away from the fault. Liquefaction will occur here when loads exceed resistance, and transitions into areas of liquefied deposits are expected to be gradual and potentially extend far away from the source of the loads, consistent with observations. The asymmetrical liquefaction patterns across the fault rupture zone are explained by the intersection of the earthquake motion attenuation curve and the soil liquefaction resistance capacity curve. For a given geologic unit (e.g. young Holocene river deposits), attenuation of motion is largely a function of depth of rupture and horizontal distance from the fault. Events with deep-rupture depths tend to flatten the attenuation curve in areas close in to the fault zone, while lowering the amplitude of motions. For shallow-events, or surface-rupture events like the Denali Fault earthquake, typically the motions attenuate more rapidly with distance from the fault, even close-in to the fault zone. For near-vertical faults rupturing primarily in strike-slip mode it is common for the attenuation pattern of motion intensity to be symmetrical about the axis of the rupture zone (Boore, Joyner and Fumal, 1997). On the other hand, the liquefaction resistance capacity of the soil is due to the stress-state and stratigraphy of the soil deposit (e.g., texture; degree of compaction and saturation; age; presence of a drainage impeding fines). Soils of the Nabesna River in the vicinity of the fault zone are young Holocene cohesionless deposits, with a water table within 0.5-1 meter of the surface, and no fined-grain cap. The soils five kilometers or more south of the fault are proximal to the Nabesna Glacier and are dominated by cobbles, gravel and gravelly sand deposits. Within five kilometers south of the fault zone, the deposits transition into a textural zone where soils are commonly observed to liquefy (Youd et al., 2001) during shaking and stays within this zone from the fault crossing north to the confluence of the Tanana River. We believe that this natural sorting process of Nabesna river deposits has led to a liquefaction resistance capacity profile that is asymmetrical about the axis of the fault rupture plane. The relation between the symmetrical ground motion attenuation profile and the asymmetrical soil capacity profile controls the spatial distribution of liquefaction observations.
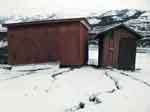
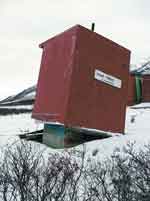
The Delta River liquefaction occurrence is more complex than that of the Nabesna River. On the Delta, numerous side-entering glacial rivers form cobble and gravel fans that are highly resistant to liquefaction under any loading scenario, and these glacial tributaries introduce large volumes of new material into the main-stem deposits of the Delta River. The effect of these tributaries is to coarsen and poorly re-sort the main-stem material for downstream transport and deposition. Here, we describe the features along the Delta River from the headwaters region to the confluence at the Tanana River. Upstream of where runoff from Canwell glacier enters the Delta River, we observed liquefaction features in the main stem of the Delta River, and in its side tributaries. By far, the most abundant and damaging liquefaction features were observed at Fielding Lake State Park on the Phelan Creek tributary of the Delta River. These include lateral spreads, severe fissuring, and submergence of shoreline. Below the park, the deposits of the Delta River had localized sand boils and minor fissures in the vicinity of the fault crossing. Below the fault crossing zone liquefaction is not observed on the river above the confluence with the Tanana River. Fielding Lake is located on one of the headwater drainages of the Delta River, at Phelan Creek, south of the fault crossing, and within two kilometers of Isabel Pass, the drainage divide for the Alaska Range. Widespread liquefaction, lateral spreading, sand blows, and submerged ground were observed at Fielding Lake where the upper soil crust was not frozen at the time of the earthquake (Figure 13). Seen here were classic features associated with lateral spreading along a lakeshore such as large fissures roughly contour parallel, and displacement of ground towards lowland areas. In areas of low lying brush along northeast end of the lake, at the mouth of the exiting river that drains to Phelan Creek, laterally spread and settled ground sank below lake-level submerging and drowning vegetation. Light wood-frame structures built on the spreading ground were tilted and displaced down-slope, and an underground septic tank became buoyant lifting a small out-house structure out of the ground (Figure 14 & 15).
At Fielding Lake, we augured several holes and measured three SASW-based shear wave velocity profiles, all with similar characteristics. The liquefiable soil layer at Fielding Lake is a low plasticity silty-sand in the upper 3 meters, underlain by a stiffer gravel-sand. The shear wave velocity of the critical layer, in the range of 111-125 m/s, is extremely low when compared with other documented sites that have liquefied during past earthquakes (Kayen et al. 2004) and accounts for the severity of ground displacements observed at the park. North of Fielding Lake and the confluence of Phelan Creek and the Delta River, localized sand boils and small fissures were observed in young Delta river deposits in the vicinity of the Miller Creek, and near Regulator Valve 91 1.5 km south of the fault. Along the fault crossing at the Delta River there were numerous sand blows and fissures in the alluvium. Regulator Valve 91 (RV91) is about 1.5 km south of the fault rupture, and serves as a gate valve for the Alaska pipeline. The valve was damaged when the pipeline sank 75 cm into man-made backfill that provided support to the pipeline. The manual gate-wheel for the valve sank below grade and could not operate without excavation (Figure 16). The pipeline backfill at RV91 and along a 1-kilometer zone south of the fault liquefied, resulting in settlement, and fissuring along the axis of the pipe.
South of the fault crossing, where the Black Rapids Glacier and McGinnis Glacier discharge their sediment load into the Delta River, the texture of the alluvium becomes predominantly gravel and gravelly sand. No liquefaction was observed on the Delta River deposits south of the confluence of these rivers.
A conceptual profile of the relationship between earthquake motion loads and soil liquefaction resistance is presented in Figure 17. The environment in the Delta River Valley region is more complex than the Nabesna River area, with numerous side-entering glacial valleys bringing significant bedload into the main-stem of the Delta River and altering the textural composition and liquefaction resistance. Liquefaction occurs at, and south of, the fault rupture upstream of glacial river inputs that deposit cobble and gravel rich poorly sorted sediment into the Delta River.
We conducted a ground and air reconnaissance of the area along the western 100km portion of the Denaii Fault rupture and the Susitna Thrust. The Denaii Highway was closed to traffic prior to the earthquake and could not be driven until the summer of 2003. Helicopter reconnaissance of the Susitna fault area following the November event identified that liquefaction occurred forward (south) of the thrust (P. Hausseller, pers. commun.). The Denali Highway runs east-to-west parallel and south of the central Alaskan Range from Paxson to Cantwell. The highway crosses and parallels several major glacially derived rivers, including the Delta River, which forms in headwater lakes approximately 25 kilometers west of Paxson, the Maclaren River, the Susitna River, and the Nenana River. With the exception of one embankment failure in the Tangle Lakes no ground failures were observed along the Denali Highway, though high water prevented viewing of much of the glacial river deposits. At Tangle Lakes, ground-cracking parallel to the road along a 10-meter tall embankment was observed.
Airborne reconnaissance was used to investigate reports of liquefaction in the headwaters area of West Fork and Susitna Rivers immediately downstream of their namesake glaciers. Severe liquefaction in the form of dense networks of sand boils and lateral spread features over a widespread area were encountered forward of the toe of the Susitna Glacier moraine. Sand boils were very densely located in this area with many organized along lineated fissures. Some sand boils left sizeable craters up to 15 centimeters deep with ejecta material fining away from the central crater (Figure 19). Of the four samples taken for material characterization, three were subrounded, poorly graded coarse sands (USCS classification SP). One sample taken from a boil was composed of rounded, well-graded sandy gravel (USCS classification GW).
CONCLUSIONSBased on the spatial distribution of liquefaction observations, it appears that the rupture energy and ground motion intensities were focused toward the eastern end of the Denali Fault and Totschunda Fault. The most distal liquefaction features were in the Northway area, a region of lowlands with swampy areas, where ground failures were ubiquitous. The Northway area is 130-180 km from the area of maximum displacement on the Denali fault and about 80 km from the closest point on the Totschunda fault. Liquefaction features on the western end of the fault were sparse with the exception of features immediately south of the Susitna Thrust Fault, and isolated fissures and lateral spreads on bars of the Tanana River near Fairbanks. The distribution of liquefaction effects triggered by the Denali Fault earthquake of 3 November 2002 was unusual in many aspects. The large areal extent of the distribution of liquefaction features compared to the limited zone of landslides (Harp et al. 2003) suggests that minimum shaking levels and duration requirements for liquefaction were more extensive than those needed to trigger rock falls and rock slides. The higher concentrations and severity of liquefaction effects to the east, in the area of the third subevent of the earthquake, suggest that ground-motion durations or amplitudes were greater in that area during the earthquake resulting from a longer slip event. The geographic pattern of liquefaction features provide a record of shaking against which to test conceptual models that are being designed to predict the geographic variation in shaking from analysis of seismic records. ACKNOWLEDGMENTSWe wish to thank the NSF, USGS, PEER Center, and Alyeska Pipeline Service Company for their support of the 2002 reconnaissance and 2003-geotechnical investigations. Alaska Department of Transportation and Public Facilities, Statewide GIS Mapping Section provided highway data.REFERENCESBoore, D. M., Joyner, W. B., and Fumal, T. E. 1997. Eberhart-Phillips, Donna, P. J. Haeussler, J. T. Freymueller, A. D. Frankel, C. M. Rubin, Patricia Craw, N. A. Ratchkovski, Greg Anderson, G. A. Carver, A. J. Crone, T. E. Dawson, Hilary Fletcher, Roger Hansen, E. L. Harp, R. A. Harris, D. P. Hill, Sigrun Hreinsdottir, R. W. Jibson, L. M. Jones, Robert Kayen, D. K. Keefer, C. F. Larsen, S. C. Moran, S. F. Personius, George Plafker, Brian Sherrod, Kerry Sieh, Nicholas Sitar, and W. K. Wallace,. ALASKA. The 2002 Denali Fault earthquake, Alaska; a large magnitude, slip-partitioned event. Science, v. 300, no. 5622, May 16, 2003. p.1113-1118. Ellsworth, W. L., M. Celebi, J. R. Evans, E. G. Jensen, R. Kayen, M.C. Metz, D.J. Nyman, J. W. Roddick, C.D. Stephens, and P. Spudich (in review). Near-Field Ground Motions in the November 2, 2002 Denali Fault, Alaska, Earthquake Recorded in the Near Field of the Earthquake at Pump Station 10, Earthquake Spectra. Harp, E.L., Jibson, R.W., Kayen, R.E., Keefer, D.K., Sherrod, B.L., Carver, G.A., Collins, B.D., Moss, R.E.S., and Sitar, N., 2003, Landslides and liquefaction triggered by the M 7.9 Denali Fault earthquake of 3 November 2002: GSA Today, v. 13, p.4-10. Kayen, R., Thompson, E., Minasian, D., Collins, B., Moss, R., Sitar, N., Carver, G. (2003) Geotechnical and Surface Wave Investigation of Liquefaction and Strong Motion Instrumentation sites of the Denali Fault, Mw 7.9, Earthquake, Eos Trans. AGU, 84(46), Fall Meet. Suppl., Abstract S12A-0381, 2003. Kayen, R., Collins, B., Moss, R.E.S., Thompson, E., Minasian, D., Sitar, N., Carver, G. (in review) Geotechnical Effects of the November 3, 2002 Denali Fault, Mw 7.9, Earthquake, Earthquake Spectra. Youd, T. L., Idriss, I. M., Andrus, R. D., Arango, I., Castro, G., Christian, J. T., Dobry, R., Liam Finn, W. D., Harder, L. F., Jr., Hynes, M. E., Ishihara, K., Koester, J. P., Laio, S. S. C., Marcuson, III, W. F., Martin, G. R., Mitchell, J. K., Moriwaki, Y., Power, M. S., Robertson, P. K., Seed, R. B., Stokoe, II, K. H. (2001). Liquefaction resistance of soils: Summary report from the 1996 NCEER and 1998 NCEER/NSF workshops on evaluation of liquefaction resistance of soils, J. Geotech. and Geoenvir. Engrg., ASCE, 127(10), 817-833. |
geotech/denaliobs/index.html
CONTACT: Robert Kayen
last modified 2018


 Back to Top