
The 26 December 2004 Indian Ocean Tsunami: Initial Findings from Sumatra
Tsunami Heights
To measure wave heights, the scientists looked for water stains on buildings and broken branches and debris in trees (where buildings and trees were left standing), then used laser rangefinders to calculate the heights. The west-facing coastlines were struck by the highest waves, some more than 30 m high. Waves that hit the north-facing coastline of Banda Aceh were lower, about 10-12 m high, but the area’s low-lying land allowed those waves to penetrate far inland.
The scientists' efforts were focused mainly around the very northwest end of Sumatra, but they also collected data about 100 km (60 mi) to the south, at Kreung Sabe. Wave heights of 15 m (50 ft) at that site suggest that the tsunami waves may have been 15 to 30 m high along the entire 100-km stretch of coast from Kreung Sabe to the northwest tip of the island. USGS scientists have returned to Sumatra in April 2005 to test this hypothesis by measuring wave heights at intermediate points along the coastline and to collect additional data, such as nearshore bathymetry and sediment-deposit profiles.
Tsunami Wave Height Indicators
water marks on buildings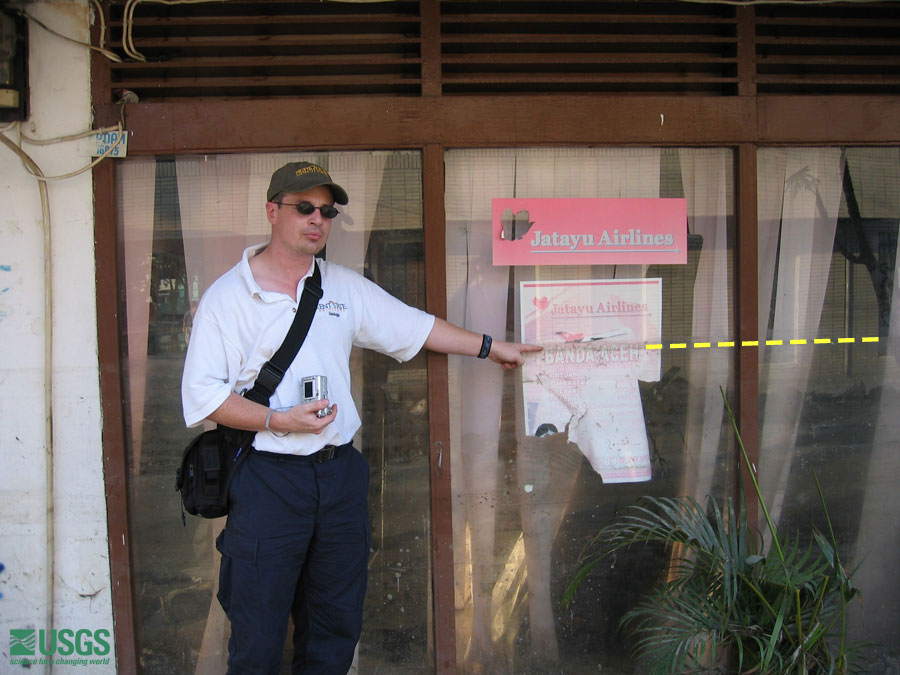 Dr. Andrew Moore points to water mark left by tsunami. [larger version] |
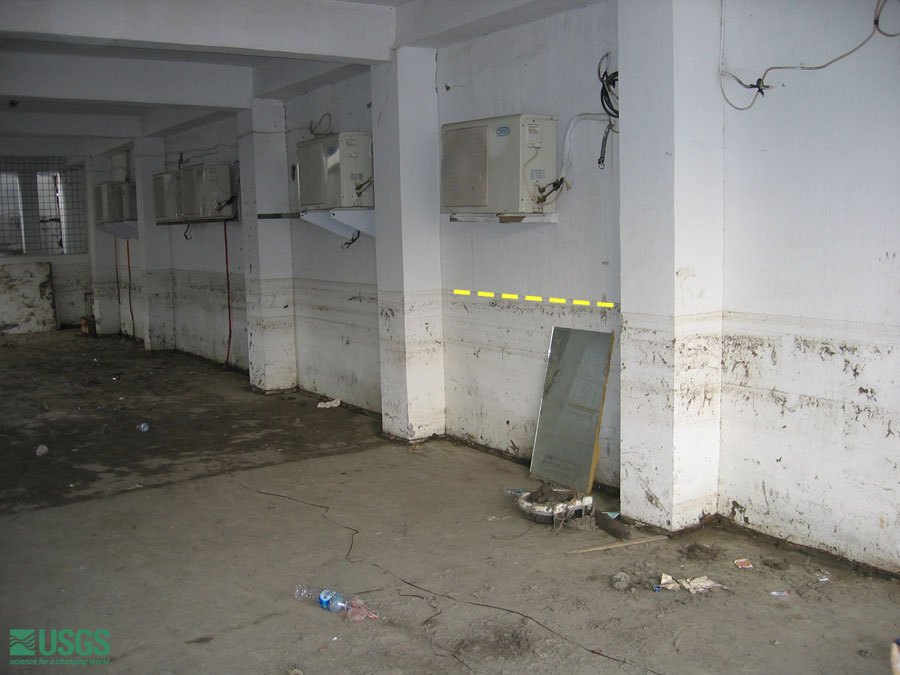 Dashed line indicates water mark left by tsunami. [larger version] |
bark stripped off trees Branches are broken and bark is scraped off of trees up to the height of tsunami. [larger version] |
broken tree branches Trees snapped off and broken branches on trees help indicate tsunami height. [larger version] |
Measured Tsunami Wave Height
 Sketch depicts the tsunami wave height at Lampuuk. [larger version] |
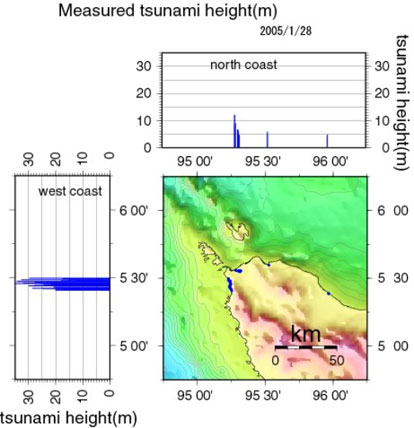 Graphs of tsunami heights measured by the survey team in Banda Aceh (north coast) and along the west coast from Lampuuk to Leupeung. [larger version] |
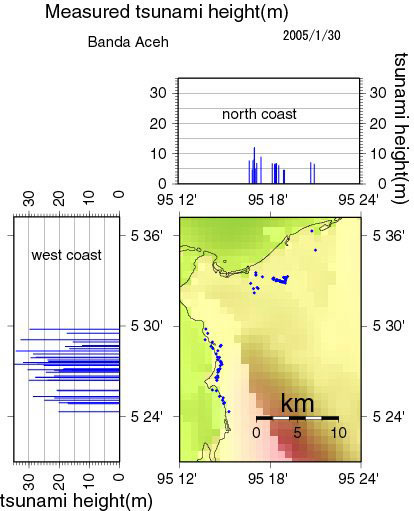 Smaller-scale version of graphs of tsunami heights measured by the survey team in Banda Aceh (north coast) and along the west coast from Lampuuk to Leupeung. [larger version] |
Tsunami height and run-up measurements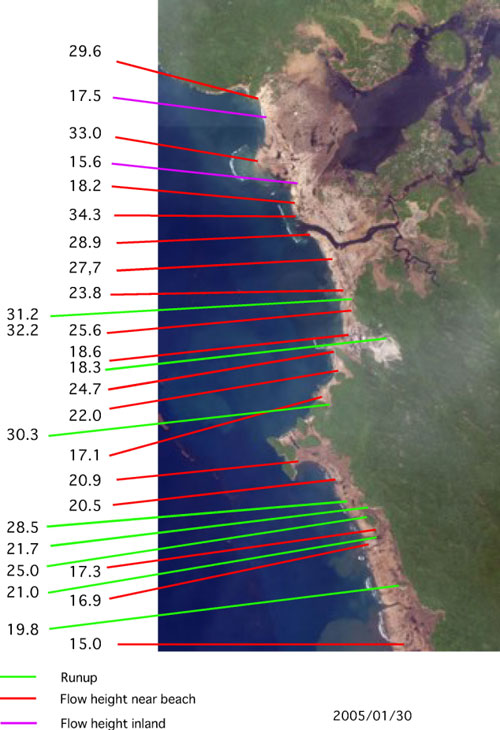 [larger version] |
 Damage to structures
 |
 |
 |
 |