 Atolls are unique, poorly understood settings:
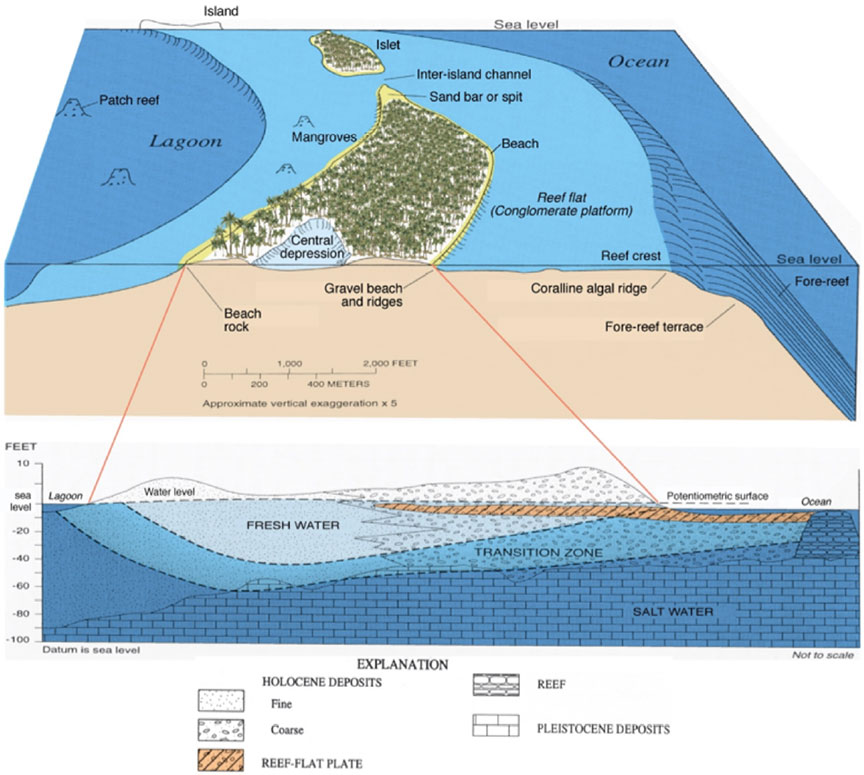
At right, schematic drawing showing the features of a typical atoll (Fletcher and Richmond, 2010). The exposed ocean-side beaches on the atoll islet are commonly steep and gravel rich, whereas the lagoon-side beaches are more protected and tend to be gently sloping and sand rich. Shown are saltwater, transition, and freshwater zones. [Larger version.]
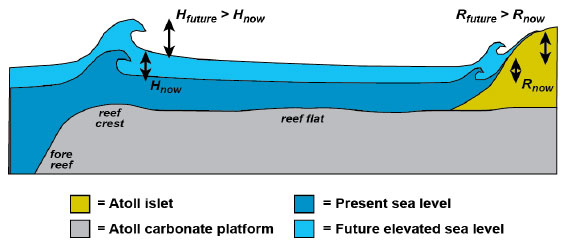 The projected rates of sea-level rise through 2100 are 2 to 10 times greater than optimal net vertical reef flat accretion rates — thus sea level will rise faster than coral reef flats can grow upward. Waves in shallow water break when their height (H) is approximately 125% of the water depth. Run-up (R), the maximum elevation of wave uprush on the coast, increases with wave height.
At right, sea-level rise will result in larger waves (H), higher run-up (R), and greater inundation and resulting impacts.
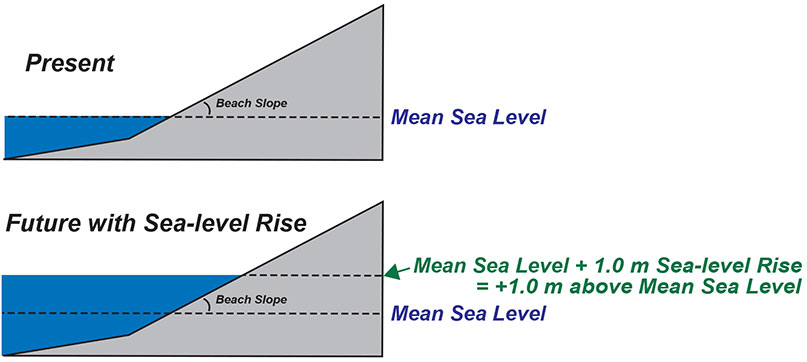 1) GIS-based passive "bathtub" model
At right, is the model typically used for sea-level rise studies. The model is applicable to low-energy water bodies, such as estuaries and marshes. [Larger version]
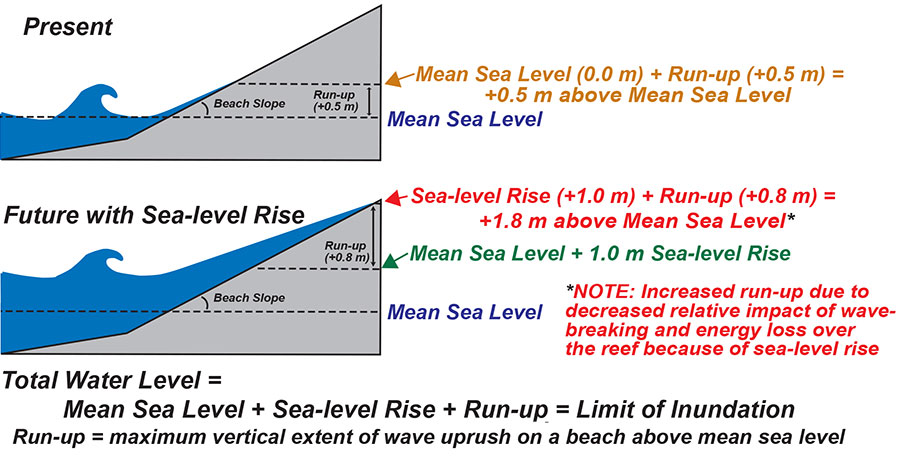 2) Dynamic model that includes wave-driven run-up
At right, is the model we�re using because islands in the Pacific Ocean are exposed each year to waves as high as 5 to 7 meters (16 to 22 feet). [Larger version]
