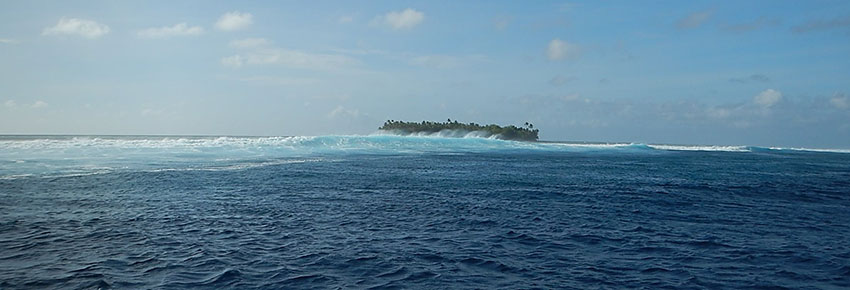
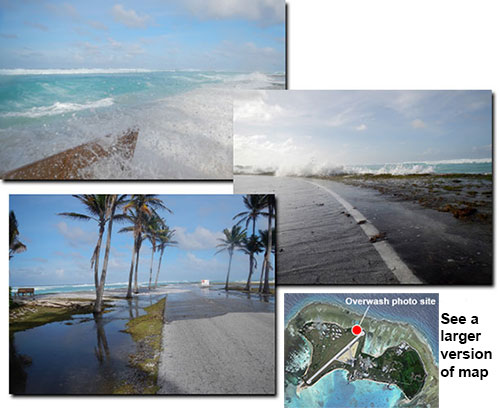
 On 2 March 2014, 5-meter-high waves with 15-second periods struck the island chain during spring high tides, causing the largest overwash event in the Republic of the Marshall Islands (RMI, including Kwajalein Atoll and Roi-Namur Island) since the devastating 18 December 2008 event.
We captured the March 2014 event, which caused significant impact across RMI, with the most diverse and densest set of instrumentation yet deployed in an atoll environment, providing invaluable data for model calibration and validation. Project staff are currently analyzing the instrument data from this event.
A larger version of a map showing the location where these photographs were taken can be seen below.
We used two IPCC-AR5 "representative concentration pathways" (RCP) emission scenarios (RCP4.5 and RCP8.5) to run the NOAA WAVEWATCH III wave model for the Pacific.
From this exercise we now have future directional wave height and period projections and wind speed and direction projections for Kwajalein for the middle of the 21st century (2035–2050) and the end of the century (2085–2100).
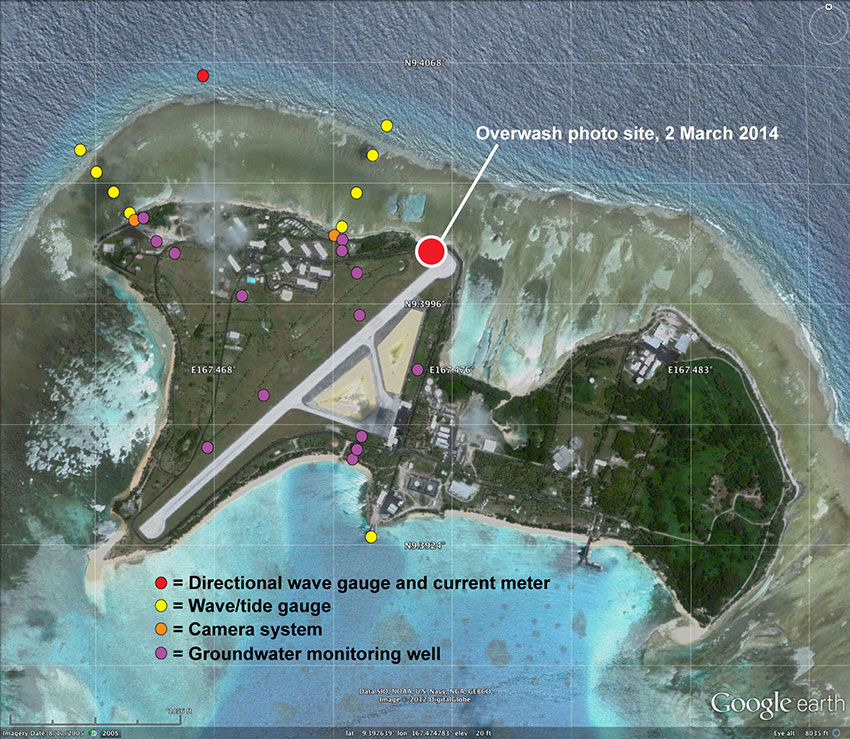
We deployed a directional acoustic wave gauge and current profiler (red dot) on the lower fore reef to get offshore water levels and incident directional wave spectra [incoming (incident) waves have energy in different periods (1/frequency, related to wavelength) and directions (spectra)].
Using Differential Global Positioning System (DGPS), we deployed and accurately located eight wave/tide gauges in two cross-shore transects (yellow dots) to collect tide and wave data and wave-driven water levels across the reef.
We deployed similar instruments in the lagoon (single yellow dot) and tied them into our DGPS network in order to provide a local tidal datum (the only tide gauge gauge in the Republic of the Marshall Islands is on Kwajalein Island) and understand cross-island water level gradients for groundwater modeling.
We deployed four time-lapse digital camera systems (orange dots) to correlate offshore and reef flat wave and tide data to wave-driven water levels up the shoreface.

An individual lidar scan on Roi-Namur Island, Kwajalein Atoll, shows the high-resolution point cloud of data generated by the sensor that can clearly map palm trees and their individual palm fronts, which are on the order of just a few centimeters across. [Larger version]
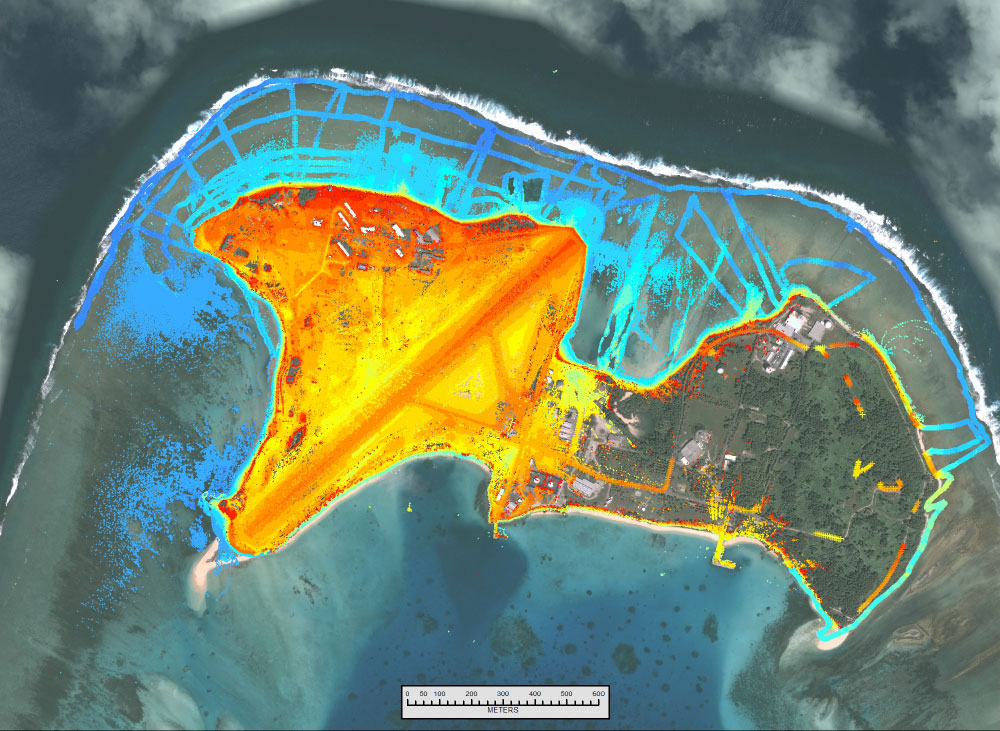
Map shows digital elevation data collected using DGPS and terrestrial lidar overlying a DigitalGlobe image of Roi-Namur Island and the adjacent reef flats on Kwajalein Atoll. The blues denote lower elevations (near lower-low water level) whereas the reds are higher elevations. [Larger version]
We digitized soundings of NOAA and US Navy bathymetric maps of Kwajalein Atoll, that were not previously available in digital format.
We have collected high-resolution terrestrial lidar and DGPS, with sub-centimeter-scale accuracy. This helped create a digital elevation model (DEM) of the island and adjacent reef. Bathymetric surveys are currently being processed by NOAA.
Sensors (water level, temperature, and salinity) are installed and collecting data in temporary and previously existing wells.
Temporary piezometers are installed to complement existing wells.
Surface water and groundwater samples are collected for trace metal/nutrient/carbon geochemistry.
222Rn time-series data are collected from groundwater and surface water.
Temperature time-series records are collected to derive 1-D groundwater transport.

USGS technician installs a temporary groundwater well on the beach on Roi-Namur Island, November 2103. Instruments within the well continuously measure groundwater levels, salinity, temperature, and barometric pressure.
[Larger version]

High tide at a groundwater sampling site on Roi-Namur Island, November 2013. [Larger version]
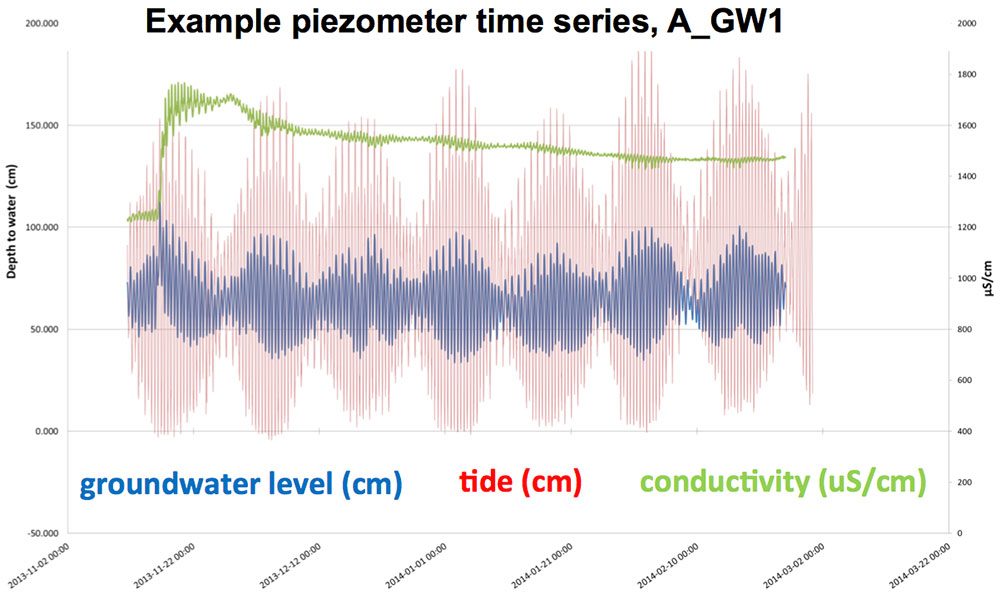
Pre-overwash time-series data from a groundwater well. Over this four-month time span, groundwater levels (in blue) expectedly responded to tidal fluctuations (in red). Specific conductivity (a proxy of salinity) in micro-siemens (µS) per centimeter is shown in green. These data were downloaded on March 2, 2014, and do not record the overwash that occurred later that day; the effects of that event will be evident in the next set of data, scheduled for download in several months. [Larger version]
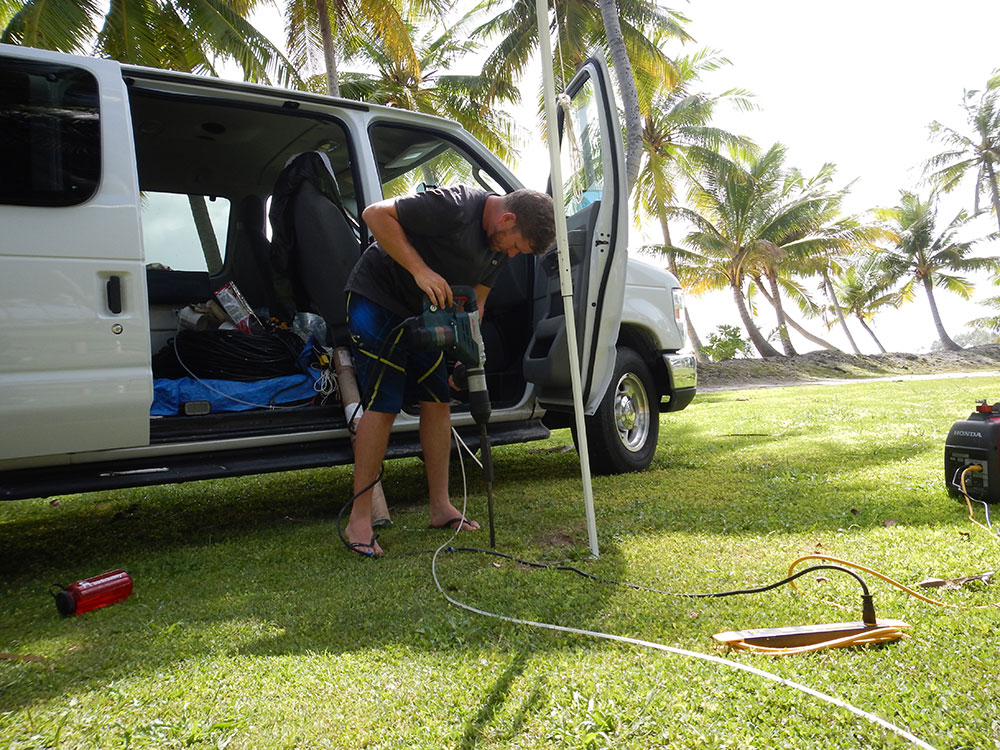
The drill vibrates a point well screen down to a specific horizon to sample groundwater for selected water-quality parameters (nutrients, trace elements, carbon isotopes).
[Larger version]
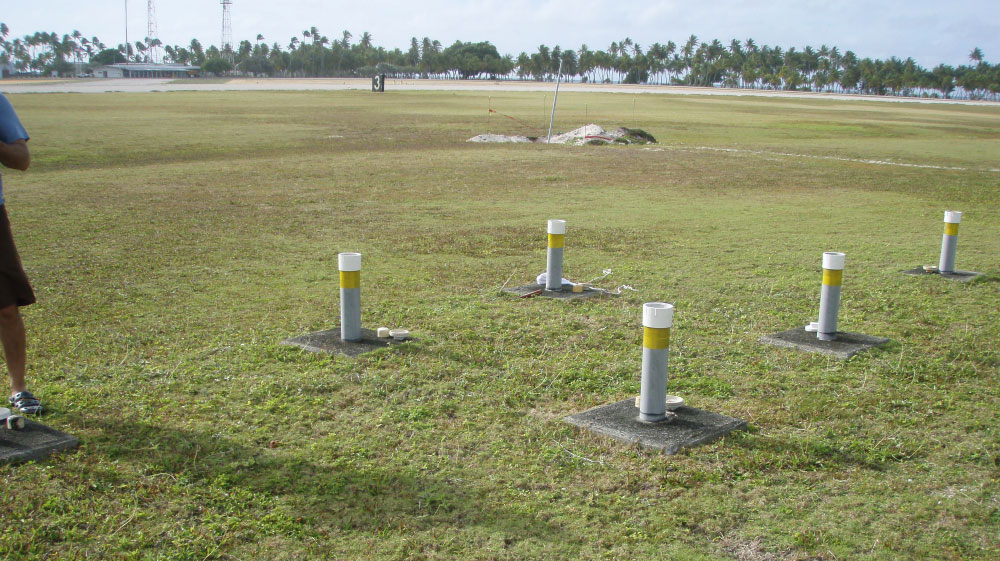
Wells installed with water level, temperature, and salinity instruments. [Larger version]
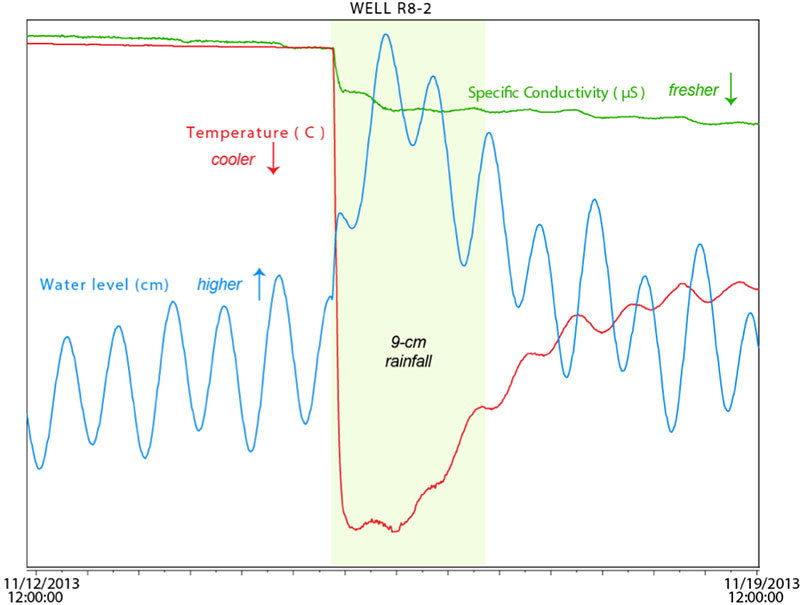
Graph (from Nov. 12, 12:00pm to Nov. 19, 12:00pm, 2013) shows water-level, temperature, and salinity readings from a well, and the response to 9 centimeters of rainfall Nov. 15-16, 2013 (light-green shaded section, center). [Larger version]
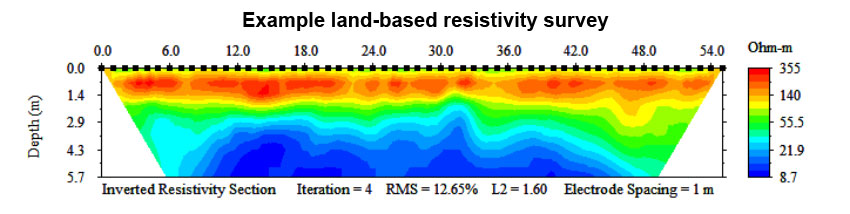
Below, an example of an electrical resistivity survey shows the depth of the freshwater lens (reds and orange) that sits on top of seawater (blues); freshwater is less conductive (more resistive) to the electrical input; seawater is more conductive (less resistive).
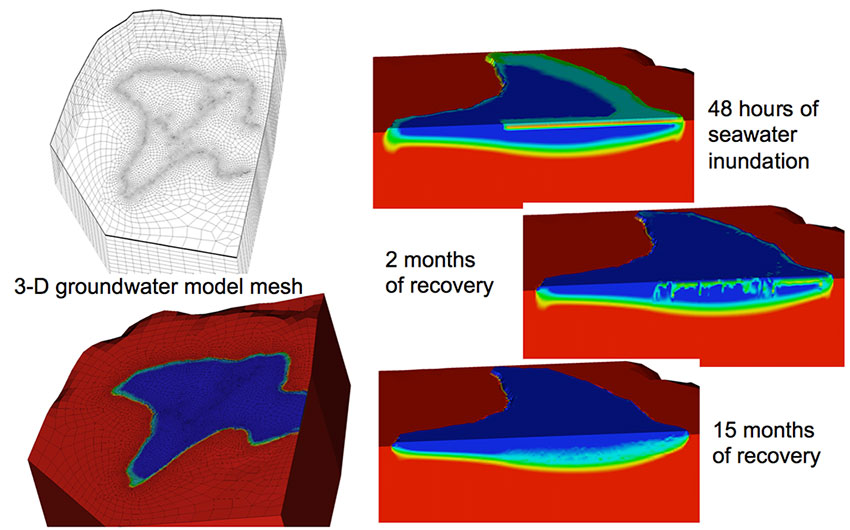
Below, is the groundwater model mesh (upper left) for Roi-Namur Island and its initial state (lower left; saline ocean waters in red and the island's freshwater lens in blue). The subplots on the right show a modeled overwash event from the right side (red and greens), followed by the seawater settling down through the freshwater due to its greater density (middle), and then the freshwater lens fully recovering as the saltwater mixes out at the bottom of the lens (bottom).
The numerical groundwater model will be used to characterize the recovery of the groundwater system for a range of inundation and climate-change conditions associated with selected management strategies. One management option to be evaluated is the “no action” alternative. The recovery and flushing of the groundwater system following inundation and overwash will then be controlled mainly by the groundwater-recharge rate (all other factors being equal), which likely will differ for current and future conditions, and by typical year-to-year climate variability. Other management options to be considered are to:
Although we will model the effects of climate change on the hydrologic budget, saltwater inundation, and overwash using global climate model (GCM) output, because of uncertainties, a range of conditions will be simulated and the most appropriate management strategy can be identified for the range of possible future climate and ocean conditions provided by the GCMs. The various management strategies to be considered will be developed in consultation with on-island personnel and stakeholders. This research will be conducted during the last year of the project.
