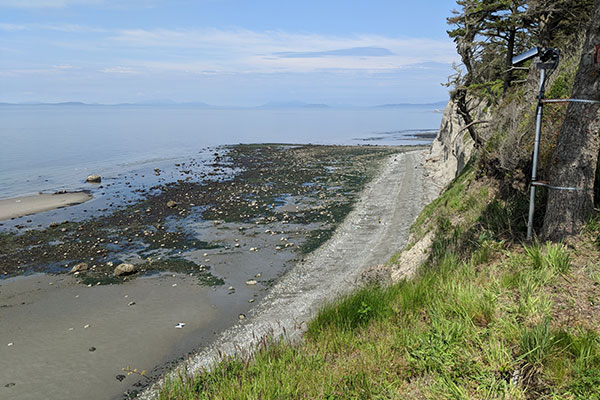
Remotely operated video cameras, mounted to a pole and secured to a tree, sit atop a high coastal bluff. Image sequences are used to measure storm water levels, waves, currents, and beach, and bluff changes to property, infrastructure, and habitats. [Larger version]
Video cameras installed by the USGS Remote Sensing Coastal Change project overlook the coast on Whidbey Island, Washington, about 25 miles north of Seattle. Whidbey and nearby islands have some of the highest rates of coastal-bluff retreat in Puget Sound. The video-based remote-sensing tools measure storm water levels, waves, and currents that affect beaches and bluffs. The USGS Coastal Habitats in Puget Sound and Coastal Climate Change Impacts teams are using the data to examine sediment movement and coastal processes that impact habitats and infrastructure. The research is important to advance the Puget Sound Coastal Storm Modeling System (PS-CoSMoS), which forecasts flooding due to storms and sea-level rise to inform resilience planning. The cameras are similar to systems installed in Florida and California. Learn more about these remote-sensing techniques. View images from video shot every half hour on Whidbey Island. Contact: Eric Grossman, [email protected], 360-650-4697

Aerial photo showing the mouth of the Elwha River on September 26, 2013, while dam removal was underway. Aerial assistance by Lighthawk; plane piloted by Dr. Hunter Handsfield. Photo by Jeff Duda, USGS [Larger version]
The USGS has published a new Fact Sheet, “Science Partnership between U.S. Geological Survey and the Lower Elwha Klallam Tribe: Understanding the Elwha River Dam Removal Project.” Two large hydroelectric dams on the Elwha River in Washington State were removed in the period 2011–2014 to restore the river ecosystem and recover imperiled salmon populations. The new fact sheet summarizes findings by a multidisciplinary team of scientists from the Lower Elwha Klallam Tribe, the USGS, other agencies, universities, and non-governmental organizations who collected data before, during, and after dam removal. The 4-page fact sheet lists key lessons, details some impacts of dam removal on river sedimentation and the physical and biological makeup of the estuary and coast, and lists references with in-depth information.
Read more details about USGS studies on the Elwha River: “USGS science supporting the Elwha River Restoration Project.”
Contacts: Jeff Duda, [email protected], 206-526-2532; Jon Warrick, [email protected], 831-460-7569

Seafloor (dark gray) off the U.S. East Coast, showing areas of past landslides (blue). Underwater landslides are the primary source of potential tsunamis on this coast. Figure 1 from Preface to “Tsunami Hazard along the U.S. Atlantic Coast.” Courtesy of David Twichell, USGS. [Larger version]
A USGS-led special issue of Marine Geology received a most-cited certificate from the journal in May 2018. “Tsunami hazard along the U.S. Atlantic coast” (Marine Geology v. 264, no. 1–2) was published in 2009 and was among Marine Geology’s three most-cited special issues in 2016 and 2017. The U.S. East Coast is highly vulnerable to tsunami damage because major population centers and industrial facilities sit near the shoreline at low elevations. Scientists, engineers, and modelers joined forces to evaluate the causes of tsunamis that could affect this region. Although earthquakes trigger most Pacific and Indian Ocean tsunamis, the primary source of potential tsunamis on the U.S. Atlantic coast is submarine landslides—the main focus of the special issue. The volume was written largely by USGS scientists and edited by USGS research geophysicist Uri ten Brink. Contacts: Uri ten Brink, [email protected], 508-457-2310; Eric Geist, [email protected], 650-329-5457
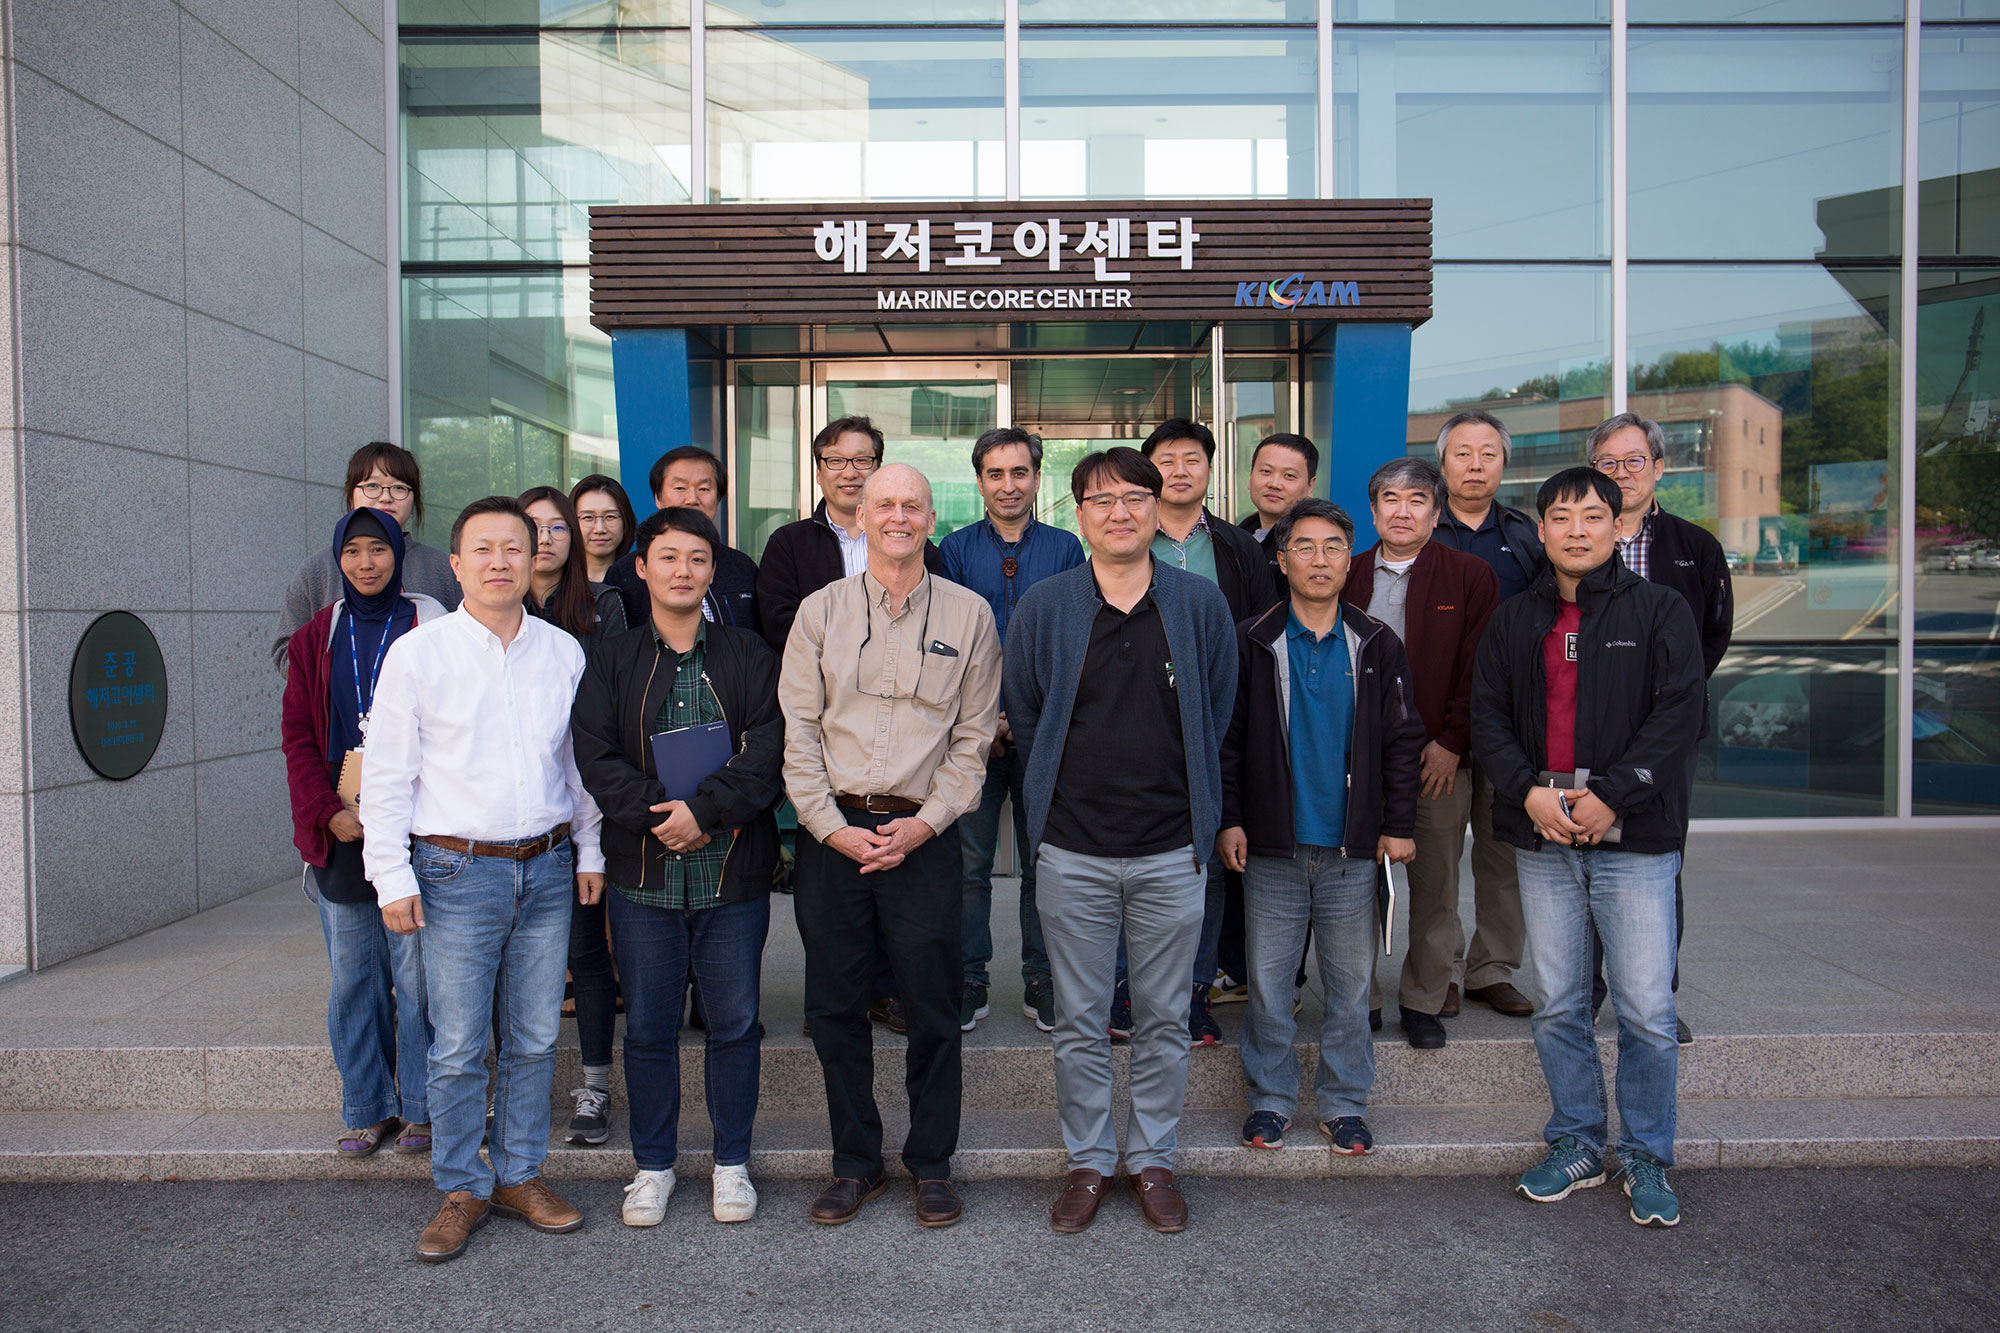
Sam Johnson (front row, third from left) with host Gee Soo Kong (front row, far left) and other KIGAM Petroleum and Marine Division staff, after one of Johnson’s seminars at KIGAM headquarters in Daejon, South Korea. [Larger version]
USGS research geologist Sam Johnson of the Pacific Coastal and Marine Science Center (PCMSC) made an invited visit to the Korea Institute of Geology and Mineral Industries (KIGAM) in Daejon, South Korea, on April 24–26. His host was Dr. Gee Soo Kong of the Petroleum and Marine Division, assisted by Drs. Deniz Cukur, Jae Hwa Jin, Kyong-O Kim, and Nam-Hyung Koo. Johnson presented two seminars: (1) The California Seafloor Mapping Program—History, Challenges, Applications, Lessons Learned; and (2) U.S. Geological Survey Marine Geohazards Research, Central and Northern California. He also participated in numerous stimulating discussions with KIGAM staff regarding seafloor mapping, active faults, and submarine landslides offshore of South Korea. KIGAM scientists have come to PCMSC several times, including a visit in March 2017, to discuss seafloor mapping and offshore hazards. Contact: Sam Johnson, [email protected], 831-460-7546
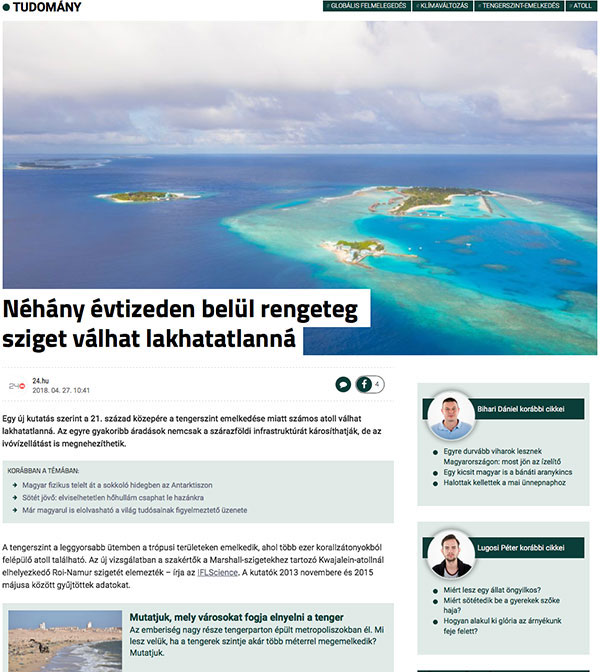
Hungarian digital news outlet 24.hu published an article about the new study on 27 April 2018. The headline reads: "Within a few decades, many islands may become uninhabitable."
A deluge of media coverage followed publication of a USGS-led study showing that sea-level rise and wave-driven flooding could make many low-lying atoll islands uninhabitable by the mid-21st century by contaminating freshwater aquifers and damaging infrastructure. The study appeared April 25 in Science Advances, and dozens of outlets reported it. Some of those are:
Overseas coverage included:
One science writer in the UK wrote a poem about the research. The U.S. Department of Defense provided most of the funding and will use the results to plan for sea-level rise impacts on military installations in the Pacific. Contact: Curt Storlazzi, [email protected], 831-460-7521
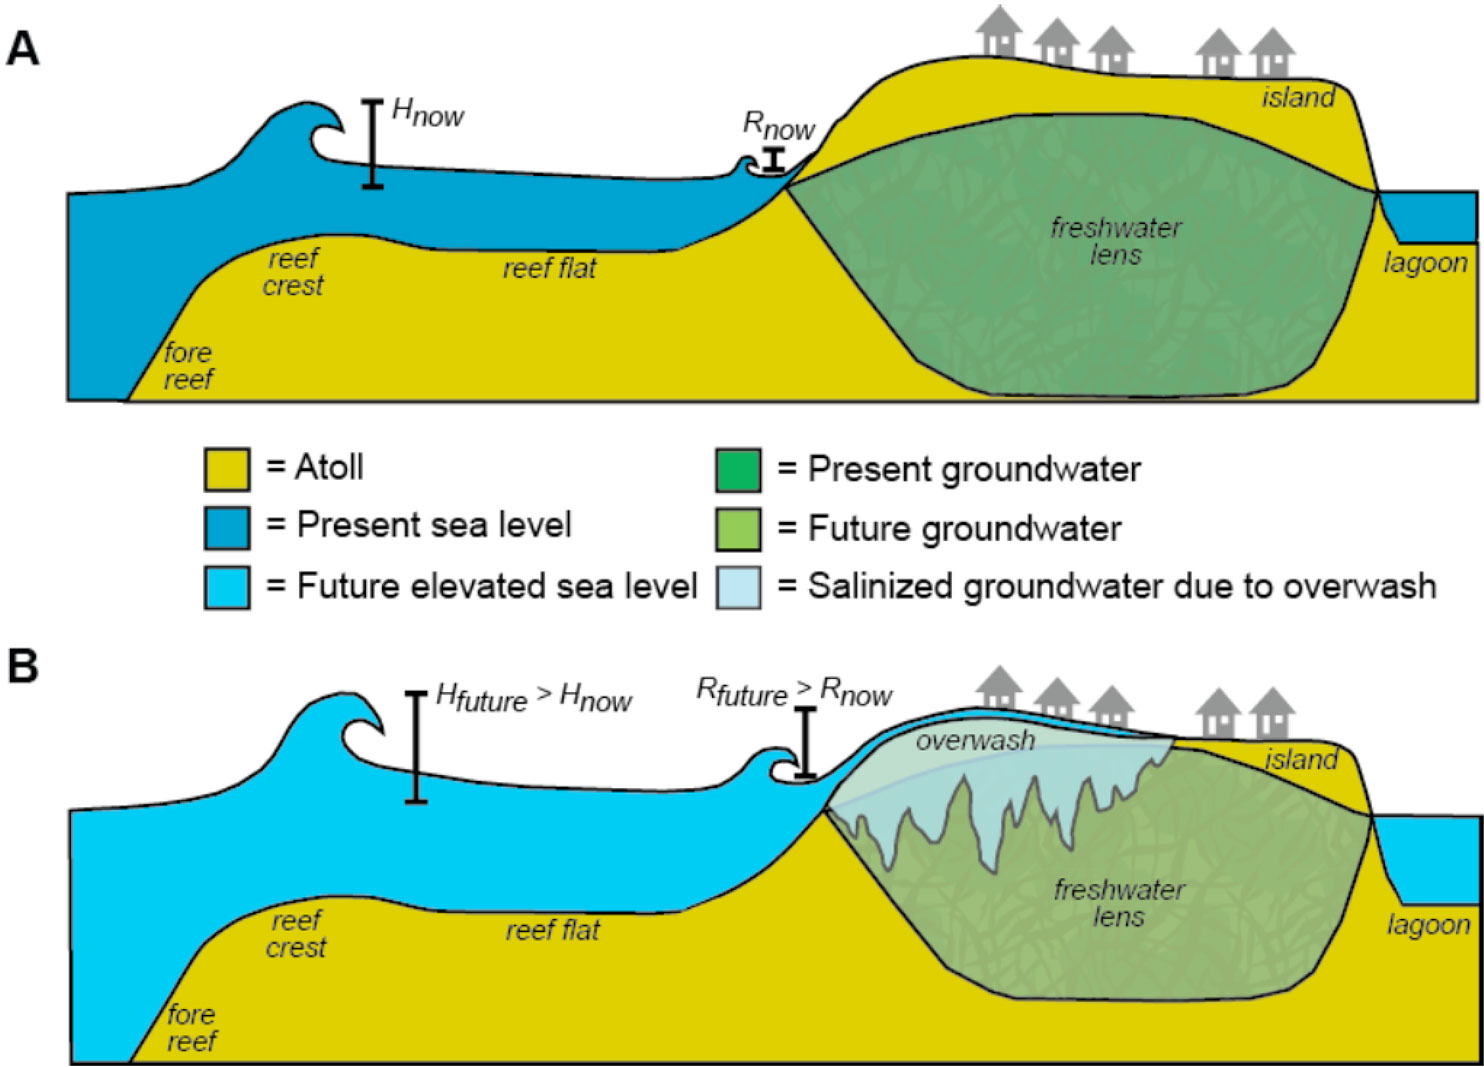
Conceptual diagram showing impact of sea-level rise and wave-driven flooding on atoll-island groundwater. (A) Current sea level. (B) Future sea level. Sea-level rise will allow for greater wave heights (H) and wave-driven runup (R), resulting in frequent overwash that will contaminate the atoll island’s freshwater lens. Note: Heights are exaggerated. [Larger version]
Sea-level rise and wave-driven flooding could introduce saltwater so frequently into atoll islands’ freshwater resources that many will be uninhabitable by the mid-21st century, according to a new study published in Science Advances. Scientists from the U.S. Geological Survey, Deltares, National Oceanic and Atmospheric Administration, and the University of Hawaiʻi at Mānoa focused fieldwork and model development on Roi-Namur Island on Kwajalein Atoll in the Republic of the Marshall Islands for this study. Researchers used several climate-change scenarios prescribed by the U.S. Department of Defense to project the impact of sea-level rise and wave-driven flooding on infrastructure and freshwater availability. Their findings can be applied to atolls around the world, most of which have, on average, even lower land elevations than Roi-Namur. The Department of Defense provided partial funding for the study and received results in an earlier report. Contact: Curt Storlazzi, [email protected], 831-460-7521
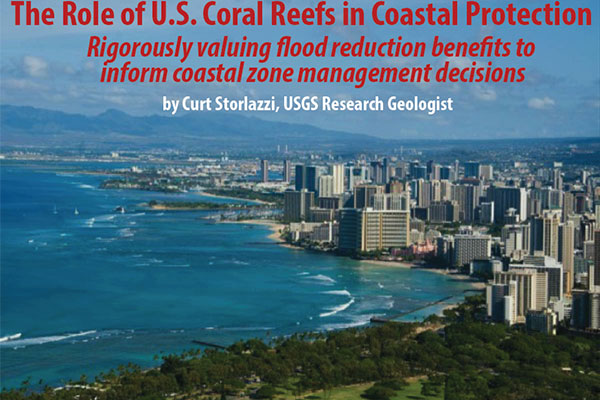
Flyer for “The Role of U.S. Coral Reefs in Coastal Protection—Rigorously valuing flood reduction benefits to inform coastal zone management decisions.” Click image for larger version of the flyer, or watch the recorded public lecture.
On Thursday, April 26, research geologist Curt Storlazzi of the USGS Pacific Coastal and Marine Science Center gave a public lecture on “The Role of U.S. Coral Reefs in Coastal Protection—Rigorously valuing flood reduction benefits to inform coastal zone management decisions.” Coral reefs provide a first line of defense against flooding by storm waves. Storlazzi and colleagues have identified characteristics—like the width of a reef and the roughness of its surface—that determine how well reefs function as a physical defense. USGS can provide information to guide restoration of coral reefs at a scale (tens of meters) that is useful to managers, thus helping to reduce risk and increase the resiliency of coastal communities. The lecture took place at the USGS Menlo Park campus at 7 p.m. Contact: Curt Storlazzi, [email protected], 831-460-7521
View the next scheduled USGS Evening Public Lecture in Menlo Park, or check out the archived recordings.
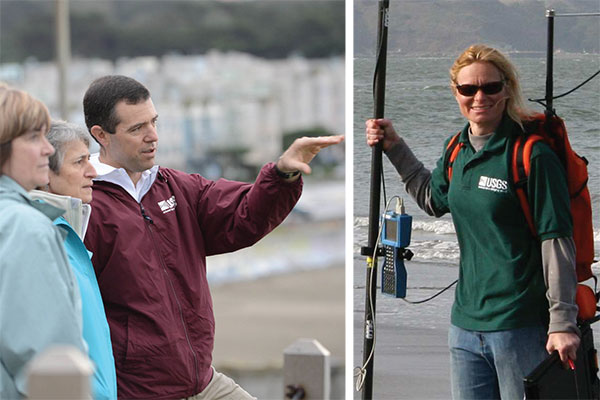
In photo on left, USGS research geologist Patrick Barnard (third from left) discussing beach erosion, with former DOI Secretary Sally Jewell (middle) and former Acting USGS Director Suzette Kimball (left), at Ocean Beach in San Francisco on December 18, 2014 (read more). In photo on right, USGS research oceanographer Li Erikson carries a GPS antenna and equipment for collecting beach profile data (read more).
Research geologist Patrick Barnard and research oceanographer Li Erikson have been recognized for leading efforts to better assess coastal vulnerability to flooding. They identified a critical societal issue, assembled a diverse team, and guided collaborations across scientific and organizational boundaries to produce the Coastal Storm Modeling System (CoSMoS), which forecasts coastal flooding under multiple storm conditions and a suite of sea-level rise scenarios. The scientists partnered with Point Blue Conservation Science and Our Coast Our Future to provide a web-based viewer for CoSMoS products, already being used for planning by several California communities. Barnard and Erikson have set the groundwork for sustained successful collaboration with Federal, State, academic, and private partners. They will be honored during a May awards ceremony at USGS headquarters in Reston, Virginia. Contact: Guy Gelfenbaum, [email protected], 831-460-7401
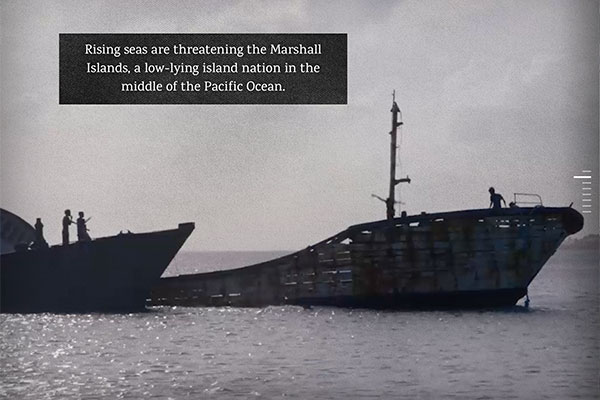
Screenshot from interactive documentary [View it here]
USGS research in the Republic of the Marshall Islands forms part of the scientific foundation of an interactive documentary released April 6 by PBS Frontline. “The Last Generation” profiles three children whose homeland in the Marshall Islands could become uninhabitable during their lifetimes. The producers incorporated information from interviews with research geologist Curt Storlazzi, who leads the USGS project “The Impact of Sea-Level Rise and Climate Change on Pacific Ocean Atolls that House Department of Defense Installations.” Studies by Storlazzi and his colleagues show that the combined effects of climate change—particularly sea-level rise, storm-wave overwash, and reduced rainfall—could make living and working on atoll islands in the Republic of the Marshall Islands and elsewhere nearly impossible as early as 2035. Contact: Curt Storlazzi, [email protected], 831-460-7521

Footprints in mud layer deposited on the sand at Miramar Beach in Montecito, California, by January 9 flood waters coming down San Ysidro Creek. Photo by Dan Hoover, USGS. [Larger version]
USGS oceanographer Dan Hoover explained how USGS coastal surveys are conducted and why they are important in a radio interview with NPR affiliate KCLU. KCLU was one of several outlets that reported on USGS surveys of beaches and the adjacent seafloor in Santa Barbara and Ventura counties. From March 27–30, USGS scientists measured beach topography and seafloor bathymetry to better understand long-term coastal changes. The study area included Montecito, California, which was devastated on January 9 by debris flows that killed 21 people. That storm provided the largest sediment input by far since the USGS began surveying the area twice yearly—every spring and fall—in 2005. Mapping results from these surveys are incorporated into models of future coastal change to help California communities plan to protect their coastlines. The Ventura County Reporter and ABC-affiliate KEYT also reported the surveys. Contact: Dan Hoover, [email protected], 831-460-7544
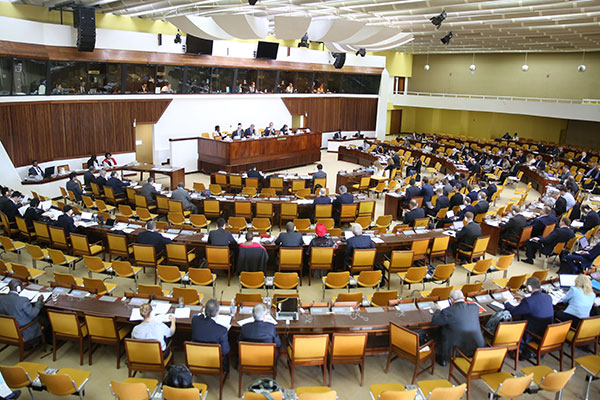
Bird's eye view of the ISA 24th Council. Photo by IISD/ENB | Francis Dejon [Larger version]
Oceanographer Amy Gartman joined two members of the U.S. State Department at the 24th session of the International Seabed Authority, the organization charged with implementing the Convention on the Law of the Sea, an international treaty governing use of the oceans and their resources. The U.S., which has not signed the convention, attends ISA sessions as an observer. The ISA Council met March 5–9 to further develop regulations for exploiting mineral resources on the international seabed—an area underlying much of the world’s oceans. As science advisor, Gartman helps the U.S. delegates understand the nature and locations of different types of seafloor mineral deposits, and what environmental protections might be needed if they are mined. Gartman succeeds USGS research geologist Jim Hein, a deep-ocean minerals expert who attended ISA sessions from 2000 to 2016 and still advises the State Department. Contact: Amy Gartman, [email protected], 831-460-7562
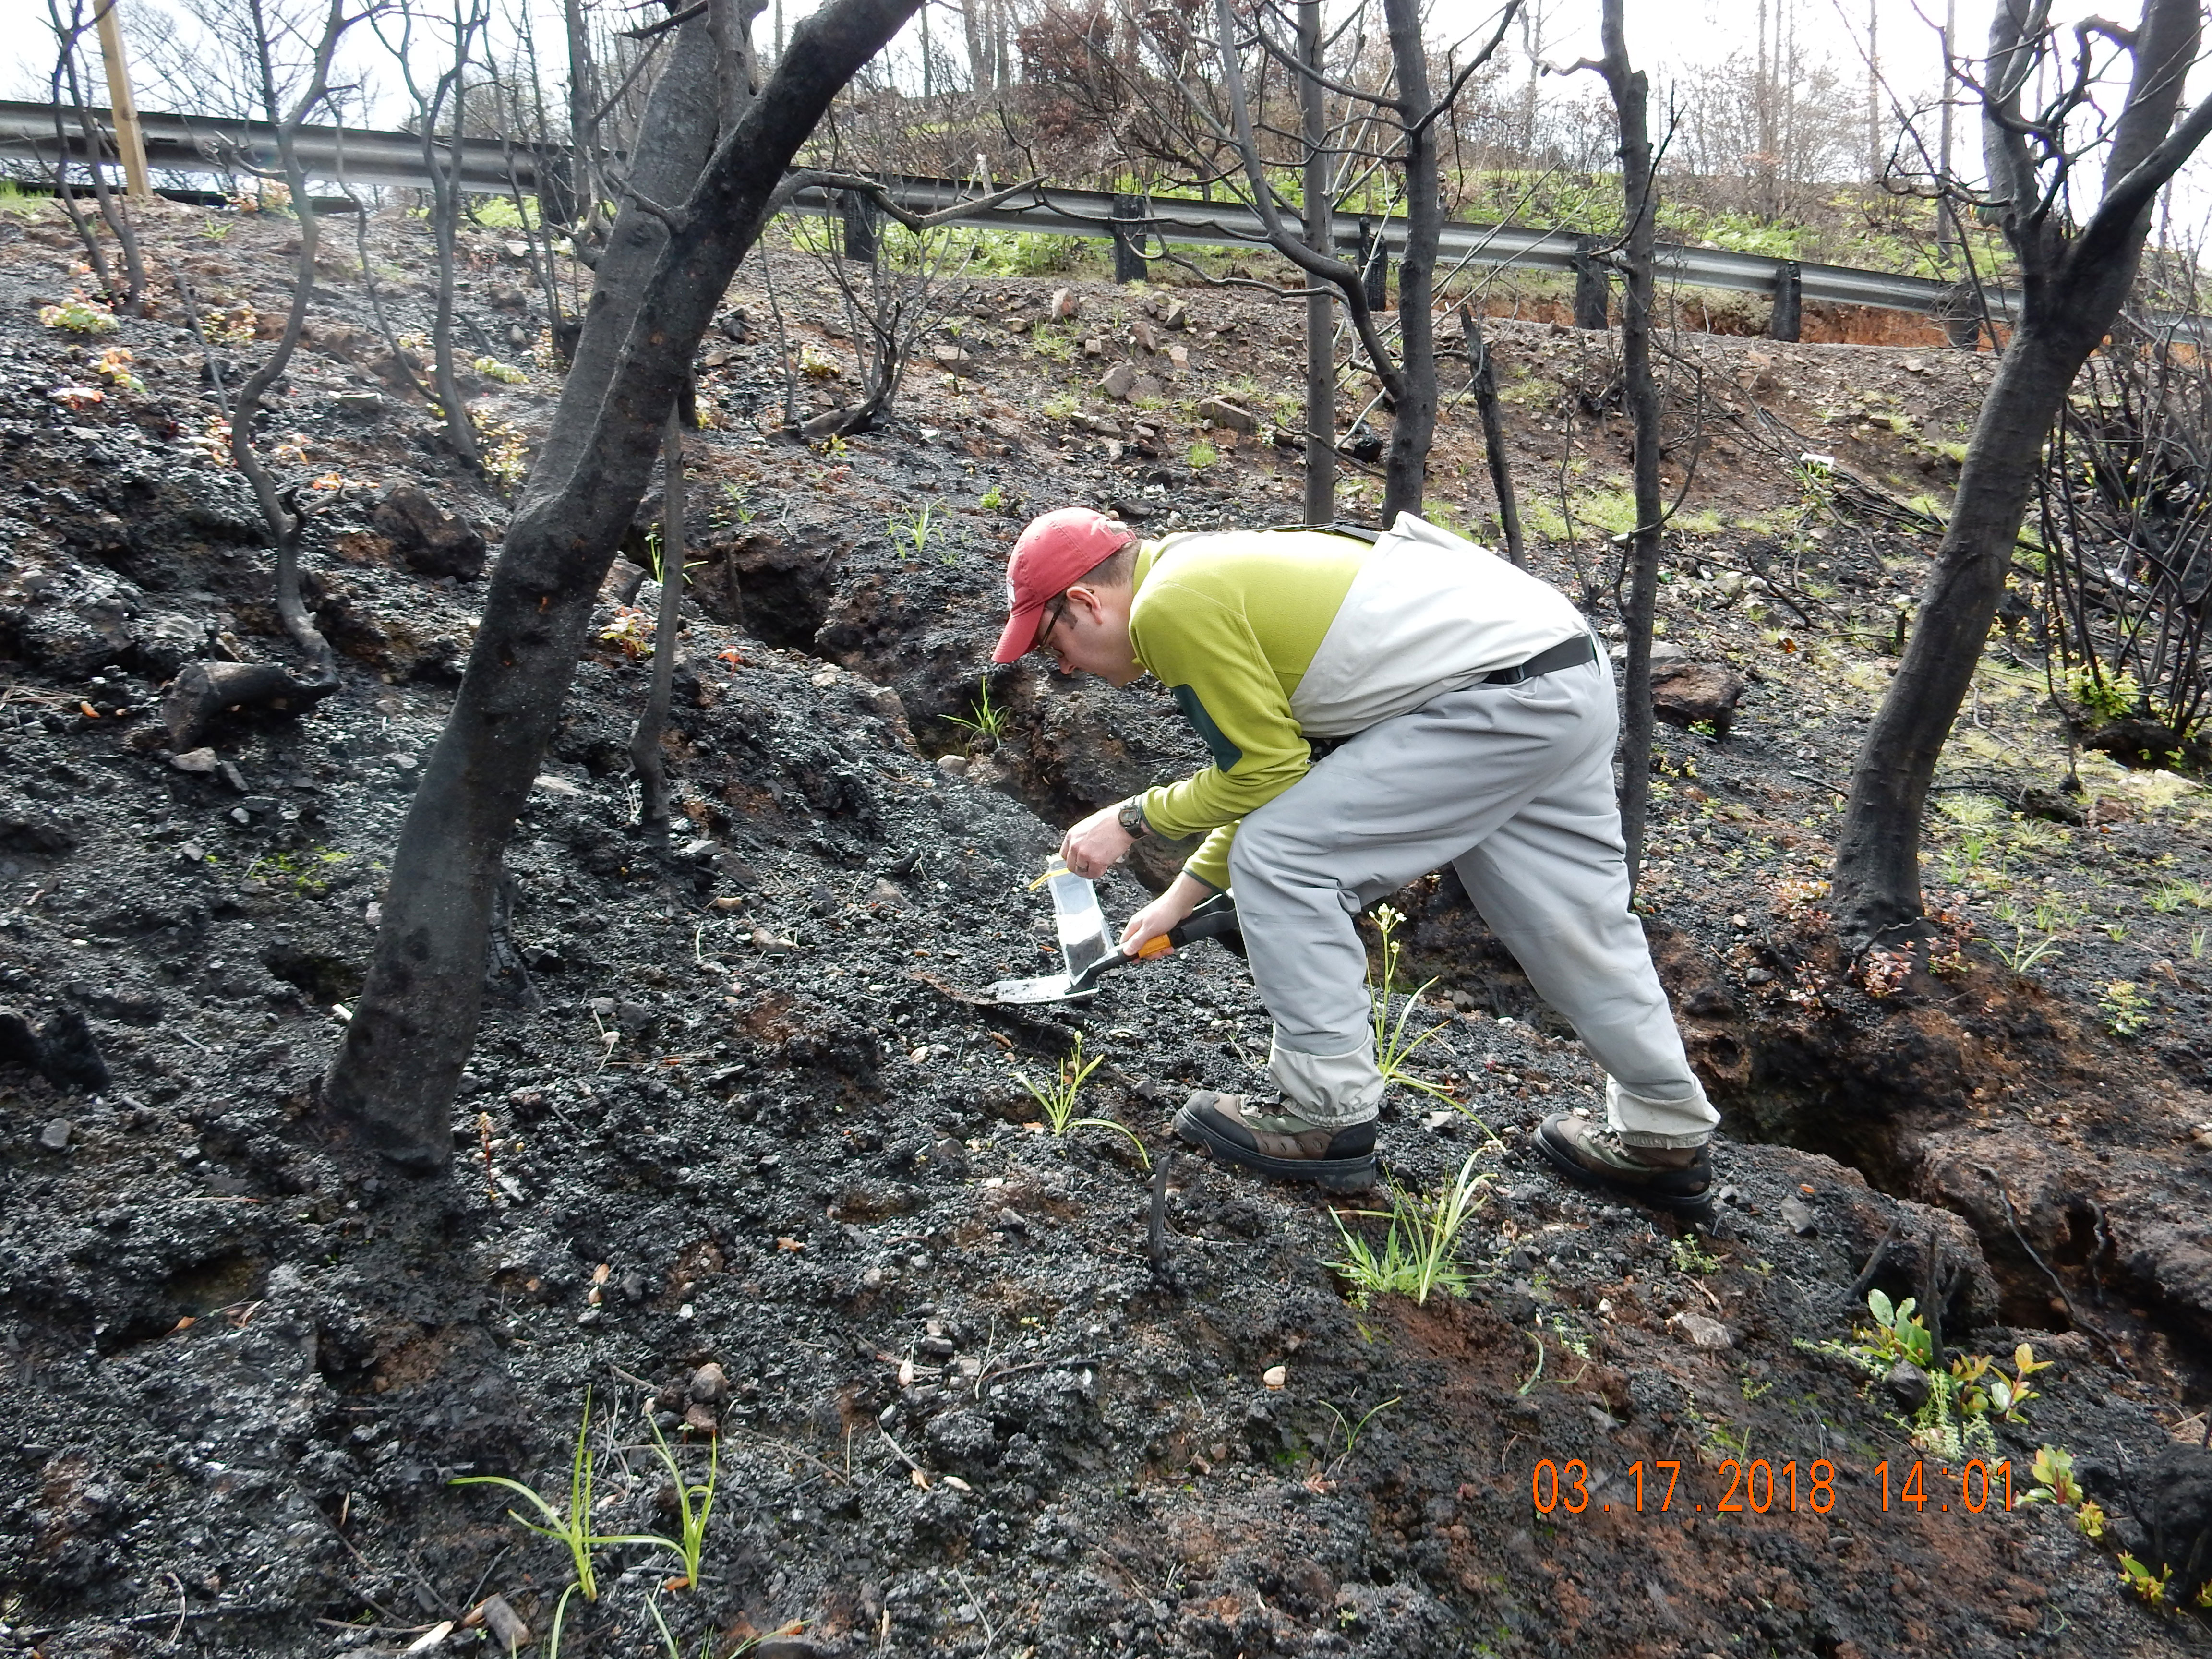
Brett Tipple (University of California, Santa Cruz) collects a sample of charcoal and soil adjacent to a gully forming on a hillslope above Sonoma Creek, which was burned by the Nuns wildfire in October 2017. [Larger version]
USGS research geologist Renee Takesue of the Pacific Coastal and Marine Science Center collected 20 sediment samples from Sonoma Creek and Napa River north of San Francisco Bay on March 17. Working with her was Brett Tipple, associate project scientist at the University of California, Santa Cruz. They will analyze the samples for sediment and contaminants released after the October 2017 Atlas and Nuns wildfires in northern California. Wildfires can exacerbate erosion and runoff of sediment and toxic debris. Contaminants delivered to San Francisco Bay with post-fire runoff could negatively impact San Pablo Bay National Wildlife Refuge and local marsh-restoration projects. Takesue and Tipple will use geochemical fingerprinting to track the dispersal of post-fire runoff in these sensitive nearshore environments. Contact: Renee Takesue, [email protected], 831-460-7594
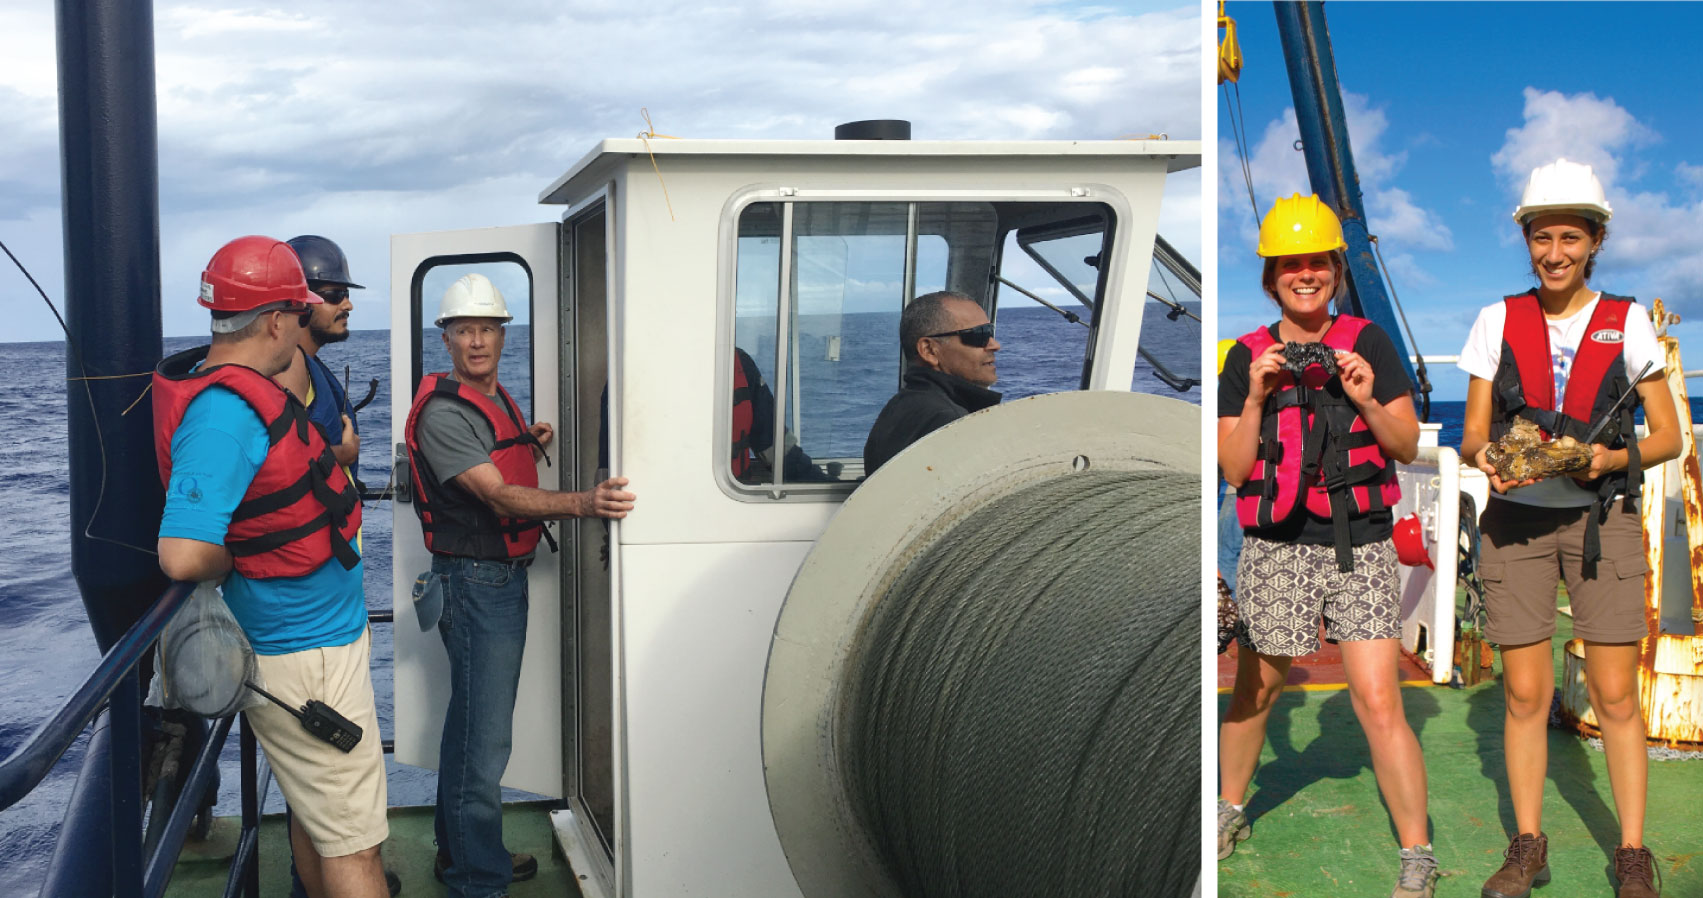
James Hein (white hardhat) monitors dredge operations from the winch shack and explains dredging techniques to Chief Scientist Professor Luigi Jovane (red hardhat) and the ship's crew. Photo credit: Kira Mizell, USGS. Right: Kira Mizell (left) and colleague Mariana Benites (University of São Paulo) pose with marine mineral samples after the seventeenth and final dredge of the cruise. Photo credit: Isobel Yeo, National Oceanography Centre, UK. [Larger version]
USGS scientists James Hein and Kira Mizell participated in a University of São Paulo research cruise to the western Rio Grande Rise, an underwater plateau in international waters of the Atlantic Ocean off Brazil. From 28 January to 21 February, participants mapped the seafloor, collected samples, and conducted lab studies to better understand the seafloor topography of the rise, its sedimentary history, and the processes that have formed mineral crusts rich in iron and manganese. These Fe-Mn crusts precipitate slowly from seawater, preserving a chemical history of ocean conditions and incorporating potentially economically important elements such as cobalt, tellurium, and platinum. Hein, who leads the USGS Global Ocean Minerals project, was invited to join the cruise to share his knowledge of the Fe-Mn crusts and techniques for collecting and interpreting them. Contact: James Hein, [email protected], 831-460-7419; Kira Mizell, [email protected], 831-460-7423.
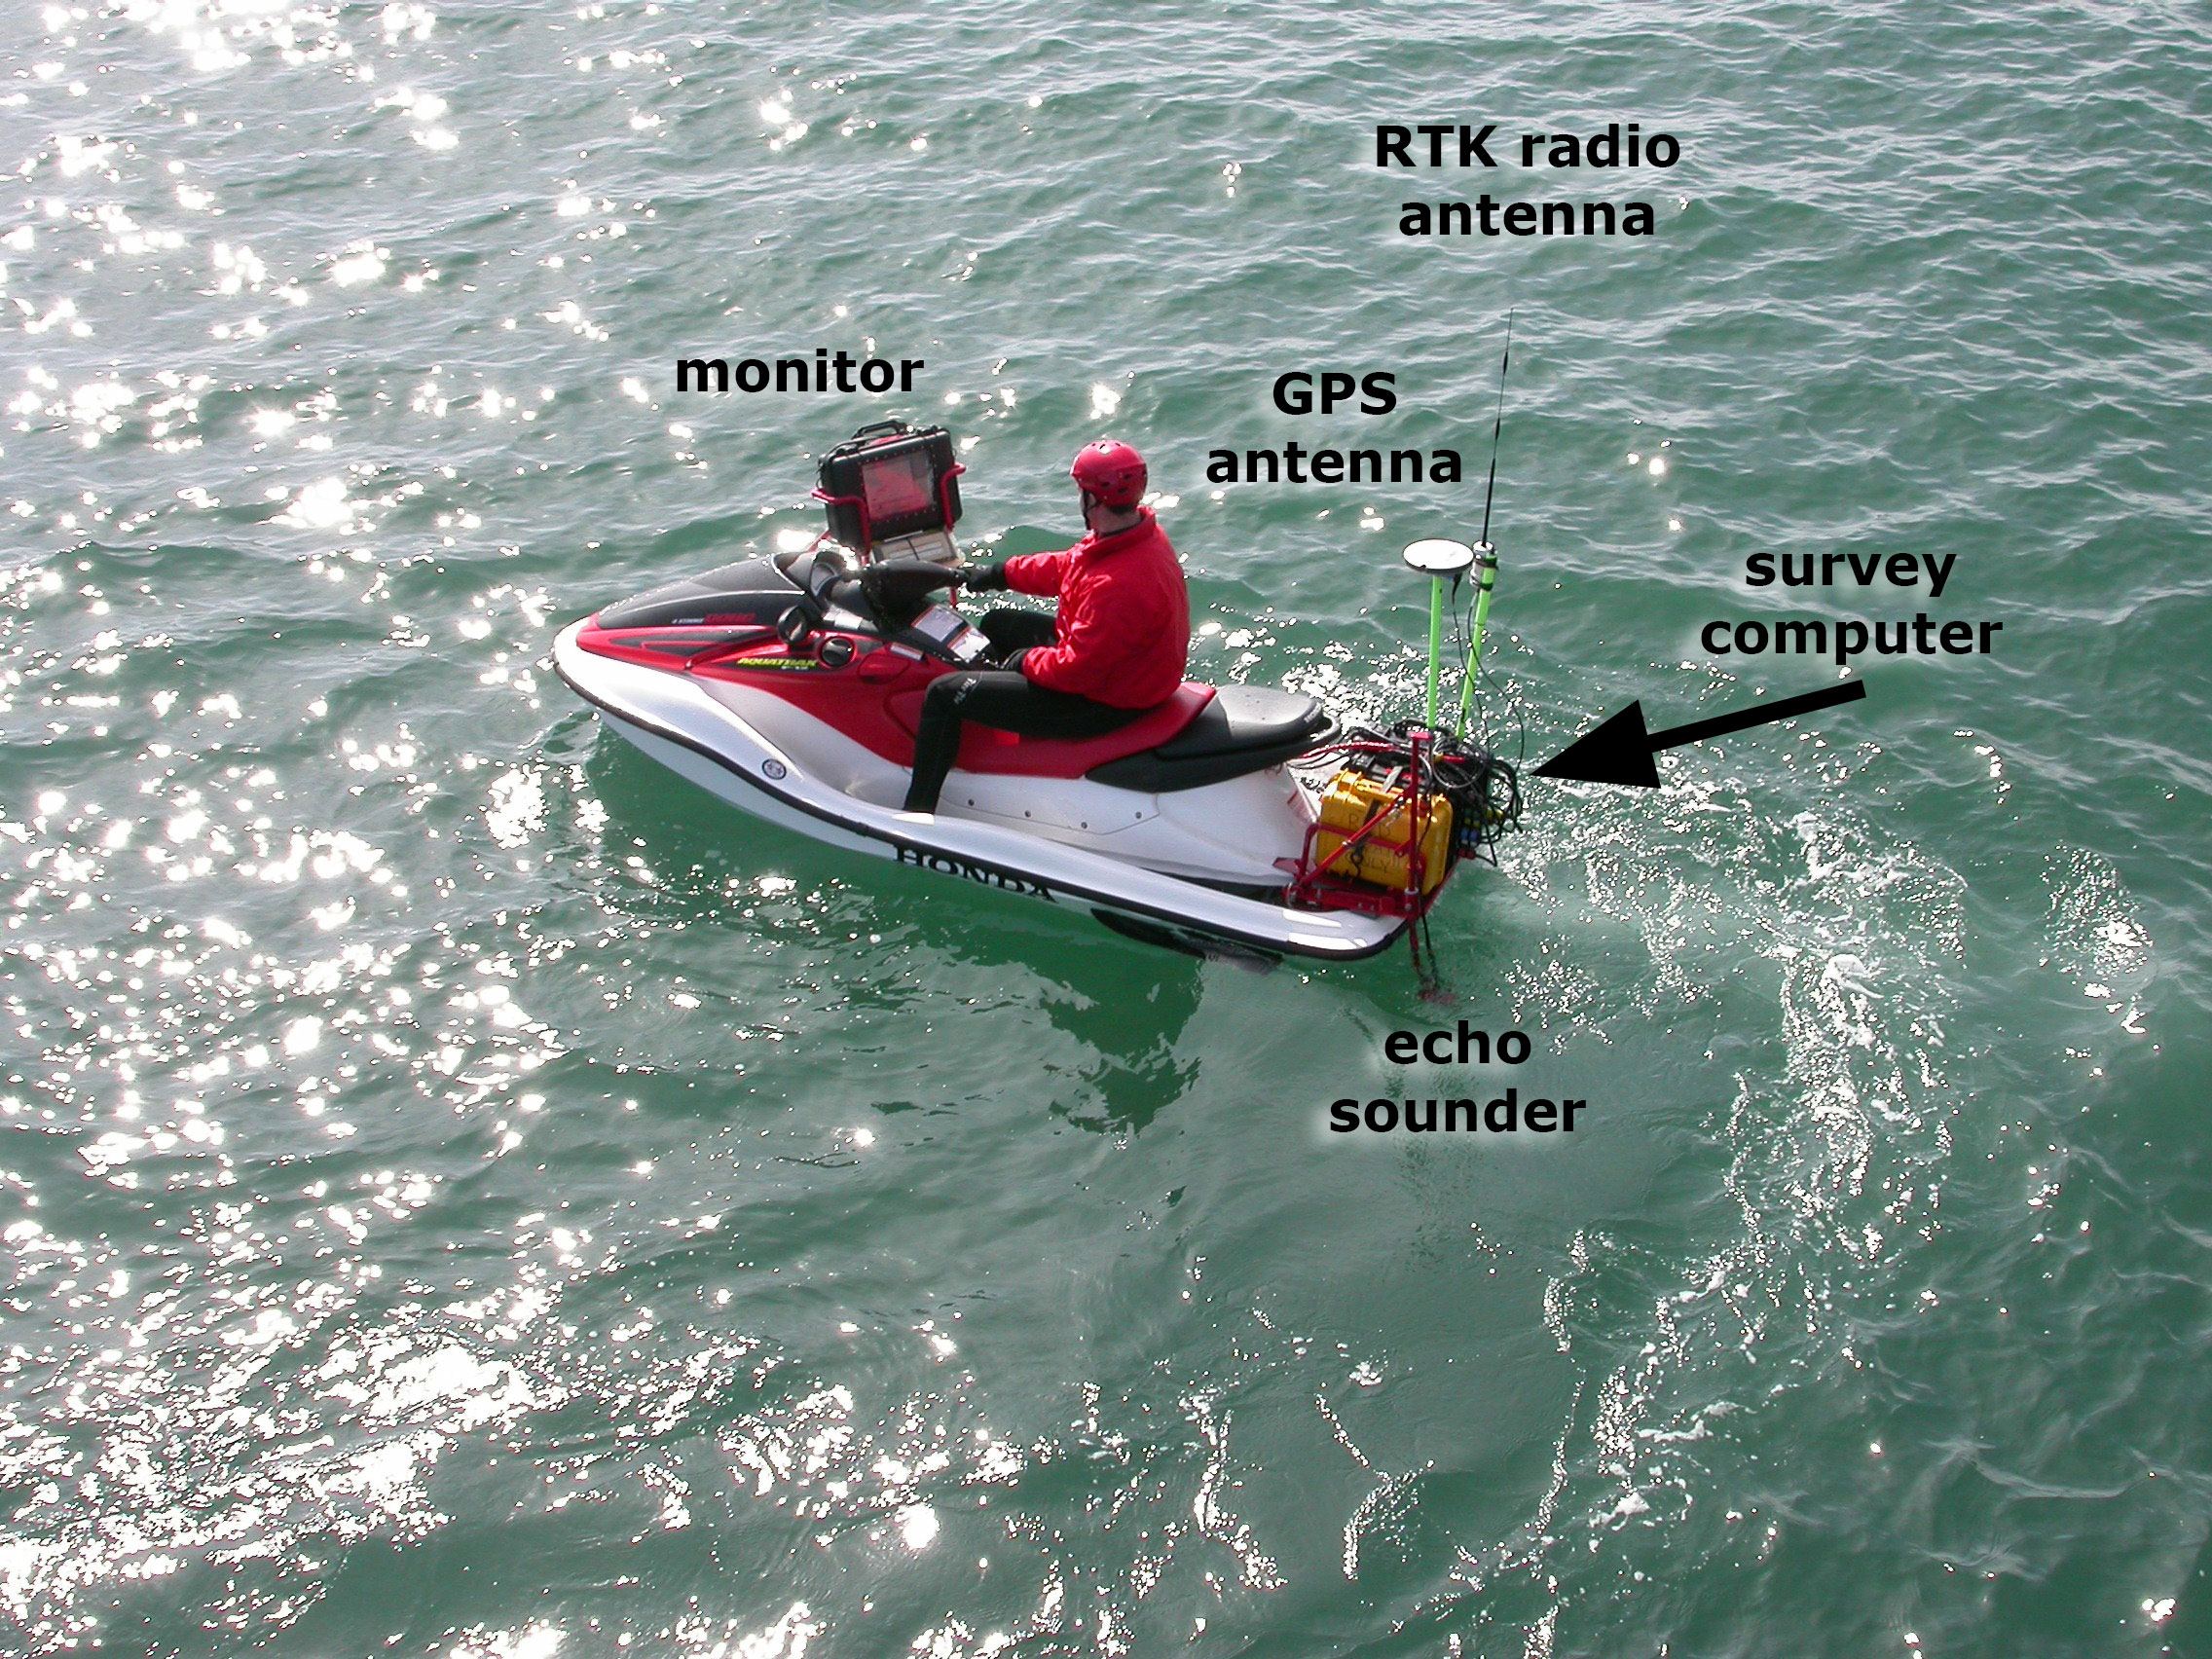
Personal watercraft equipped with GPS and sonar [Larger version]
Pacific Coastal and Marine Science Center researchers plan to survey selected beaches and parts of the shallow seafloor in Santa Barbara and Ventura counties from March 27-30. The study area includes Montecito, California, which was devastated during debris flows on January 9 that killed 21 people. PCMSC staff have measured beach topography and seafloor bathymetry in this area every spring and fall since 2005, to better understand long-term coastal changes. The researchers will use precision GPS units on backpacks and all-terrain vehicles, and personal watercraft equipped with GPS and sonar. This beach and nearshore survey will be the first since the debris flows reached the ocean, which were the first significant sediment input since 2005. For more information, contact Dan Hoover, [email protected], 831-460-7544.

Workshop participants
USGS and NASA held a joint workshop titled “From Cells to Satellites: Methane Biogeochemistry at Multiple Scales” on March 16 at NASA Ames Research Center in Mountain View, California. The two agencies conduct research on methane biogeochemistry in terrestrial, oceanic, and exoplanet environments. Participants from a wide range of specialties and programs shared information about their studies and discussed ways to integrate the strengths of USGS and NASA, advance cooperative research, and improve methane science nationwide. The keynote speakers were Kathy Hibbard, program manager for NASA’s Terrestrial Ecology Program, and Carolyn Ruppel, chief of the USGS Gas Hydrates Project. USGS scientists in Menlo Park, California, will begin re-locating to NASA Ames within a year, offering the opportunity to increase collaboration with NASA researchers. Contacts: Mark Waldrop, [email protected], 650-329-5005; Nancy Prouty, [email protected], 831-460-7526
 Masayuki Banno is spending a year-long sabbatical with the Pacific Coastal and Marine Science Center in Santa Cruz, California, collaborating with Patrick Barnard’s coastal-change group. Masayuki is a Visiting Scientist from Japan’s Port and Airport Research Institute (PARI), a government agency similar to USGS. Masayuki has been a research scientist with PARI since 2009. As a member of PARI’s Coastal and Estuarine Sediment Dynamics Group, he studies short-term beach response to waves, as well as processes that drive long-term coastal change. Masayuki received his Ph.D. from Kyushu University. In 2015, he received the Best Paper Award from the Coastal Engineering Committee of the Japan Society of Civil Engineers. Masayuki is working with Barnard’s team and their data sets to further develop and test his shoreline-change model. He and his family will be in Santa Cruz until September. Contact: Patrick Barnard, [email protected], 831-460-7556
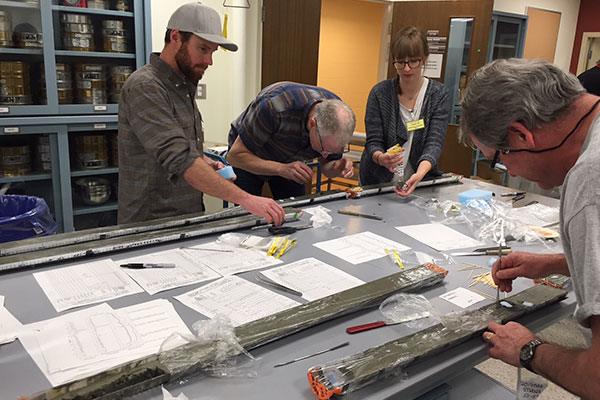
(Left to right) Danny Brothers (USGS Pacific Coastal and Marine Science Center [PCMSC]), Peter Haeussler (USGS Alaska Science Center), Maureen Walton (PCMSC), and Jamie Conrad (PCMSC) select sediment samples from cores collected along the Queen Charlotte-Fairweather fault. Photo credit: Amy East, USGS [Larger version]
USGS scientists and colleagues from the Geological Survey of Canada (GSC), University of Calgary, Sitka Sound Science Center, and U.S. Forest Service spent a week in February at GSC laboratories in British Columbia investigating earthquake hazards posed by the Queen Charlotte-Fairweather fault. They examined dozens of sediment cores collected during a September 2017 research cruise along the fault, which ruptured in at least six major earthquakes during the past century. GSC personnel have spent months analyzing the sediment cores’ physical properties; the group that met in February extracted nearly 500 sediment samples to be dated using radiocarbon analysis and other methods. Knowing ages of sediment layers will help the scientists analyze recurrence intervals of earthquakes and submarine landslides to better estimate quake and tsunami hazards associated with the fault. Contacts: Amy East, [email protected], 831-460-7533; Danny Brothers, [email protected], 831-460-7460
Andrew Pomeroy in Mauritius in 2017, working with collaborators at the University of Mauritius to establish a reef-to-shoreline project for investigating coastline erosion. Photo credit: Gundula Winter, University of Western Australia
The Pacific Coastal and Marine Science Center (PCMSC) in Santa Cruz, California, recently welcomed Andrew Pomeroy, a Fulbright scholar from Australia who will spend approximately 6 months here conducting research on sediment movement in coral reef systems. Andrew is a coastal oceanographer and engineer from the Indian Ocean Marine Research Centre in Perth, where he has a joint appointment with the University of Western Australia (UWA) and the Australian Institute of Marine Science. His research interests include the interaction of waves, currents, and sediment with benthic communities, such as sea-grass meadows, aquaculture farms, and reef ecosystems. Andrew’s USGS host is research oceanographer Curt Storlazzi, who leads PCMSC’s Coral Reef Project and worked with Andrew in 2013 on an extensive field campaign by USGS and UWA scientists at Australia’s Ningaloo Reef. Contact: Curt Storlazzi, [email protected], 831-460-4748
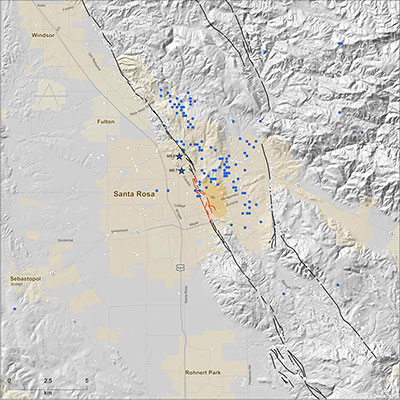
Shaded relief image of the Santa Rosa area showing active faults (black lines) and the detailed rupture pattern of the Rodgers Creek Fault where it crosses central Santa Rosa (in red). The orange, bean-shaped area represents the dense, magnetic body of rock on the east side of the fault beneath Santa Rosa. This body of rock may be largely responsible for the pattern of surface faulting and may influence the distribution of small earthquakes (white and blue circles, blue for 1969 aftershocks) and the occurrence of the damaging 1969 earthquakes (approximately located by blue stars). [Larger version]
On February 21, the Santa Rosa Press Democrat published an article about what Sonoma County residents can expect from a significant earthquake on the San Andreas or Hayward/Rodgers Creek fault. USGS scientists Janet Watt (research geophysicist with Coastal and Marine Geology Program) and Suzanne Hecker (research geologist with Earthquake Hazards Program) provided information to the article’s author, reporter Stephen Nett. Hecker led a team that used laser-based mapping to confirm that the Rodgers Creek fault runs beneath the center of Santa Rosa. Watt led a team that discovered a link between the Hayward and Rodgers Creek faults, increasing the possibility that the two faults could rupture together and produce a larger earthquake than either fault alone. Contact: Janet Watt, [email protected], 831-460-7565
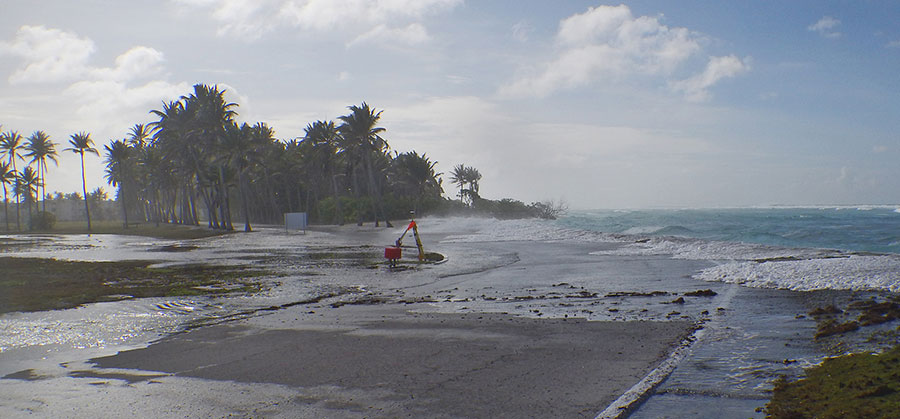
Above: Waves wash over a road on Roi-Namur Island. Photo by Peter Swarzenski, USGS [Larger version]
| Living and working on the Pacific islands hosting a key missile tracking site soon could be almost impossible due to the impacts of climate change. In a report requested by the U.S. Department of Defense (DOD), the USGS and partners forecast that the “tipping point” – the time at which potable groundwater on Roi-Namur Island will be unavailable due to wave-driven flooding – is projected to be reached around the year 2035 for the most extreme scenario.
“Buildings, roads, and airports will be swamped by storm waves annually,” said lead author Dr. Curt Storlazzi, a USGS research geologist. “Yearly flooding by seawater, combined with slightly reduced rainfall, will result in the islands on Kwajalein Atoll not having a reliable natural source of fresh water. In the worst-case scenario, without significant infrastructure investments, many low-lying Pacific coral islands could reach a tipping point, becoming uninhabitable and unusable, before mid-century.” The 138-page peer-reviewed report was the result of more than four years of research by scientists from the USGS, National Oceanic and Atmospheric Administration, Deltares research institute in the Netherlands, and the University of Hawaii. DOD asked for the analysis to better understand the impacts of climate change on critical facilities in the tropical Pacific, and to plan for adapting to these changes. The study took place on Roi-Namur Island in the western Pacific Ocean, part of Kwajalein Atoll in the Republic of the Marshall Islands. The atoll is home to the Reagan Test Site, a multi-billion-dollar facility used to track satellites, ballistic missiles, and missile defense systems. The researchers focused on forecasting “tipping points” - when the combination of sea-level rise, storm wave-driven overwash, and reduced rainfall becomes so frequent that existing buildings, fresh water sources, and other infrastructure become unsustainable. Since 1990, sea level in the western Pacific Ocean has risen two to three times faster than the global average. Adding storm waves means flooding on atoll islands could be worse and happen sooner. And climate change forecasts call for slightly reduced rainfall on the islands, making the fresh water problem even more challenging. The tipping point when natural fresh groundwater on Roi-Namur and adjacent islands will be unavailable could arrive before 2035 for the worst-case climate scenario. On top of that, most of Roi-Namur’s land could flood with seawater every year starting around 2060–another tipping point. And the tipping point for drinkable groundwater on most low-lying atoll islands world-wide could occur as early as the 2030s. The Defense Department chose three widely-accepted climate change and sea-level rise scenarios for the study. The first, based on reduced greenhouse gas emissions by mid-century, is known as RCP4.5. RCP8.5 assumes “business as usual” growth in carbon emissions. The third adds polar ice sheet collapse to RCP8.5 to create a worst-case scenario. Congress cited early results from this study in the National Defense Authorization Act for Fiscal Year 2018: “In the Marshall Islands, an Air Force radar installation built on an atoll at a cost of $1,000,000,000 is projected to be underwater within two decades.” Previous research showed that similar problems face other low-lying Pacific islands, including Laysan Island and Midway Atoll. “We’re working with the Defense Department on detailed follow-up studies to characterize the problems for defense sites on other islands,” said Storlazzi, “and potentially develop a real-time coastal flood impact warning system.” The full report, titled “The Impact of Sea-Level Rise and Climate Change on Department of Defense Installations on Atolls in the Pacific Ocean (RC-2334),” may be downloaded from the Defense Department at https://www.serdp-estcp.org/Program-Areas/Resource-Conservation-and-Resiliency/Infrastructure-Resiliency/Vulnerability-and-Impact-Assessment/RC-2334/ or http://bit.ly/2GvG0Pk. |
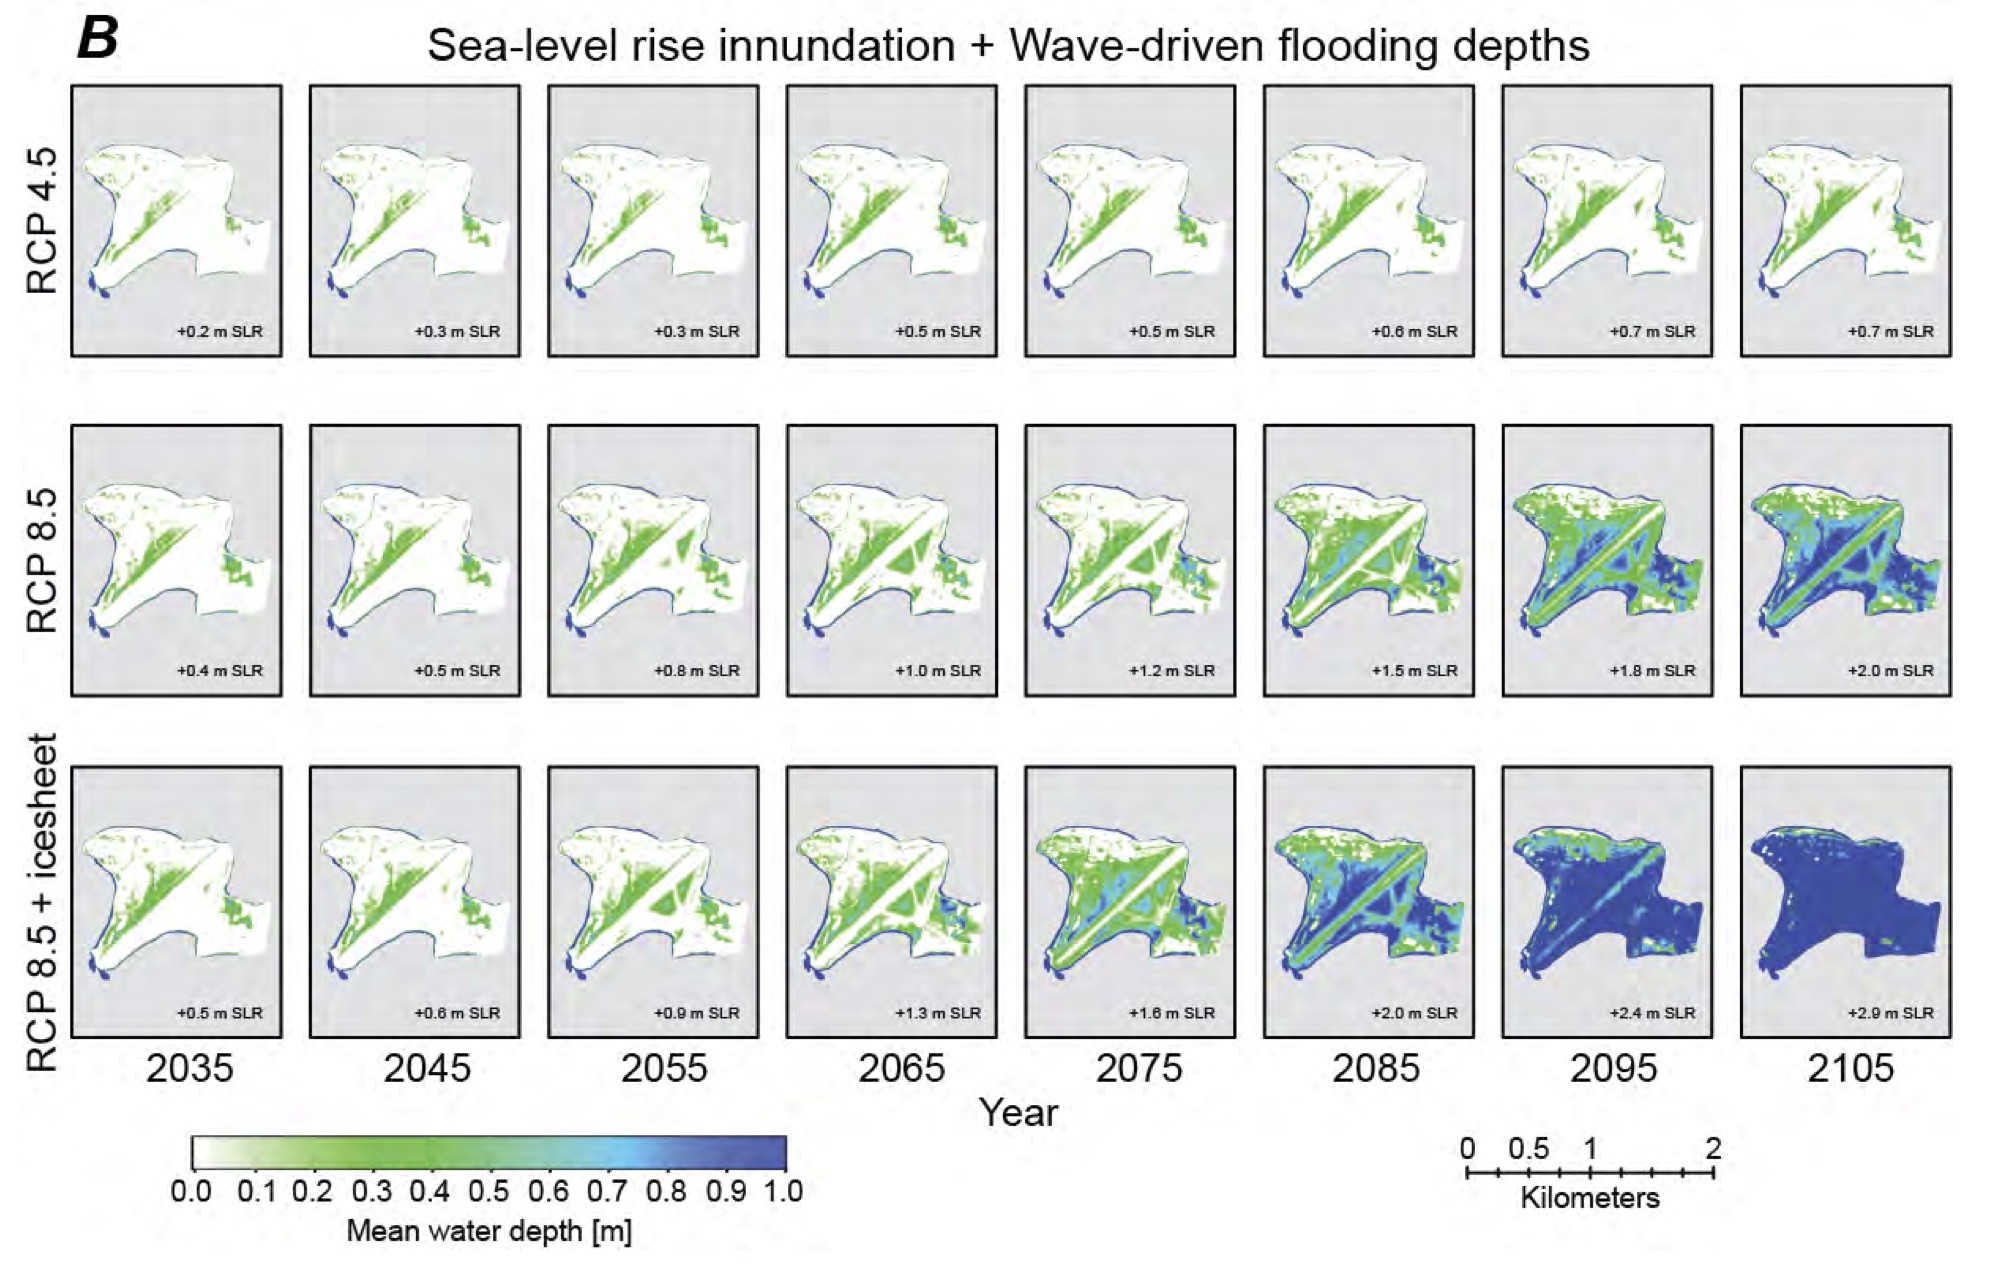
Above: Maps showing projected seawater depths over Roi-Namur island for different climate scenarios over time. Image from DOD SERDP report RC-2334. [Larger version] 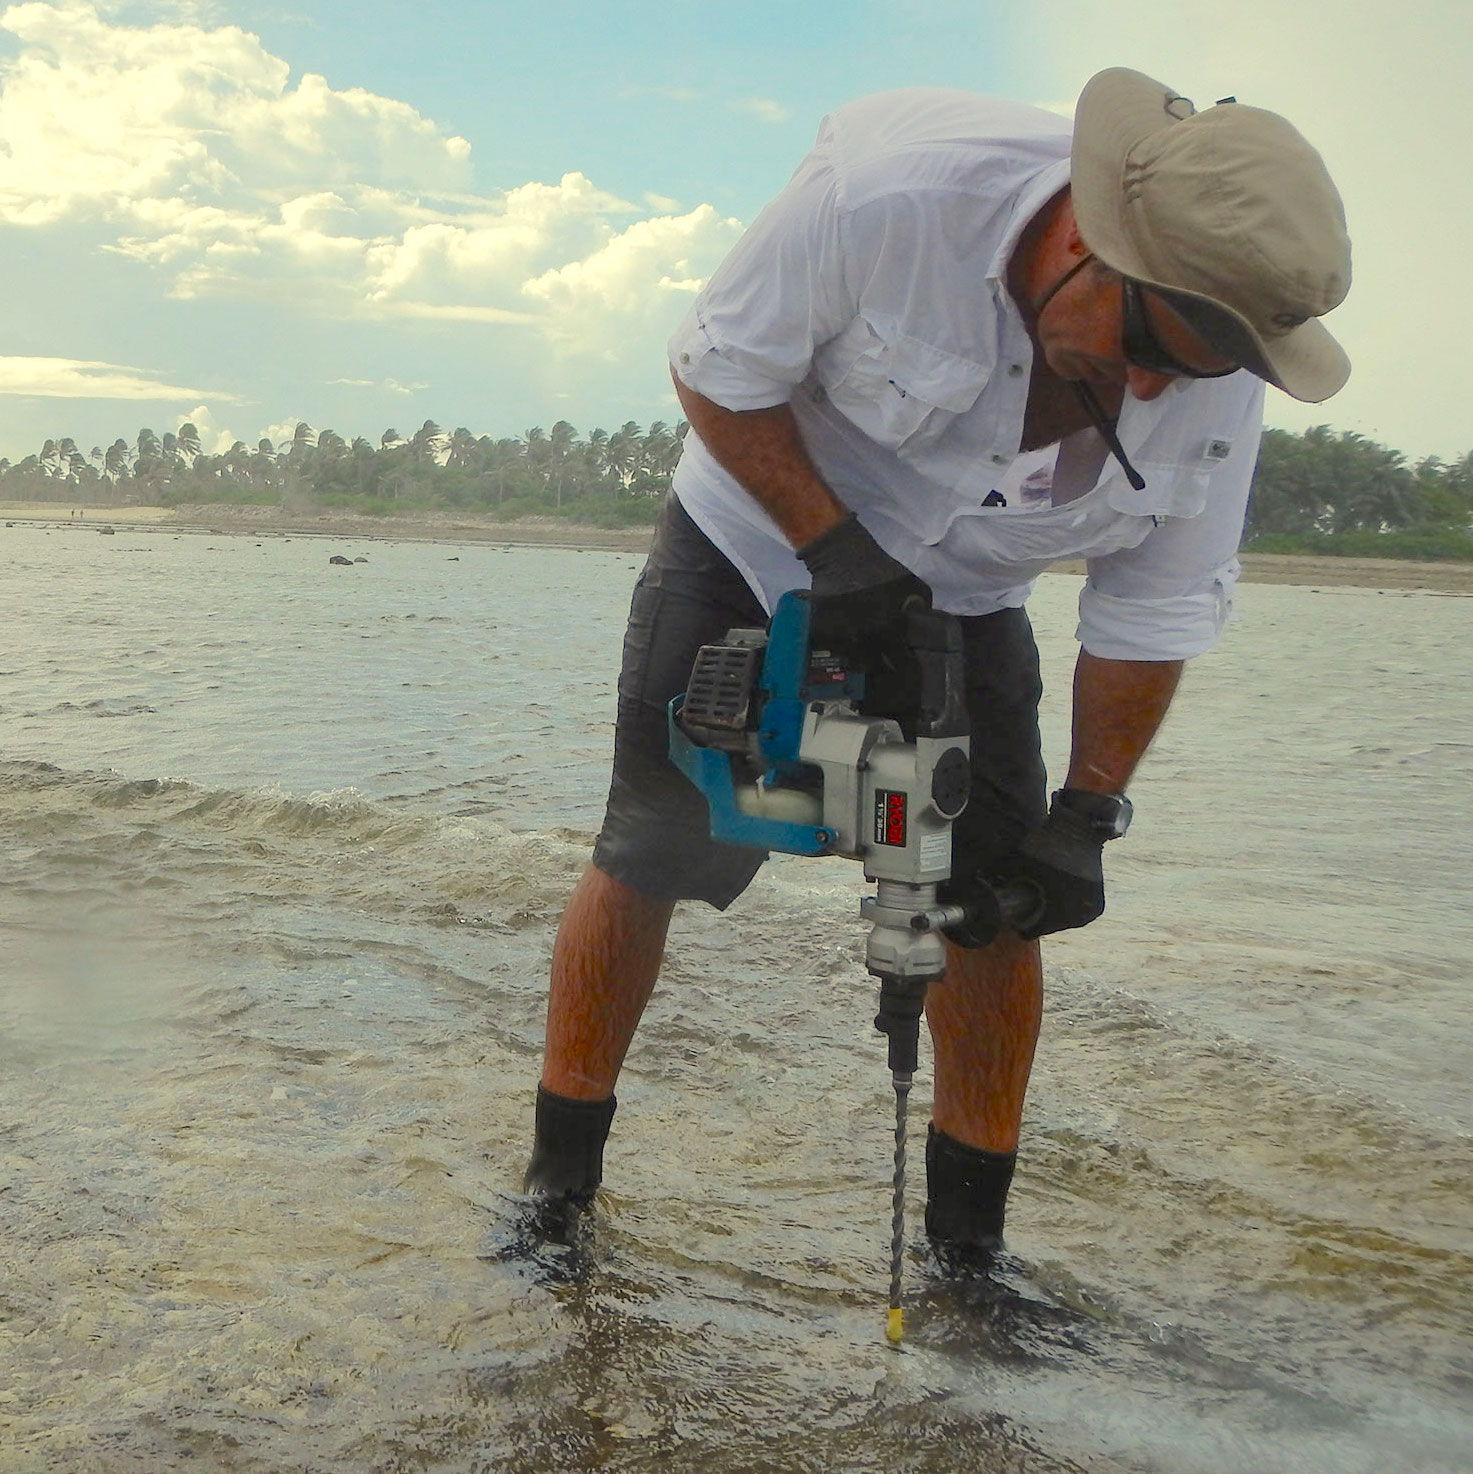
Above: Curt Storlazzi drills an instrument mount into a reef flat on Roi-Namur island. Photo by USGS [Larger version] 
Above: Defense Department facilities are visible in this satellite photo of Roi-Namur Island. Credit: DigitalGlobe. [Larger version] 
Above: Coral reefs surround Kwajalein Atoll, a ring of islands enclosing a shallow lagoon. Photo by Tom Reiss, USGS [Larger version] 
Above: A large wave crashes on the reef at Laysan Island. Photo by Michele Reynolds, USGS [Larger version] |
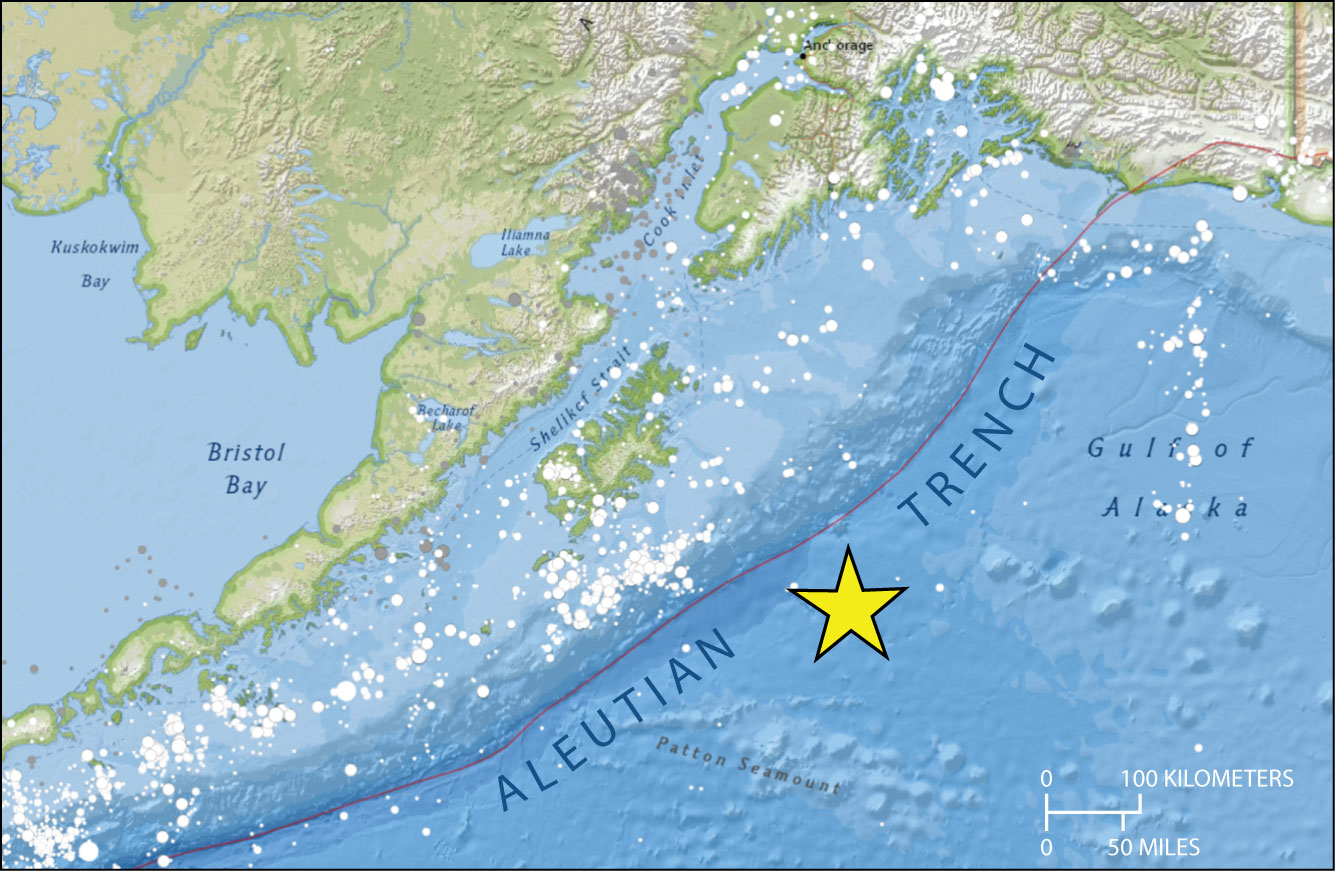
A magnitude 7.9 earthquake (yellow star) off southern Alaska on January 23 prompted tsunami alerts for Alaska, Canada, and the U.S. west coast. White circles show epicenters of past earthquakes, 1900-2015; the larger the circle size, the greater magnitude. Modified from USGS interactive map. [Larger version]
USGS geophysicist Eric Geist fielded questions about tsunamis after a magnitude 7.9 earthquake off southern Alaska prompted a tsunami watch for the U.S. west coast. The alert was issued shortly after midnight January 23 and canceled a few hours later, when coastal tide gauges and deep-ocean tsunami detectors had reported wave heights less than a foot. Fox 2/KTVU reporter Tom Vacar asked Geist about the possibility of a large tsunami hitting San Francisco’s Ocean Beach. Geist told him the largest credible wave would be 3 to 5 meters (10 to 15 feet) high, information that was included in the resulting news story. Those wave heights come from computer models in the SAFRR Tsunami Scenario, a scenario of a large hypothetical tsunami developed to assist emergency planning in California. The Kodiak earthquake struck close to the epicenter of the hypothetical scenario earthquake but on a different type of fault. Contact: Eric Geist, [email protected], 650-329-5457
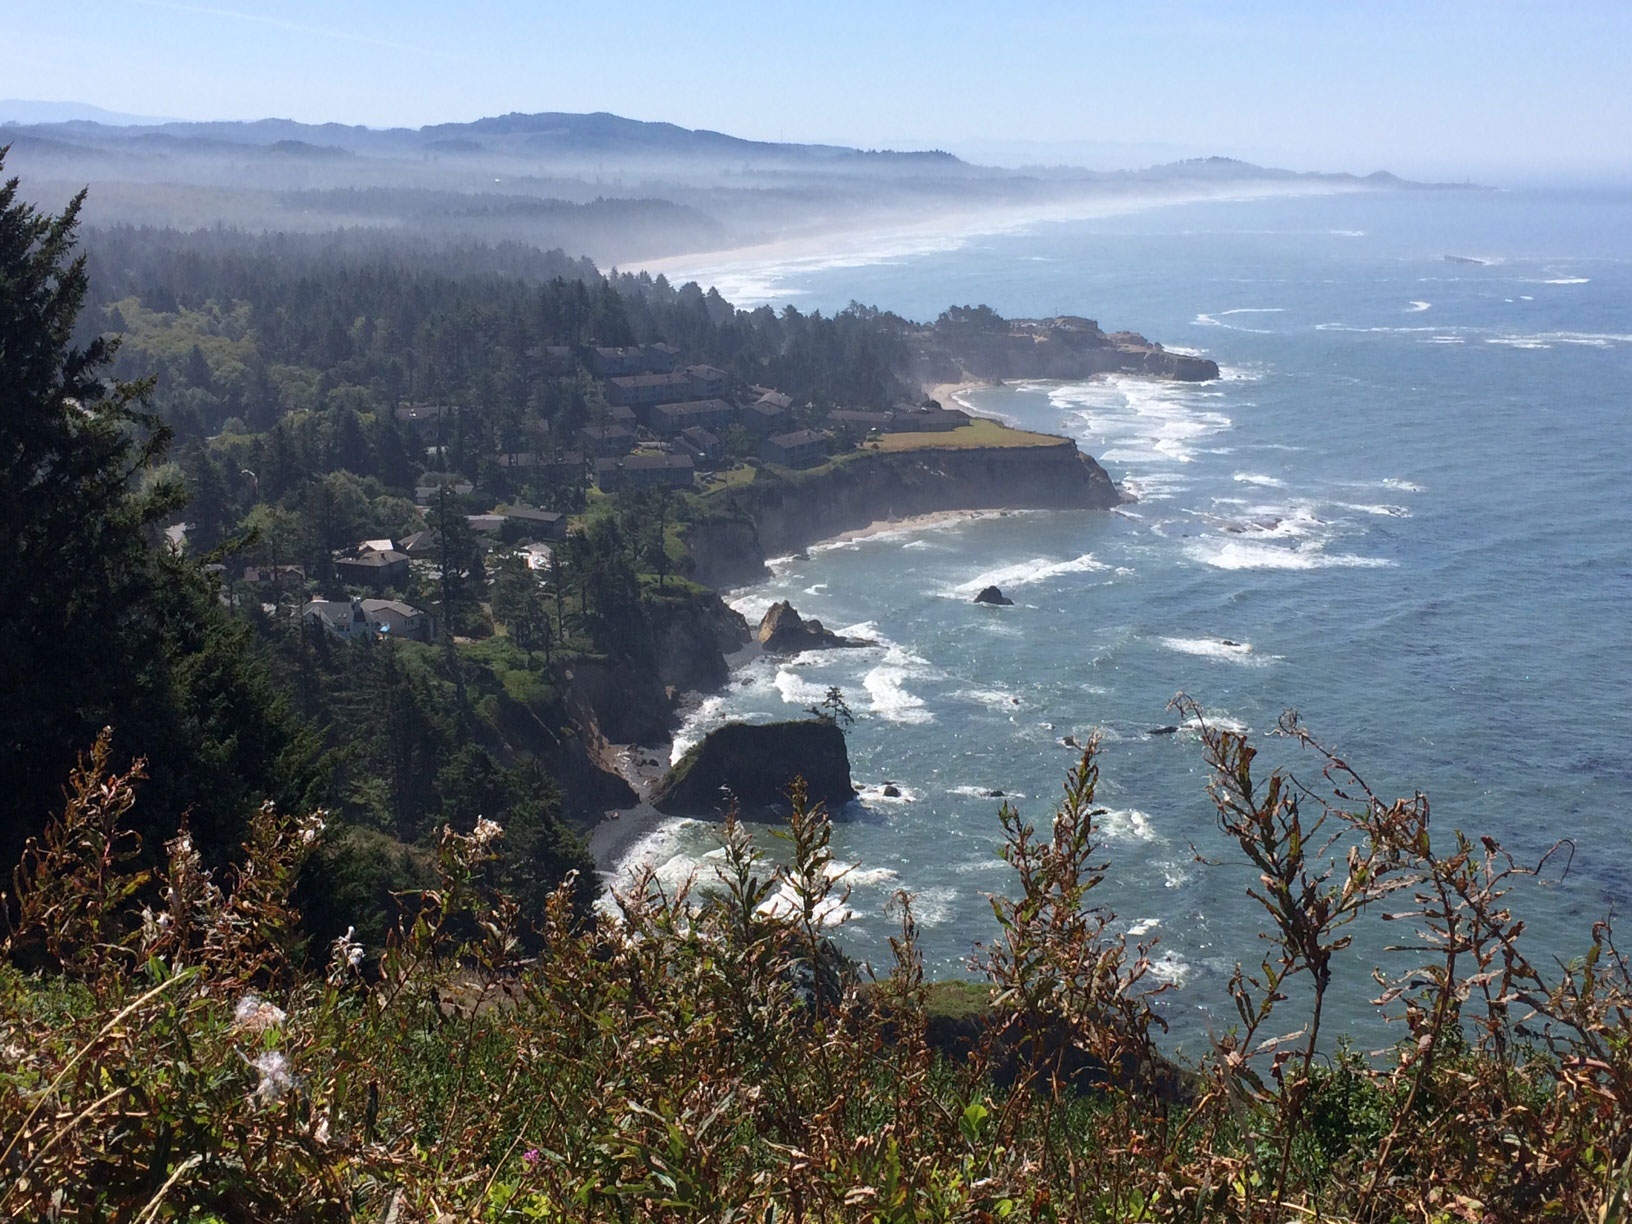
Otter Rock, Oregon. The Oregon coast is one of the areas that could be affected by a large earthquake on the Cascadia subduction zone. Credit: Janet Watt, USGS [Larger version]
The USGS Pacific Coastal and Marine Science Center hosted two back-to-back subduction-zone workshops in Santa Cruz, California, from February 5–8, 2018. Participants included USGS scientists from the Coastal and Marine Geology Program (CMGP), the Earthquake Hazards Program(EHP) the National Cooperative Geologic Mapping Program, and the Landslide Hazards Program, plus academic collaborators from Humboldt State University and Oregon State University. The first workshop, led by Janet Watt and Nathan Miller (CMGP), focused on developing a science strategy for a new Coastal and Marine Subduction Zone Marine Geohazards Project. The second, led by Joan Gomberg and Brian Sherrod (EHP), brought together researchers working to reduce uncertainty related to Cascadia megathrust earthquake recurrence. These collaborations are part of a USGS-wide effort to advance subduction-zone science and reduce risk from earthquakes, tsunamis, landslides, and volcanic eruptions. Contact: Janet Watt, [email protected], 831-460-7565
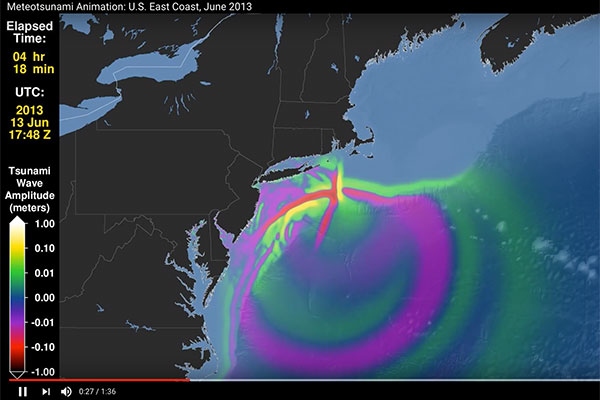
Screenshot from an animation of a meteotsunami caused by a fast-moving weather front on the U.S. Atlantic coast, June 13, 2013. View the animation. Credit: National Oceanic and Atmospheric Administration.
On February 6, USGS research geophysicist Eric Geist spoke to reporters Rachel Becker of The Verge and Grace Toohey of The Advocate about tsunami hazards on Atlantic and Gulf of Mexico shores. They were writing articles about a tsunami alert sent that morning to cell phones across the U.S. East Coast, the Gulf of Mexico, and the Caribbean. The warning was a false alarm caused by a technical glitch, but it raised the question: what’s the likelihood of a dangerous tsunami in these regions? The Advocate article quoted Geist’s description of meteotsunamis, weather-generated tsunamis that could affect Gulf of Mexico shores. The Verge article linked to several USGS publications, including one written by Geist and others titled “Could It Happen Here?” Geist is part of a USGS team that studies tsunamis and tsunami sources. Contact: Eric Geist, [email protected], 650-329-5457

Cover of the February 2018 issue of Eos.
USGS research on a big earthquake fault off Alaska and Canada is featured on the cover of Eos, a journal of Earth and space science news published by the American Geophysical Union. “A Closer Look at an Undersea Source of Alaskan Earthquakes” describes findings from USGS-led surveys along a 500-kilometer-long undersea section of the Queen Charlotte-Fairweather fault. This large strike-slip fault off southeast Alaska and western British Columbia has generated several large earthquakes in the past century. Future quakes and associated tsunamis could threaten coastal communities and tourists in the region. The article appeared online in August 2017 and in print in the February 2018 issue. Contact: Danny Brothers, [email protected], 831-460-7460
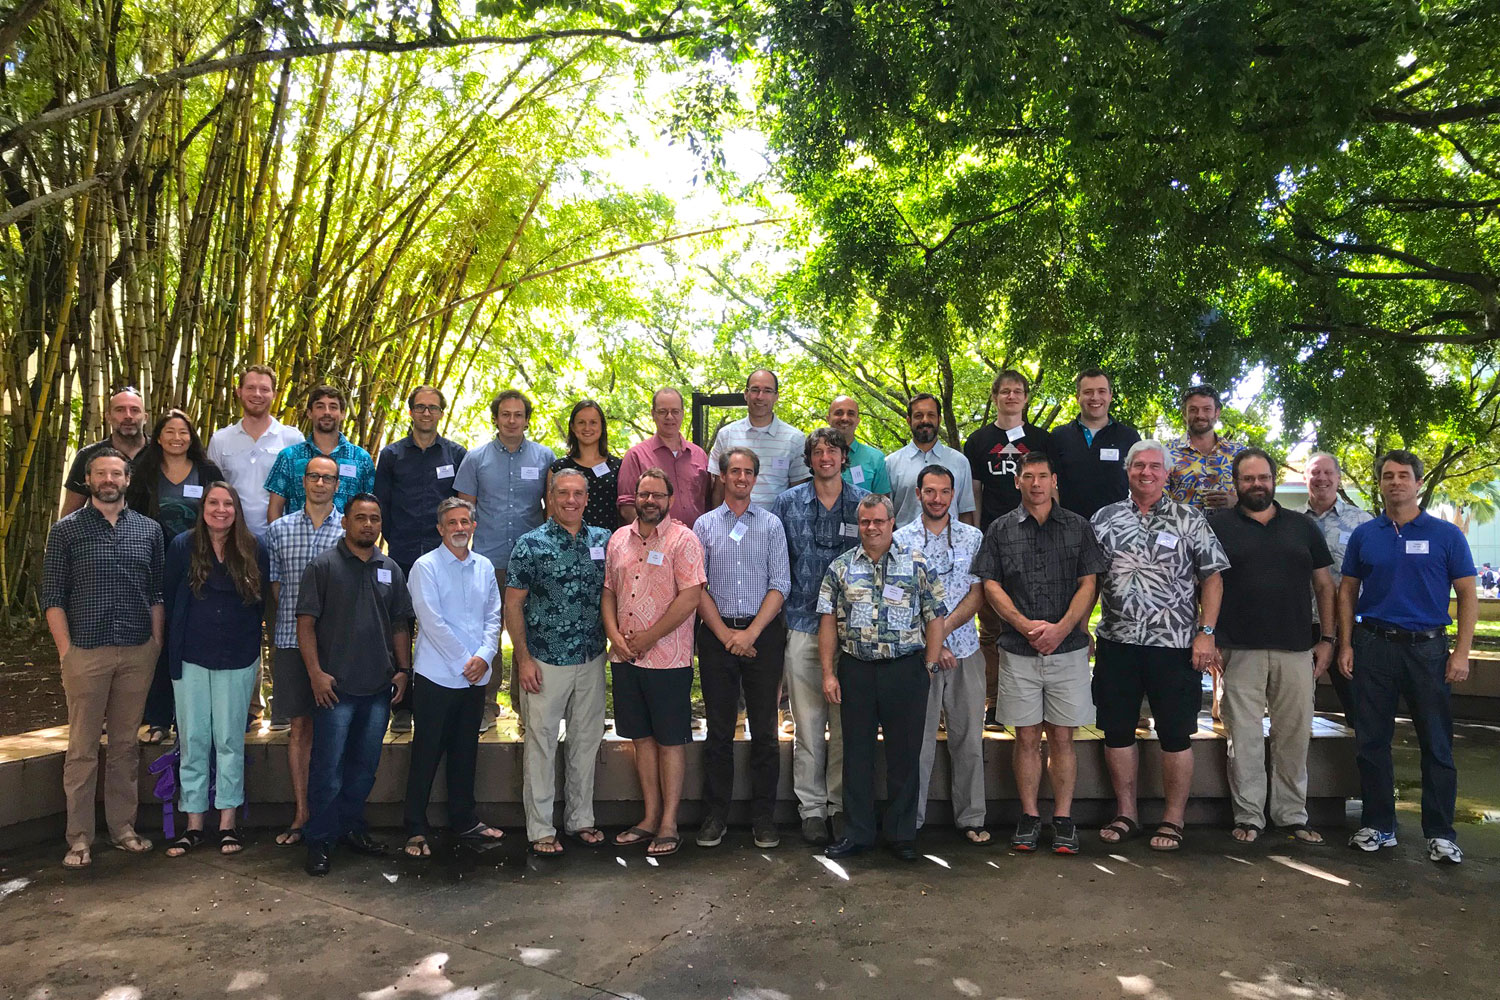
Participants at the workshop "Understanding Flooding on Reef-lined Island Coastlines." Workshop leader Curt Storlazzi is sixth from left in front row (flowered shirt). [Larger version]
USGS research geologist Curt Storlazzi led a workshop on “Understanding Flooding on Reef-lined Island Coastlines” (UFORIC) in Honolulu, Hawaiʻi, from 5–7 February. Participants assessed the state of the science, identified knowledge gaps, and explored ways to produce real-time flood forecasts and improve climate-change impact assessments. The meeting drew more than 30 experts from Australia, New Zealand, Fiji, the Republic of the Marshall Islands, Hawaiʻi, Spain, France, Belgium, the Netherlands, Germany, Israel, and the U.S. Topics included sea-level rise, wave climate (wave height, period, and direction in a particular location), how waves and water levels change as they move shoreward over coral reefs, and how coral reefs, reef-derived sediment, and the adjacent shorelines may evolve due to climate change. Storlazzi heads the USGS Coral Reef Project and The Impact of Sea-Level Rise and Climate Change on Pacific Ocean Atolls that House Department of Defense Installations project. Contact: Curt Storlazzi, [email protected], 831-460-7521
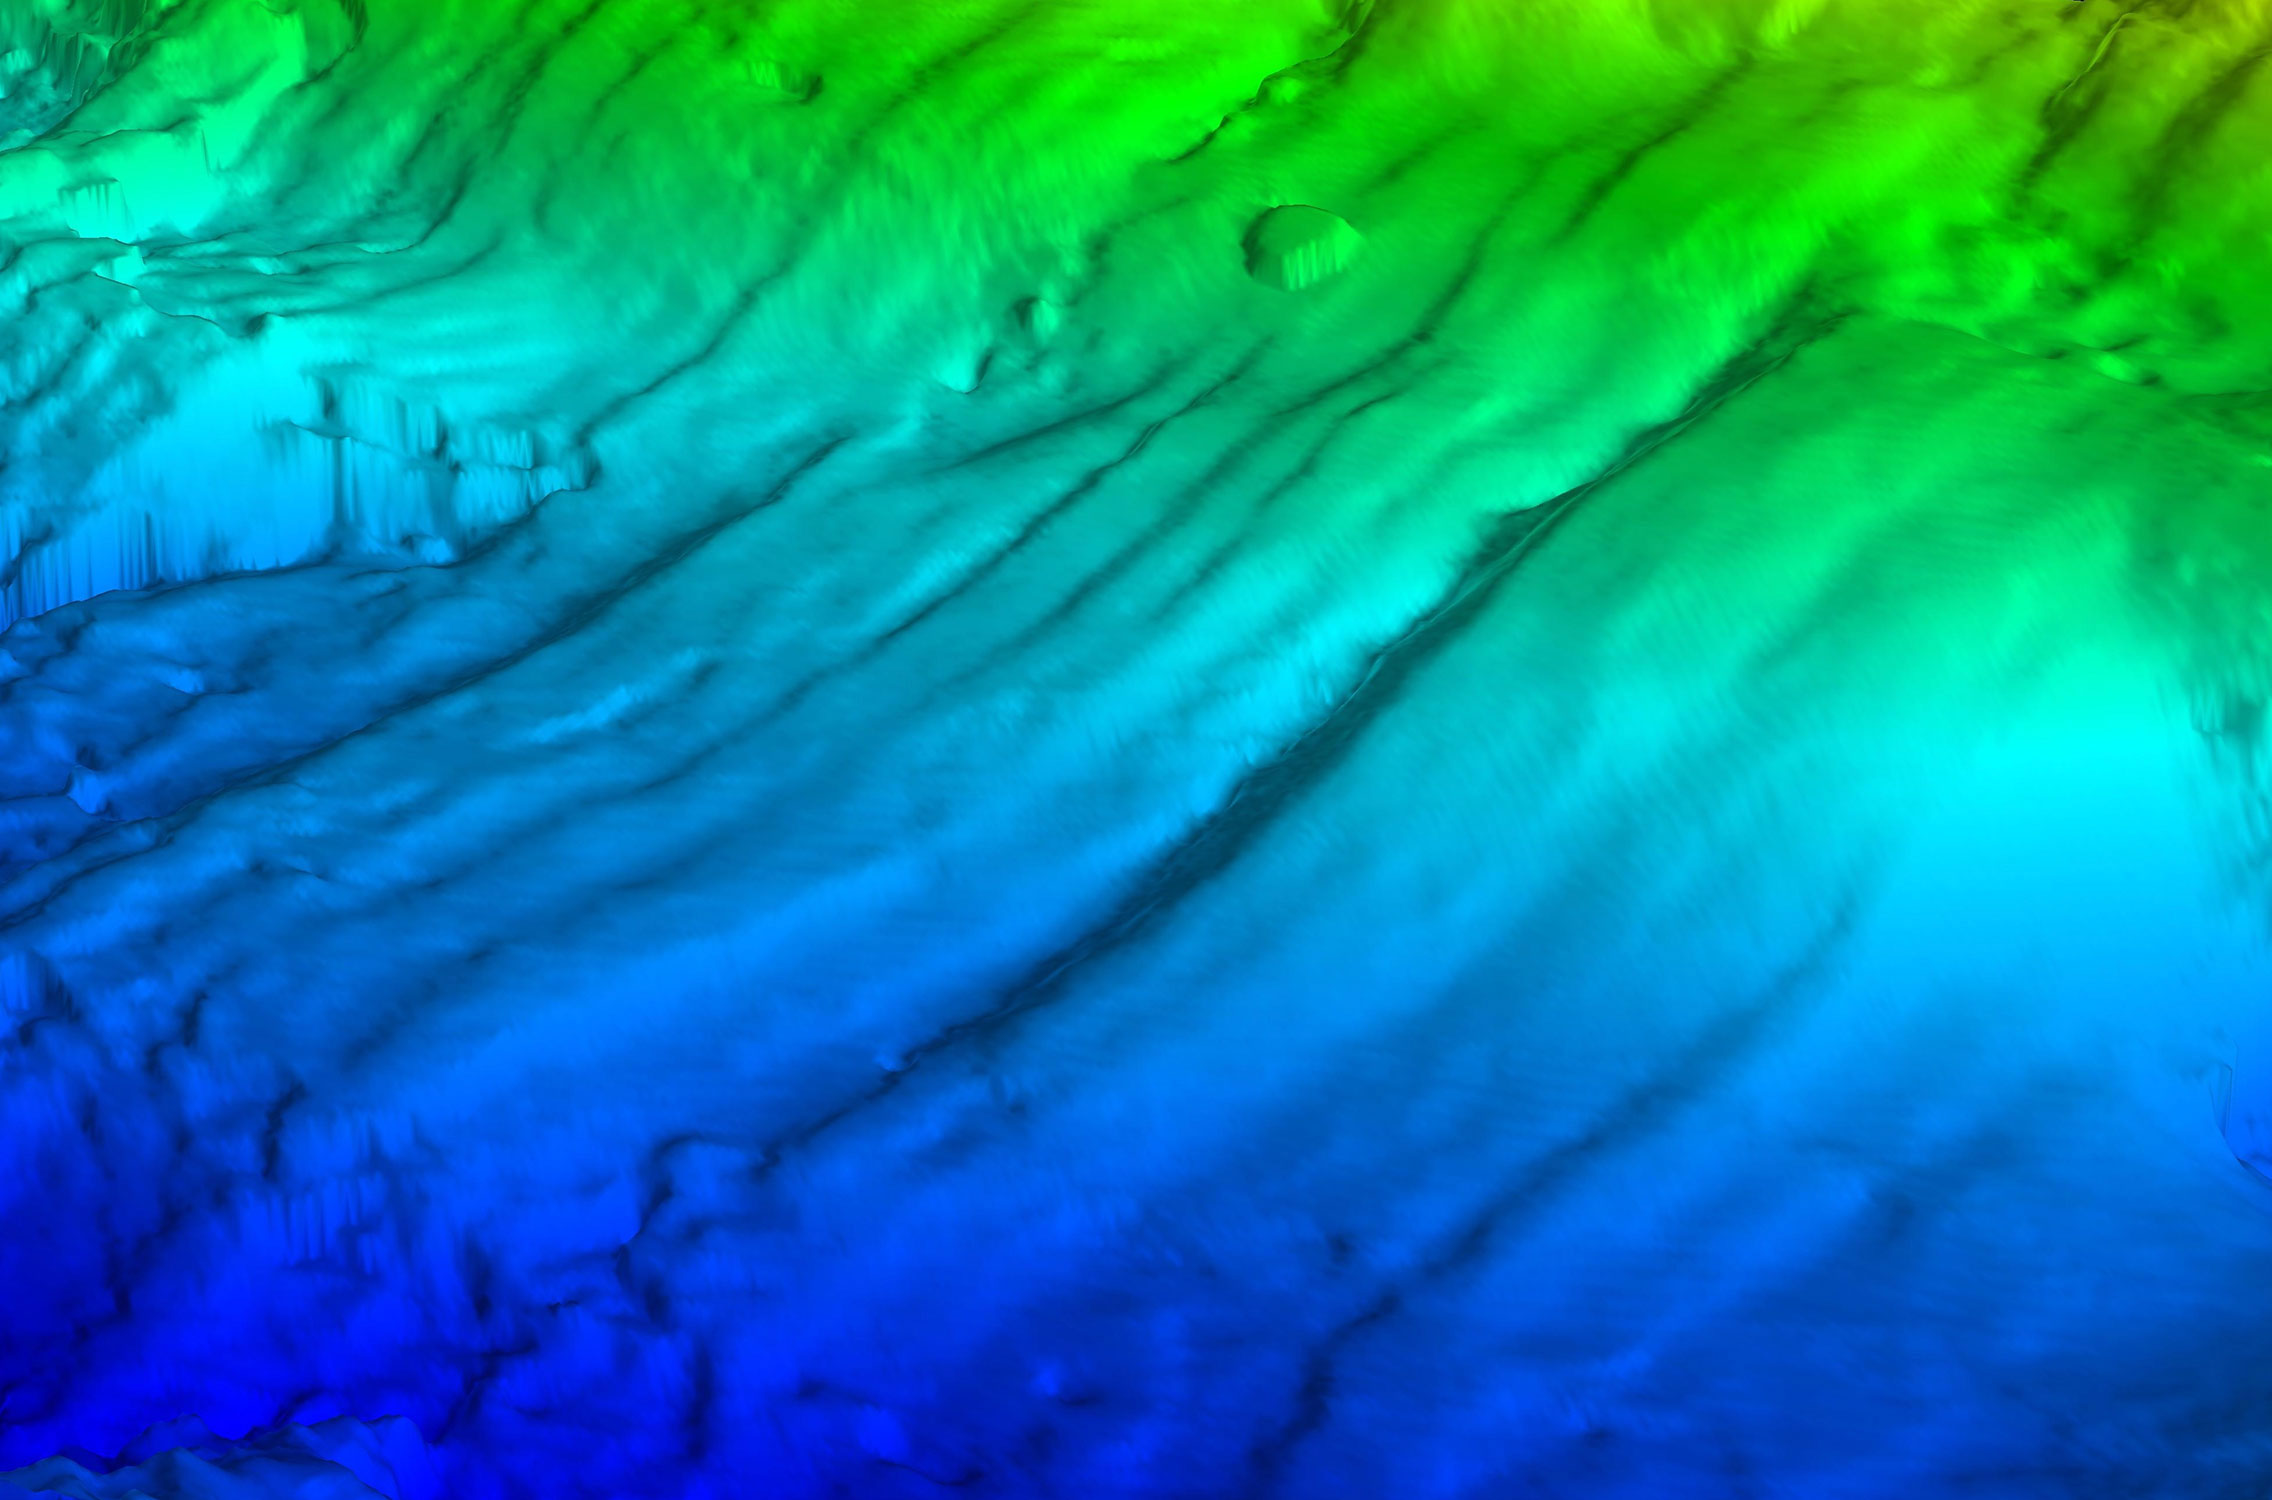
3D computer image showing corrugations, or giant grooves, beneath the seafloor where the Cocos and Caribbean tectonic plates grind past each other. Scientists stretched the image to highlight the grooves. Source: Jared Kluesner and Joel Edwards, USGS and UC Santa Cruz [Larger version]
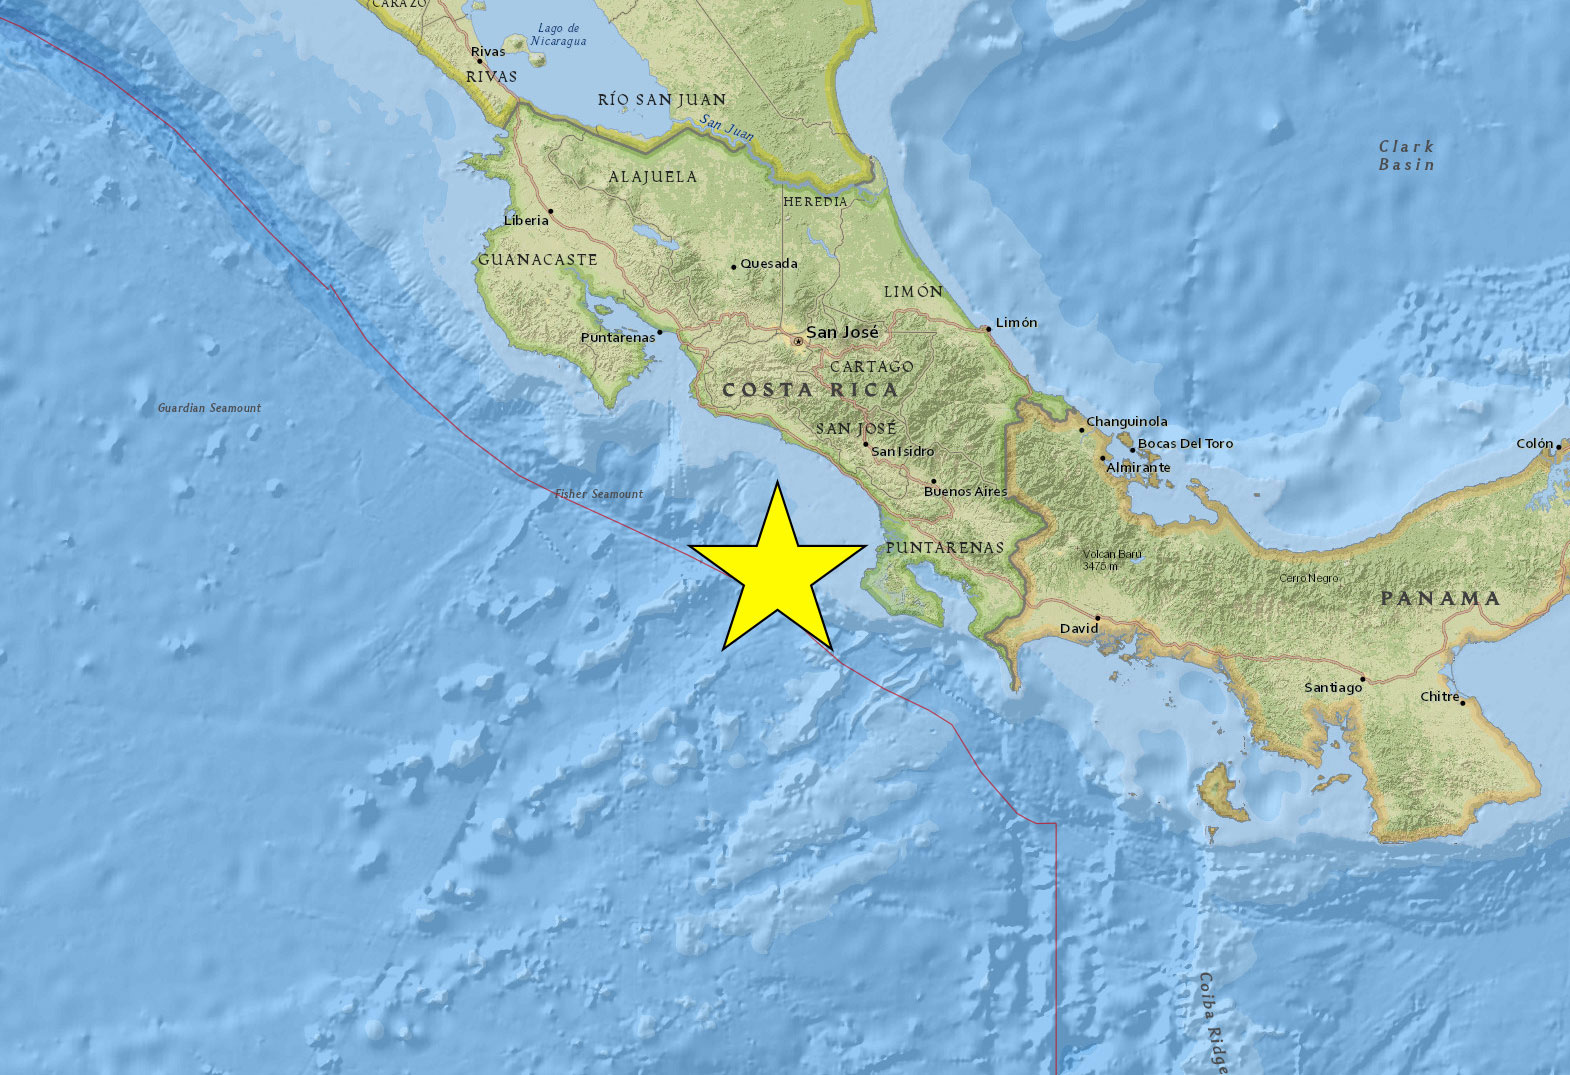
A yellow star marks the study area in the Pacific Ocean southwest of Costa Rica. Source: USGS [Larger version]
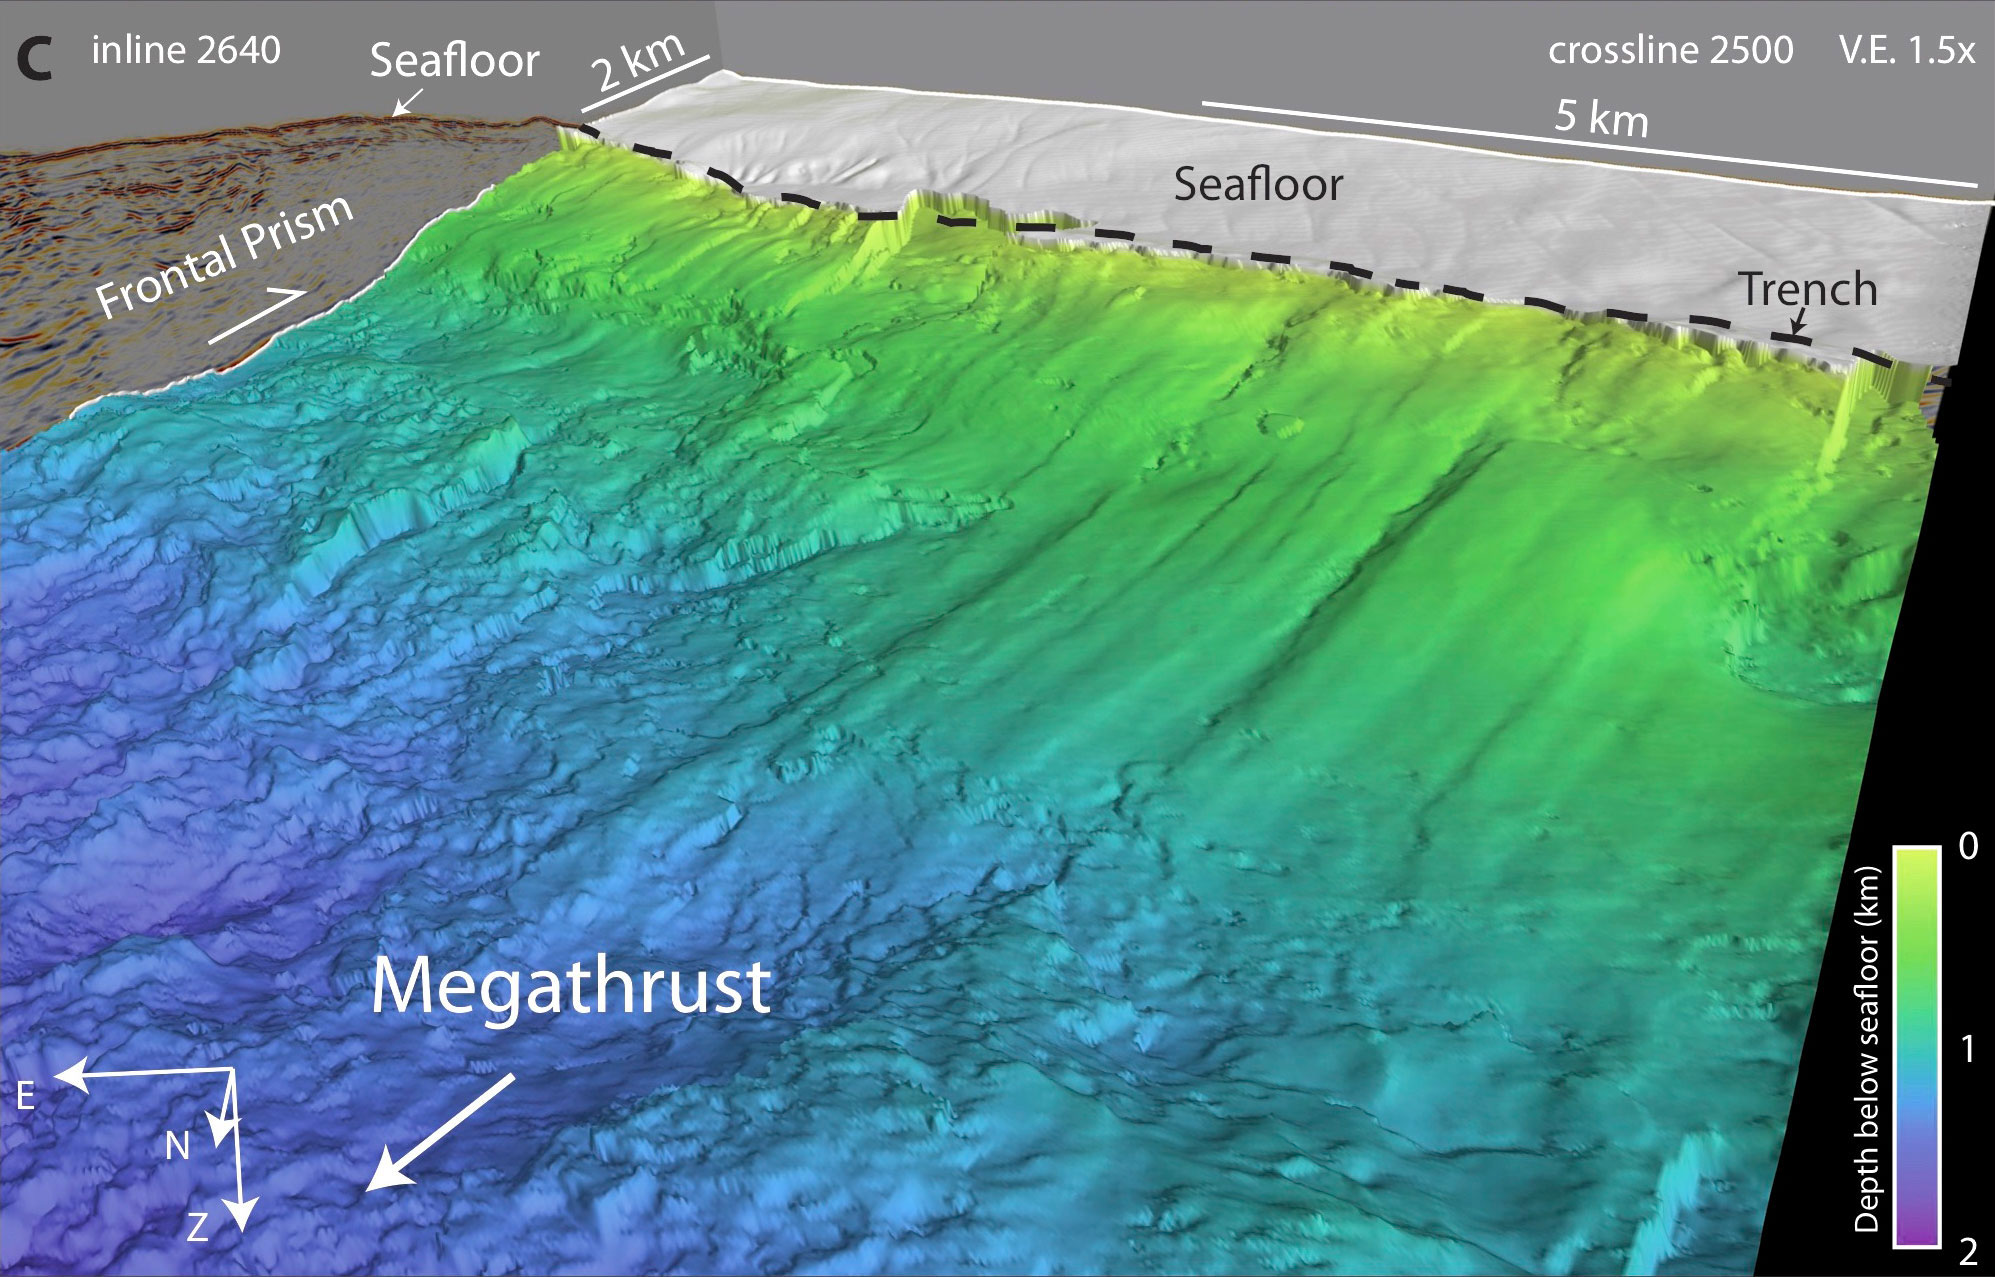
Computer image of bedrock grooves (corrugations) derived from 3D seismic imaging offshore of Costa Rica. It shows the megathrust fault surface of the Cocos Plate diving beneath the Caribbean Plate, with the upper plate virtually removed. Some of the fault surface has long, straight corrugations; some appears more jumbled. Researchers stretched the image slightly to make the grooves easier to see. The view is roughly from Costa Rica looking offshore. Source: USGS and UC Santa Cruz [Larger version]
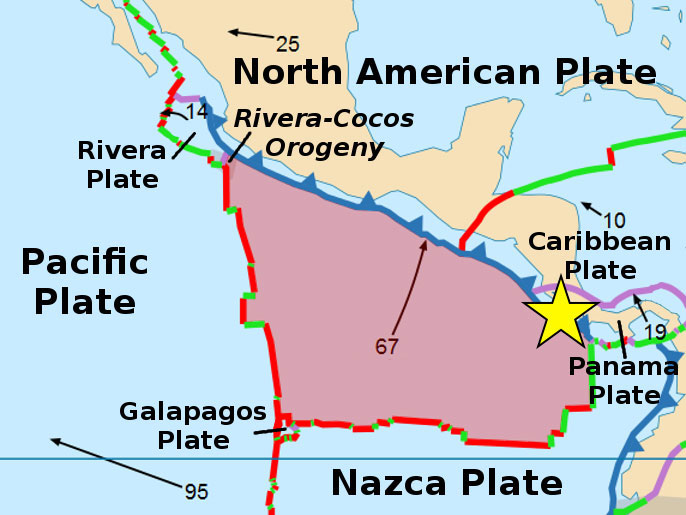
Diagram of the Cocos Plate (purple) in relation to nearby tectonic plates. The yellow star indicates the study area. Source: Modified from Alataristarion [CC BY-SA 4.0], via Wikimedia Commons
Imagine dragging your outstretched fingers through wet beach sand, leaving long grooves behind. Scientists recently discovered enormous grooves buried under the seafloor near Costa Rica. The detailed three-dimensional data they used to uncover these corrugations can help them better understand large subduction zone earthquakes and related tsunamis worldwide.
In an article published online by Nature Geoscience, researchers reported finding corrugations, or giant grooves, kilometers long, hundreds of meters wide, and tens of meters high, between the Cocos and Caribbean tectonic plates that form part of the Costa Rica subduction zone. Using 3D seismic imaging techniques developed by the oil industry, combined with state-of-the-art computer visualization software, scientists from the U.S. Geological Survey, University of California Santa Cruz, University of Texas, and McGill University produced an unprecedented, detailed view of the megathrust fault formed by these colliding and sliding plates.
“Subduction zones are hugely important, both because of the hazards they pose and because it’s where the earth destroys crust,” said lead author Joel Edwards, a USGS student contractor pursuing a Ph.D. at UC Santa Cruz. “And megathrust faults, within subduction zones, host the largest earthquakes on the planet. They are more likely to generate tsunamis, which as we saw from Japan and Sumatra, can be a bigger hazard than earthquake shaking.” In the United States, subduction zones with megathrust faults exist offshore of Alaska, Washington, Oregon, Northern California, Puerto Rico, the US Virgin Islands, Guam, and the Northern Mariana Islands.
“Gently rolling hills and valleys that are parallel and stretch for miles.” That’s how Edwards described the scene if you could stand on the fault surface looking across the grooves. “Corrugations are a great record of how blocks are sliding past each other along a fault.” Scientists have found similar grooves at the base of fast moving glaciers and other faults, but not on megathrust faults.
This unique, highly-detailed image revealed other buried secrets. Small changes in groove direction record a history of shifts in plate movement. Also, the rougher areas indicate where the megathrust jumped to form a new fault, and hasn’t had enough time to smooth the surface. Other details in the 3D seismic imaging data imply that the grooves trap fluids that could lubricate the fault and affect earthquake size and frequency.
Petroleum companies developed 3D seismic imaging several decades ago to help find oil and gas in areas with complex geology. For offshore 3D exploration, ships tow several streamers, kilometers long, containing hundreds of waterproof microphones floating just beneath the waves. These hydrophones record sound bounced off the rock layers below the seafloor. Extensive computer processing and advanced visualization techniques uncover hidden geologic details in three dimensions.
“It’s like the Hubble Telescope for geologists,” said co-author Jared Kluesner, a USGS geophysicist. “But collecting and processing this type of data can be really expensive and time consuming.” For this study, data collected in 2011 took several years to analyze and visualize. Kluesner and study co-author professor Eli Silver of UC Santa Cruz are the Ph.D. advisors of Edwards.
“I thought it was a great paper,” said Janet Watt, a USGS geophysicist who was not involved with the study. “It's the first time we've been able to image the megathrust surface itself in such detail. I think there could be a lot more papers to come from this.”
Now that the technique has proven to be so valuable, USGS scientists and academic partners are eager to use 3D seismic imaging closer to home: the Cascadia subduction zone just offshore of Washington, Oregon, and Northern California. In February 2018, researchers met to plan a cooperative Cascadia research program, which could lead to the collection of a new 3D seismic survey to better characterize the threat of great Cascadia subduction zone earthquakes.
“Cascadia has a history of large earthquakes and tsunamis,” said Kluesner, “yet we still don’t know that much about the megathrust there. It’s an obvious choice.”
The article, titled “Corrugated megathrust revealed offshore from Costa Rica,” is available from Nature Geoscience. The National Science Foundation funded data collection.

Above: Normal high tide at Manhattan Beach, Los Angeles, on January 6, 2017. Right: “King” high tide at Manhattan Beach, Los Angeles, on February 10, 2017. From 360° video [Larger version]
USGS oceanographer Juliette Finzi Hart shot 360-degree videos of king tides—the highest high tides of the year—throughout the Los Angeles region in 2016 and 2017. Roughly a dozen times a year, king tides lap the shores high up on the beach; this will be the “normal” high tide in about 20 years, based on National Academy of Sciences sea-level rise projections. King tide videos provide a glimpse of the future, and they help USGS scientists fine-tune the Coastal Storm Modeling System (CoSMoS), which combines projected sea-level rise and storm intensities to forecast future coastal flooding. The CoSMoS team has been working with partners to develop immersive virtual reality and video products to help communities understand how coastal hazards and rising seas will alter California's coastline. Previous products include the 2016 Santa Monica Pier Owl project, in which USGS CoSMoS simulations allowed people to see how Santa Monica beaches could be transformed in the future. Contact: Juliette Finzi Hart, [email protected], 831-460-7522
Acting deputy director of the USGS Pacific Coastal and Marine Science Center Nadine Golden attended a workshop on restoring a sand-mining operation on California’s Monterey Bay. The CEMEX Lapis plant produces an estimated 200,000 to 300,000 cubic yards of sand per year, enough to fill up to 30,000 dump trucks. The last coastal sand mine in the U.S., it is scheduled to close no later than 2020. A consortium of organizations met January 17 with the goal of using “the best available science regarding…biodiversity, ecological function, coastal processes, and threats” to develop recommendations for future restoration and management of the 400-acre site. Golden sought to understand the scientific needs of participants and explained USGS capabilities and available data sets to inform their efforts. Contact: Nadine Golden, [email protected], 831-460-7530

USGS geologist Patrick Barnard describes flooding threats to the U.S. East Coast in an interview with Philadelphia's NBC10 meteorologist Tammie Souza.
USGS geologist Patrick Barnard gave a live interview to Philadelphia's NBC10 meteorologist Tammie Souza on January 23 during a national weather conference in Lake Tahoe, California. He explained that U.S. East Coast communities face increasing flooding threats from a combination of accelerating sea-level rise, subsidence of coastal land, and severe storms. Barnard leads development of the Coastal Storm Modeling System (CoSMoS), which combines projected sea-level rise with a range of storm intensities to predict coastal flooding along West Coast shores. Several California communities are already using CoSMoS projections to plan for future flooding threats. View the interview (3 minutes). Contact: Patrick Barnard, [email protected], 831-460-7556
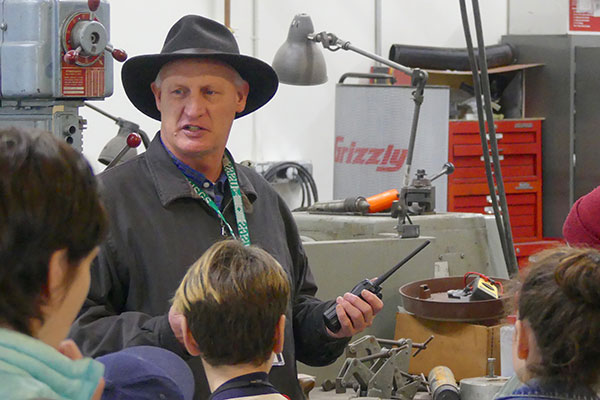
Rob Wyland guides students through the USGS Marine Facility, where engineers and technicians design, fabricate, and maintain equipment for field research. Photo by Rex Sanders, USGS
On January 17, 4th and 5th graders from De Laveaga Elementary School visited the USGS Pacific Coastal and Marine Science Center in Santa Cruz, California. Center scientists guided three groups of about 25 students each, plus teachers and parent chaperones, through three exhibit areas. Rob Wyland introduced the students to seismic-reflection equipment and seafloor-mapping techniques in the center’s Marine Facility. Helen Gibbons and Andy Ritchie showed them how scientists use computers and special software to turn aerial photos into 3D maps of the California coast, enabling center scientists to monitor a huge landslide in Big Sur. Tour organizer Carol Reiss shared her enthusiasm for geology as she used fossils, basic rock types, and paper models to illustrate geologic principles and showed the students what it’s like to explore the seafloor from inside a submersible. Contact: Carol Reiss, [email protected], 831-460-7480
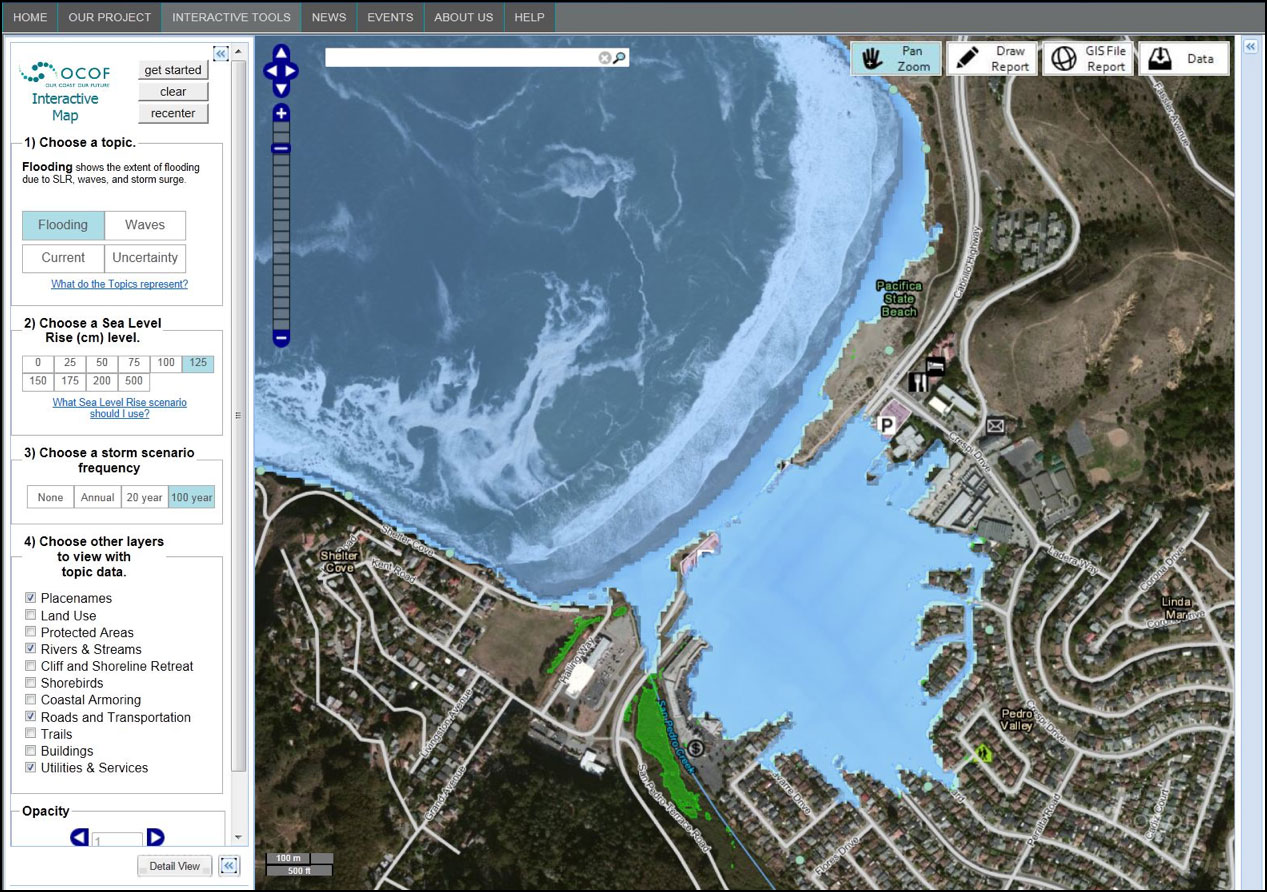
In Pacifica, California, low-lying Linda Mar Beach is rapidly eroding and provides minimal flood protection for the adjacent community. Projections of future coastal flooding by the USGS-developed Coastal Storm Modeling System (CoSMoS) indicate that the City of Pacifica is among the most vulnerable cities to climate change on the entire outer coast of California. This map from Our Coast, Our Future shows the projected future flooding at Pacifica considering 1.25 meters of sea level rise with the added impacts of an extreme storm. [Larger version]
USGS geologist Patrick Barnard spoke to the public at a “Coffee and King Tides” gathering held in Half Moon Bay, California, on December 4. King tides are unusually high tides caused by the alignment of the sun, Earth, and moon. County officials invited the public to view the high water levels caused by a king tide on December 4, and learn about county plans for the future, when sea level rise could turn unusually high tides into the norm. A December 7 story in the Half Moon Bay Review quoted Barnard extensively. He is the principal investigator for the USGS Coastal Storm Modeling System (CoSMoS), which projects coastal flooding due to both future sea level rise and storms integrated with long-term coastal evolution. Contact: Patrick Barnard, [email protected], 831-460-7556

During the March 2, 2014 overwash event in the Republic of the Marshall Islands, seawater regularly topped the manmade perimeter berm on the island of Roi-Namur and covered large areas of the adjacent land surface.
Results of USGS research investigating sea-level rise impacts to Department of Defense (DoD) facilities in Pacific atolls are included in the National Defense Authorization Act for Fiscal Year 2018. This act, signed into law on December 12, 2017, authorizes and prioritizes funding for DoD military activities and construction. USGS scientists used Kwajalein Atoll in the Marshall Islands as a field site to fine-tune their computer models forecasting how rising sea-level and future storm waves will likely affect the sustainability of low-lying Pacific islands. The act reports their forecasts of flooding projected to threaten a major Air Force radar installation in the Republic of the Marshall Islands in upcoming decades. Contact: Curt Storlazzi, [email protected], 831-460-7521
Back to the top of the page.
| 2018 | 2017 | 2016 | 2015 | 2014 |
| 2013 | 2012 | 2011 | 2010 | 2009 |
| 2008 | 2007 | 2006 | 2005 | 2004 |
USGS Coastal and Marine Geology Program News
Sound Waves
Bi-monthly newsletter presenting USGS coastal and marine research
DOI Newswave Newsletter
U.S. Department of the Interior newsletter featuring ocean, coastal and Great Lakes activities
