USGS Coastal and Marine Hazards and Resources Program
![]() Title |
Figures |
1-Introduction |
2-Data Collection and Processing |
3- Geologic Interpretation |
4-References |
5-Maps |
Spatial Data |
Acknowledgments
Title |
Figures |
1-Introduction |
2-Data Collection and Processing |
3- Geologic Interpretation |
4-References |
5-Maps |
Spatial Data |
Acknowledgments
 |
||
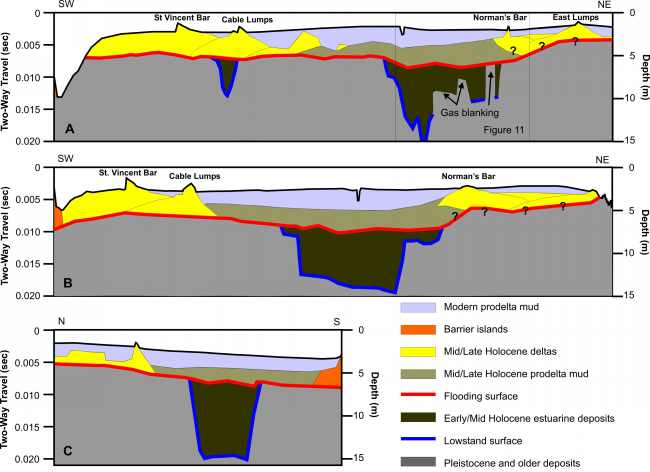
Figure 12. Line-drawing interpretations of three seismic profiles showing the estuary's shallow stratigraphy. Vertical scales for the profile interpretations are provided in milliseconds (two-way travel time) and approximate depth in meters (assuming a seismic velocity of 1500 m/s). Profile locations are shown in figure 13. Ages associated with the units are inferred. | ||
