
Geology of the Estuary Floor
Earlier sediment studies include published reports (Kofoed and Gorsline, 1963; Isphording, 1986) and online datasets available from the NOAA Coastal Services Center (1999). The sample data from these earlier studies show that the deep, smooth, central parts of Apalachicola Bay and western St. George Sound are floored with silt and minor amounts of sand and gravel. East of Porter's Bar, and west of St. Vincent Bar, the floor of the estuary is sand to muddy sand as is the southern edge of the estuary (Kofoed and Gorsline, 1963; Isphording, 1986). Many of the shoals are covered by oysters or shelly sand (Kofoed and Gorsline, 1963; Isphording, 1986; Donoghue and White, 1995).
The sidescan-sonar imagery (fig. 5), in concert with regional sediment datasets (NOAA, 1999) shown in figure 6 and the new, high-resolution bathymetry collected during this project (fig. 4), permit detailed mapping and interpretation of the sea-floor geology of the Apalachicola Bay and St. George Sound sections of the estuary (fig. 10).
Eleven facies were identified and include both natural and anthropogenic sea-floor features. These eleven units are described in the following bulleted paragraphs, and their distribution is shown relative to the hillshaded bathymetry in figure 10 and Mapsheet 3.
- Oyster - High backscatter on the sidescan-sonar imagery that coincides with shoal areas on the bathymetry are inferred to be covered by oysters. Samples and observations from previous studies show living oysters on a shelly, sandy bay floor (NOAA, 1999). Oyster beds cover 21.91 km2 of the study area.
- Dredge/oyster - The Intracoastal Waterway is a dredged channel that cuts through St. George Sound and the eastern part of Apalachicola Bay. Dredged material was deposited south of the channel, producing narrow, linear ridges and a series of subcircular mounds (fig. 8). Sidescan-sonar imagery and video observations suggest that high-backscatter returns from many of the dredged deposit surfaces are caused by the presence of oysters (NOAA, 1999). Mounds of dredge material that appear to be covered with oysters are found in Apalachicola Bay along the south side of the Intracoastal Waterway, north of Hotel Bar, and in St. George Sound, west of Platform Bar. These mounds cover 0.41 km2 of the study area.
- Dredge material - These anthropogenic deposits have the same origin as the dredge material/oyster areas; however, the surfaces of these deposits produce moderate-backscatter returns and are inferred to have no oysters on them. Areas classified as dredge material cover 0.78 km2. They are located in the eastern part of St. George Sound and along the western side of the section of the Intracoastal Waterway that trends northward to the mouth of the Apalachicola River.
- Shell/gravel - This bay-floor type was only identified in a small, relatively deep depression south of Cat Point. This facies produces a high-backscatter return, and in this area, bottom samples recovered shell hash and some gravel (NOAA, 1999). The shell and gravel appear to be a lag deposit, which may result from strong tidal currents in this area. The composition of the gravel and shell material is unknown. This facies covers 0.69 km2.
- Shelly sand - This bay-floor type produces moderate-to-high backscatter signatures in the sidescan-sonar imagery. Sediment samples from these areas recovered a mix of sand and shell hash (NOAA, 1999). The shelly-sand facies is found in three settings. It fringes many of the oyster bars, specifically, the eastern sides of Porter's, Platform, and St. Vincent Bars, along both sides of Hotel and Norman's Bars, and in patches around and between many of the smaller oyster bars. The facies also covers some shoals that are not covered by oysters, such as the shoal adjacent to Cedar Point, and two areas west of St. Vincent Bar. Lastly, shelly sand is observed as a lag deposit on the floor of troughs that are actively reworked by strong tidal currents. One of these troughs extends eastward along the southern side of the bay from West Pass, and another extends west into Apalachicola Bay south of Cat Point immediately west of the Bryant Patton Bridge. The shelly sand facies covers 16.33 km2 of the study area.
- Sand - This bay-floor type refers to clean sand that contains traces of mud and shell hash. It covers most of the eastern St. George Sound, a large part of the Apalachicola Bay, west of St. Vincent Bar, and sections of Apalachicola Bay's southern edge. This facies covers 52.21 km2 of the study area.
- Sand - tidal inlet -This bay-floor type refers to the flood tidal delta deposit shoreward of Government Cut, the manmade inlet that separates St. George Island from Little St. George Island. The surface of this feature is rippled and inferred to be primarily composed of sand. The flood tidal delta shoreward of Government Cut occupies 0.23 km2.
- Sand - sand wave - Two patches of sand waves were identified in the eastern part of St. George Sound where the bay floor is primarily sandy. The sand waves have 50 - 150 m wavelengths, 0.5 - 0.8 m heights, and crests that trend northwest-southeast. Many of the sand waves are asymmetrical and have steep, west-facing sides, which suggests net, westward migration. No sediment samples have been collected within the sand-wave fields, but samples surrounding these areas are sand to slightly gravelly sand (NOAA, 1999). Sand waves cover 1.39 km2 of the survey area.
- Sandy mud - mottled - Sections of the estuary floor that have a moderate-to-low backscatter signature which is interrupted by small high-backscatter patches that are mostly 5 - 15 m in diameter. This mottled bay floor occurs in narrow bands along parts of the southern side of St. George Sound, and in larger patches in the western part of Apalachicola Bay, on Higgins Shoal, and along both flanks of a low-relief ridge west of St. Vincent Bar. Sediment samples from these mottled areas contain sandy mud, but the origin of the mottled pattern is unknown. This facies covers 2.60 km2.
- Mud - The mud facies covers the largest part of the study area. It appears on the sidescan-sonar imagery as low backscatter, and sediment samples from the facies contain at least 70% silt plus clay and the remainder is sand (NOAA, 1999). The mud facies covers 134 km2 of the study area including much of the estuary floor within Apalachicola Bay and western St. George Sound. It generally occurs in sections of the study area more than 2 m deep.
- Bridge - The abutments for the Bryant Patton/St. George Island Bridge produce high-backscatter, rectangular areas in the sidescan imagery. Survey lines only trended close enough to image a portion of the bridge south of the Intracoastal Waterway.
|
|
Click on figures for larger images.
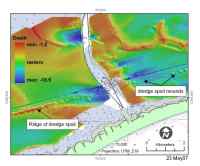 |
Figure 8. Bathymetric map of the Intracoastal Waterway near the Bryant Patton Bridge showing dredged material south of its channel.
|
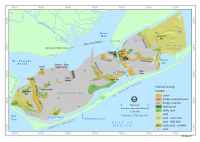 | Figure 10. Map showing the distribution of eleven sedimentary facies identified on the floor of Apalachicola Bay superimposed on the shaded-relief image of the bathymetry.
|
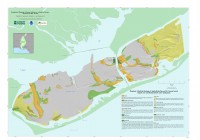 | Mapsheet 3. Surficial geology, shows the interpreted surficial geology with the locations of oyster bars superimposed on the sun-illuminated bathymetry.
|
|
