USGS Coastal and Marine Hazards and Resources Program
![]() Title |
Figures |
1-Introduction |
2-Data Collection and Processing |
3- Geologic Interpretation |
4-References |
5-Maps |
Spatial Data |
Acknowledgments
Title |
Figures |
1-Introduction |
2-Data Collection and Processing |
3- Geologic Interpretation |
4-References |
5-Maps |
Spatial Data |
Acknowledgments
 |
||
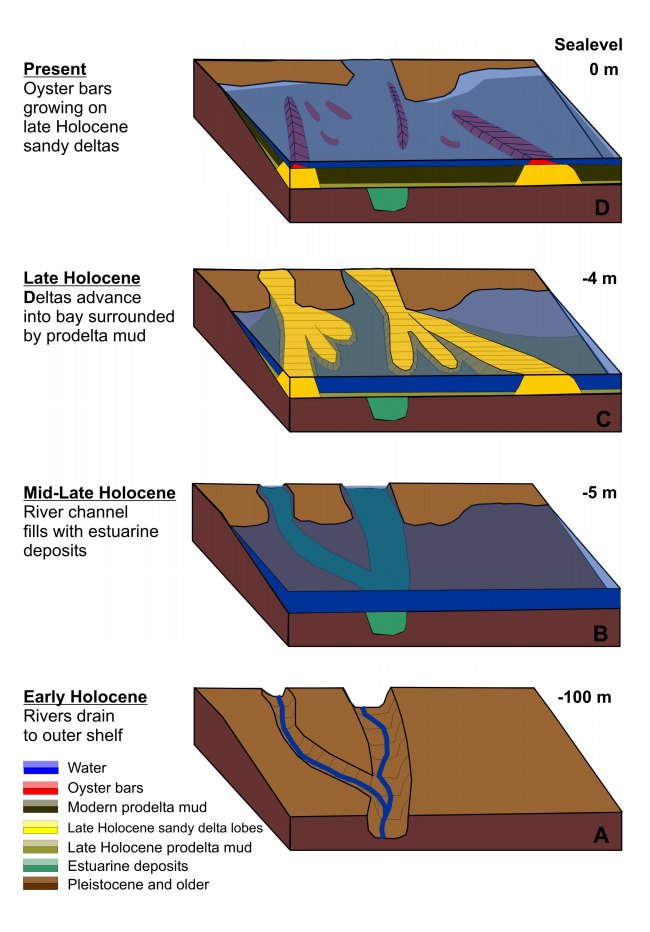
Figure 14. Schematic block diagram showing important steps in the evolution of the Apalachicola Bay region since the last lowstand of sea level. | ||
